Copyright
© ABE&M todos os dir
eitos r
eser
vados.
Impact of plasmatic lipids in
glycemic control and its influence
in the cardiometabolic risk in
morbidly obese subjects
Impacto dos lipídios plasmáticos no controle glicêmico e sua influência no risco cardiometabólico em pacientes obesos mórbidos
Ary Serpa Neto1, Felipe Martin Bianco Rossi1,
Rodrigo Dal Moro Amarante1, Nara Alves Buriti1, Marçal Rossi2
ABSTRACT
Objectives: To evaluate whether biochemical parameters are associated with a good glycemic control and to identify the occurrence of cardiometabolic risk variables. Material and methods: One hundred forty Brazilians were evaluated. The subjects were characterized with regard to glycemic control as good, fair and poor and were divided into tertiles by TG and HbA1c. We use the ROC curve to determine which variables were predicted of poor glycemic control and the factor analyses to identify the domains that segregated among the risk variables. Results: Fasting glucose and insulin levels, TG level, VLDL-C and HOMA-IR increased significantly across HbA1c tertiles. The best marker for identification of poor glycemic control was triglycerides. The presence of cardiometabolic abnormalities did not alter the glycemic control, but HOMA-IR was significantly higher in subjects with abnormalities. Conclusion: The use of TG levels offers a reasonable degree of clinical utility. In morbidly obese subjects insulin resistance is associated with individual cardiometabolic factors. Arq Bras Endocrinol Metab. 2009;53(6):747-54
Keywords
Obesity; blood glucose; bariatric surgery; diabetes mellitus
RESUMO
Objetivos: Avaliar o quanto os lipídios plasmáticos, o IMC e a glicemia de jejum estão associados com um bom controle glicêmico e identificar a ocorrência de variáveis do risco cardiometabólico. Método: Cento e quarenta brasileiros foram avaliados. Os pacientes foram caracterizados, de acordo com o controle glicêmico, como tendo bom controle, moderado controle e controle ruim e foram divididos em tercis de TG e HbA1c. Utilizou-se a curva ROC para determinar quais variáveis predizem um controle glicêmico inadequado e a análise fatorial para identificar os domínios que segregam as diferentes variáveis. Resultados: A glicemia de jejum e os níveis de insulina, os níveis de TG, VLDL-C e HOMA-IR aumentaram significativamente de acordo com os tercis de HbA1c. O melhor marcador para identificação de indivíduos com um controle glicêmico ruim foi o trigli-cérides. A presença de anormalidades cardiometabólicas não alterou significativamente o controle glicêmico, mas o HOMA-IR foi significativamente maior nestes indivíduos. Conclusão: O uso dos níveis de TG oferece uma boa utilidade clínica. Em pacientes obesos mórbidos, a resistência à insu-lina esta associada com fatores de risco cardiometabólico. AArq Bras Endocrinol Metab. 2009;53(6):747-54
Descritores
Obesidade; glicemia; cirurgia bariátrica; diabetes melito
1 Divisão de Tratamento Clínico e Cirúrgico da Obesidade, Faculdade de Medicina do ABC (FMABC), Santo André, SP, Brasil 2 Sociedade Brasileira de Cirurgia Bariátrica e Metabólica (SBCBM), São Paulo, SP, Brasil
Correspondence to:
Ary Serpa Neto Av. Lauro Gomes, 2000 09060-870 – Santo André, SP, Brasil [email protected]
Received in Mar/19/2009 Accepted in Apr/23/2009
INTRODUCTION
T
he diabetic complications can be prevented orde-layed by tight glycemic control. The American
Dia-betes Association (ADA) recommend HbA1c less than
Copyright
© ABE&M todos os dir
eitos r
eser
vados.
improved glycemic control is still associated with de-creased rates of microvascular complications (2-3). In obese patients, the presence of type 2 diabetes (DM2) is a major risk factor for cardiovascular diseases and the impaired glucose tolerance (IGT) is considered to be an independent risk factor for macrovascular complica-tions (4). Thus, in morbidly obese patients, the glyce-mic control has to be more intensive.
Glycemic control depends mainly on the degree of residual pancreatic beta-cell function and insulin sen-sitivity (5). A number of clinical features are associ-ated with these two factors, such as body mass index (BMI), waist circumference, plasma triglycerides as well as HDL-cholesterol, all factors related to insulin resistance (6). In one investigation, McLaughlin and
cols. found that in subjects with a BMI of 25 kg/m2 or
more, the lipid criteria, specifically triglycerides (TG) levels and TG-HDL-C ratio, were sensitivity markers of insulin resistance (7). They found that the cut offs for the lipid criteria that were most predictive of insulin resistance were TG level of 130 mg/dL or more and/ or TG-HDL-C ratio of 3 or more.
The cardiometabolic risk encompasses a cluster of modifiable classic and emerging risk factors and markers that identify individuals at increased risk for cardiovas-cular disease and type 2 diabetes (8). It includes the fac-tors that make up the National Cholesterol Education Program’s Adult Treatment Panel III (NCEP-ATPIII) definition of metabolic syndrome and encompasses four additional factors: smoking, elevated LDL-C, inflam-matory markers and insulin resistance (8-9). In a clas-sical study, Meigs and cols. identified three factors un-derlying the clustering of certain risk variables. The first cluster includes insulin levels, triglycerides and HDL-C levels, BMI and waist-to-hip ratio, all of which were as-sociated with metabolic syndrome. The second cluster includes glucose and insulin levels which are associated with impaired glucose tolerance. The third cluster in-cludes systolic and diastolic blood pressure and BMI, factors that are associated with hypertension (10).
The primary purpose of the present study was to evaluate whether plasmatic lipids, BMI and fasting glu-cose are associated with a good glycemic control. In the secondary aim of this study, we investigated the oc-currence of cardiometabolic risk variables, the distribu-tion of insulin resistance and its associadistribu-tion with the individual cardiometabolic risk variables and how car-diometabolic risk factors cluster and how much of such clustering may be associated with insulin resistance in morbidly obese subjects.
METHODS
Study population
One hundred and forty Brazilians (29 men and 111 women), with a mean age of 34 ± 8 years and a mean
BMI of 45 ± 4 kg/m2 were evaluated. Patients on
insu-lin treatment, as well as those with liver or kidney disease and diabetes mellitus type 1 were excluded. Blood sam-ples were drawn in the morning after an overnight fast (minimum of eight hours) and the biochemical param-eters were analyzed as the standard. Insulin resistance was calculated using the homeostasis model assessment (11). The subjects were characterized with regard to
glycemic control as good (HbA1c < 7%, n = 42), fair
(HbA1c 7 to 8%, n = 64) and poor (HbA1c > 8%, n =
34). To assess the effect of weight loss in cardiometa-bolic risk, the patients underwent laparoscopic Roux-en-Y gastric bypass (RYGBP), and after eight months all the tests were repeated. All procedures were carried out at Faculdade de Medicina do ABC (FMABC) and affiliated institutions.
The normal cut off values for anthropometric, lipid and blood pressure parameters used in this study was the criteria used by the International Diabetes
Federa-tion: waist circumference ≥ 94 cm in men, ≥ 80 cm
in women or BMI ≥ 30 kg/m²; triglycerides levels
≥ 150 mg/dL (1.7 mmol/L) and/or specific
treat-ment; HDL-C levels < 40 mg/dL (1 mmol/L) in men, < 50 mg/dL (1.3 mmol/L) in women and/or specific
treatment; fasting glucose (FG) ≥ 100 mg/dL (5.6
mmol/L) and/or DM2 patient; systolic blood pressure
≥ 130 mmHg, diastolic blood pressure ≥ 85 mmHg
and/or specific treatment (9). The patients were
divid-ed into tertiles by TG and HbA1c; these tertiles were,
respectively: 512 to 150; 10.9 to 7.7, 148 to 105; 7.6 to 7 and 104 to 43 mg/dL; 6.9 to 5.4%.
Statistical analysis
Data are presented as mean ± SD. Because results did not vary when adjusted for sex, combined results were presented. Linear regression and stepwise multiple re-gression analyses were performed to evaluate the
rela-tionship among HbA1c, plasmatic lipids, BMI and
fast-ing glucose levels. Tertile distributions of the patients were compared by 1-way analysis of variance (ANOVA) with Tukey corrections for multiple comparisons.
Cat-egorical data were analyzed with χ2 test. Areas under
Copyright
© ABE&M todos os dir
eitos r
eser
vados.
were determined for each variable to identify which were predictors of poor glycemic control. Areas under the ROC curve are provided with standard errors. An
ROC curve is a plot of sensitivity (true positive) versus
1-specificity (false positive) for each potential marker. Pearson’s correlation coefficients were computed in order to explore the correlations between two vari-ables. Factor analyses with principal component analy-ses (PCA) were used to identify the domains that seg-regated among the risk variables (12). The risk variables included fasting plasma glucose and insulin, HDL-C,
HOMA-IR, HbA1c, triglycerides, waist-to-hip ratio and
BMI. PCA method with orthogonal rotation identi-fies subsets of clusters of correlated variables. Inter-pretation was based on the correlations called loadings (range -1.0 to 1.0) between the factors and the original independent variables greater than ± 0.30 to interpret the resulting factor pattern (12).
All statistical analyses were made with the statisti-cal software package SPSS (v 15.0; SPSS, Chicago, IL), MedCalc software and ROCKIT 0.9B (Department of Radiology from The University of Chicago). Statistical significance was considered at p < 0.05.
RESULTS
Association between glycemic control and biochemical parameters
The tertiles of TG and HbA1c were determined on the
basis of the studied population of 140 individuals. Of
these, for triglycerides and HbA1c respectively, 45 and
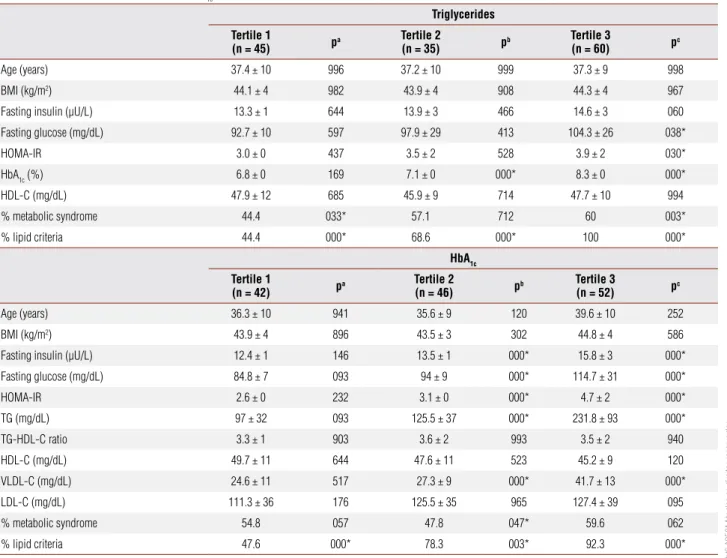
42 were in the first tertile, 35 and 46 were in the sec-ond and 60 and 52 were in the third (Table 1). The HOMA-IR increased across the triglycerides tertiles and in the third tertile (upper limit) it was significantly higher than in the first tertile (inferior limit). For the
Table 1. Characteristics by triglycerides and HbA1c tertiles of the subjects
Triglycerides
Tertile 1
(n = 45) pa
Tertile 2
(n = 35) pb
Tertile 3
(n = 60) pc
Age (years) 37.4 ± 10 996 37.2 ± 10 999 37.3 ± 9 998
BMI (kg/m2) 44.1 ± 4 982 43.9 ± 4 908 44.3 ± 4 967
Fasting insulin (μU/L) 13.3 ± 1 644 13.9 ± 3 466 14.6 ± 3 060
Fasting glucose (mg/dL) 92.7 ± 10 597 97.9 ± 29 413 104.3 ± 26 038*
HOMA-IR 3.0 ± 0 437 3.5 ± 2 528 3.9 ± 2 030*
HbA1c (%) 6.8 ± 0 169 7.1 ± 0 000* 8.3 ± 0 000*
HDL-C (mg/dL) 47.9 ± 12 685 45.9 ± 9 714 47.7 ± 10 994
% metabolic syndrome 44.4 033* 57.1 712 60 003*
% lipid criteria 44.4 000* 68.6 000* 100 000*
HbA1c
Tertile 1
(n = 42) pa
Tertile 2
(n = 46) pb
Tertile 3
(n = 52) pc
Age (years) 36.3 ± 10 941 35.6 ± 9 120 39.6 ± 10 252
BMI (kg/m2) 43.9 ± 4 896 43.5 ± 3 302 44.8 ± 4 586
Fasting insulin (μU/L) 12.4 ± 1 146 13.5 ± 1 000* 15.8 ± 3 000*
Fasting glucose (mg/dL) 84.8 ± 7 093 94 ± 9 000* 114.7 ± 31 000*
HOMA-IR 2.6 ± 0 232 3.1 ± 0 000* 4.7 ± 2 000*
TG (mg/dL) 97 ± 32 093 125.5 ± 37 000* 231.8 ± 93 000*
TG-HDL-C ratio 3.3 ± 1 903 3.6 ± 2 993 3.5 ± 2 940
HDL-C (mg/dL) 49.7 ± 11 644 47.6 ± 11 523 45.2 ± 9 120
VLDL-C (mg/dL) 24.6 ± 11 517 27.3 ± 9 000* 41.7 ± 13 000*
LDL-C (mg/dL) 111.3 ± 36 176 125.5 ± 35 965 127.4 ± 39 095
% metabolic syndrome 54.8 057 47.8 047* 59.6 062
% lipid criteria 47.6 000* 78.3 003* 92.3 000*
* p < 0.05.
Copyright
© ABE&M todos os dir
eitos r
eser
vados.
HbA1c group, fasting glucose and insulin levels, TG
level, VLDL-C and HOMA-IR increased significantly across tertiles.
The sensitivity, specificity and positive likelihood ra-tio (+LR) value of the metabolic syndrome to diagnose poor glycemic control in Brazilians were 45%, 54.7% and 1.02% respectively. For the lipid criteria, the sensitivity, specificity and + LR to identify individuals with poor gly-cemic control were, respectively, 85%, 52% and 1.8%.
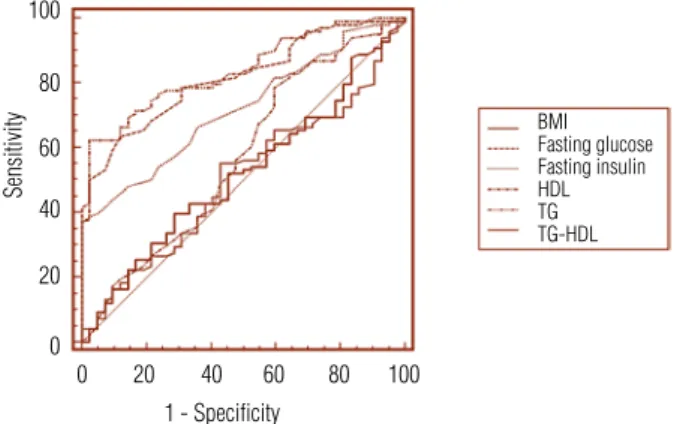
The Figure 1 shows the ROC curve for all poten-tial metabolic markers evaluated. The best markers for identification of individuals with poor glycemic control were, in rank-ordered, triglycerides, fasting glucose and fasting insulin, and the AUC of these markers were sig-nificantly greater than those of the other three markers (Table 2). The sensitivity and the specificity for these markers were, respectively, 62, 63 and 36% and 97, 88 and 100%.
To test these results, the relative ability of the cut off values found for the triglycerides, fasting glucose and insulin were compared in order to identify individuals with good or poor glycemic control. It can be seen, in Table 3, that a high TG level (> 146 mg/dL) identi-fied 62.2% of the individuals with poor glycemic control
(PGC), and a low TG (≤ 146 mg/dL) identified 95.2%
of the individuals with good glycemic control (GGC)
(χ2 = 39.2,p < 0.0001). Similarly, a high fasting glucose
level correctly identified 65.3% of the patients with PGC, and a low FG identified 81% of the patients with GGC
(χ2 = 25.1,p < 0.0001). Quite the opposite, high
lev-els of fasting insulin identified only 38.8% of individuals with PGC, but the low levels correctly identified 97.6%
of individuals with GGC (χ2 = 19.3, p < 0.0001).
HbA1c was significantly correlated with fasting
glu-cose and insulin levels, triglycerides level, HOMA-IR and HDL-C level (Pearson’s correlation coefficients = 0.709, 0.652, 0.707, 0.694 and -0.398, respectively). To assess the relative contribution of these parameters
in the prediction of HbA1c, we performed multiple
stepwise linear regression analyses with HbA1c as
de-pendent variable and FG, FI, TG, HOMA-IR, HDL-C and BMI as the independent variables. The results of these analyses indicated that, in the regression model,
both FG and TG significantly predicted HbA1c (FG, β
= 0.29, p < 0.0001; TG, β = 0.21, p < 0.0001). The
others parameters did not significantly contribute to the model.
Assessment of cardiometabolic risks
We found that, before RYGBP, 14.2% of the subjects could be include in all of the three physiologic domains of the insulin resistance syndrome and, after the sur-gery, this prevalence down to 7.1% (p < 0.05). Thus, before the surgery, only 10.7% of the patients had none factor and, after the procedure, this number increased to 27.1% (p < 0.05) (Table 4).
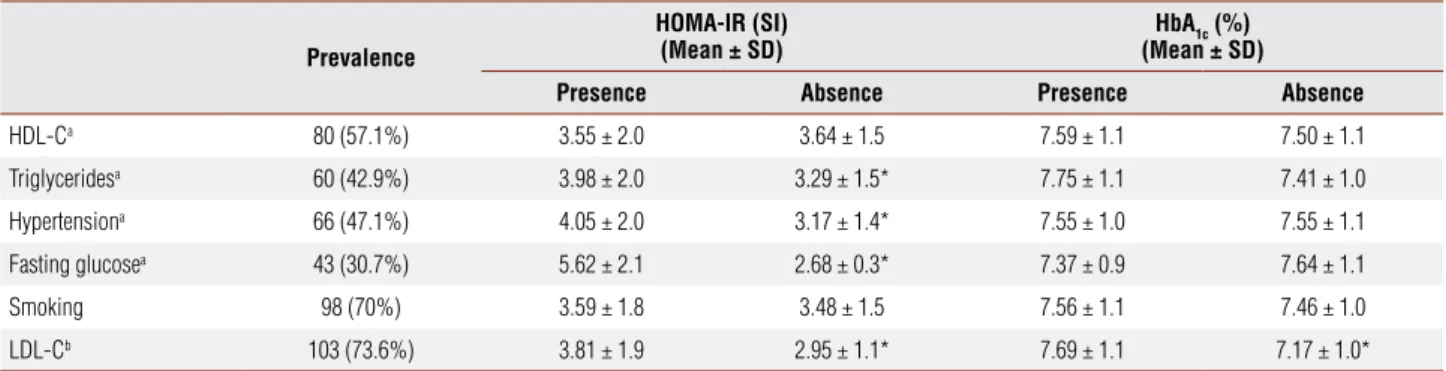
The prevalence of cardiometabolic risk factors is shown in Table 5. Median values of HOMA-IR were significantly higher in subjects with abnormal values for
Table 2. Comparison of areas under ROC curves (AUC) for parameters that are potentials markers of poor glycemic control
Variable AUC (Mean ± SE) 95% Confidence interval
BMI 0.518 ± 0.05 0.432 – 0.603
Fasting glucose 0.815 ± 0.03 0.741 – 0.876
Fasting insulin 0.719 ± 0.04 0.637 – 0.792
HDL-C 0.571 ± 0.05 0.485 – 0.654
Triglycerides 0.837 ± 0.03 0.765 – 0.894
TG-HDL-C Ratio 0.505 ± 0.05 0.419 – 0.590
Figure 1. Receiver-operating characteristic curves for metabolic markers of poor glycemic control.
Table 3. Ability of triglycerides, fasting glucose and fasting insulin to identify individuals with poor or good glycemic control
TG 146 TG > 146 FG < 92 FG > 92 FI < 15.3 FI > 15.3
PGC (n = 98) 37 (37.8%) 61 (62.2%) 34 (34.7%) 64 (65.3%) 60 (61.2%) 38 (38.8%)
GGC (n = 42) 40 (95.2%) 2 (4.8%) 34 (81%) 8 (19%) 41 (97.6%) 1 (2.4%)
TG: triglycerides (mg/dL); FG: fasting glucose (mg/dL); FI: fasting insulin (μU/L); PGC: poor glycemic control (HbA1c > 7%); GGC: good glycemic control (HbA1c ≤ 7%).
100
80
60
40
20
0
0 20 40 60 80 100
Sensitivity
1 - Speciicity
Copyright
© ABE&M todos os dir
eitos r
eser
vados.
each parameter, except in the HDL and in the smokers group. The presence of cardiometabolic abnormalities did not altered significantly the glycemic control, only in the LDL group. In the triglycerides and in the fast-ing glucose group, the relationship approach’s signifi-cance (p = 0.073 and p = 0.191, respectively).
Principal axis factor analysis with varimax rotation was conducted to assess the underlying structure for six parameters. We identified two dominant factors
that explained 56.1% of the total variance of data. After rotation, the first and the second factors accounted for 32.97 and 23.13% of the variance, respectively (Table 6). In the first factor, called glucose factor, fasting glucose and insulin levels had positive loadings. In the second factor, called lipid factor, LDL-C and triglycerides had positive loading and HDL had negative loading. Lipid profile was linked to the glucose factor by shared cor-relations with fasting glucose.
Table 4. Prevalence of physiological domains of the insulin resistance syndrome, before and after RYGBP, based on the study by Meigs and cols. (10)
Before After p
None 15 (10.7%) 38 (27.1%) < 0.05
Factor one onlya 53 (37.8%) 56 (40%) > 0.05
Factor two only 0 (0%) 1 (0.7%) > 0.05
Factor three only 16 (11.4%) 11 (7.8%) > 0.05
Factor one and three 30 (21.4%) 16 (11.4%) < 0.01
Factor one and two 6 (4.2%) 8 (5.7%) > 0.05
Factor one, two and three 20 (14.2%) 10 (7.1) < 0.05
No (0%) individuals were classiied as indeterminate (factor two and three).
a To estimate prevalence, the factor one was deined as the presence of at least two of the three characteristics: hiperinsulinemia (a fasting insulin level exceeding the 90th percentile of its distribution among subjects
with normal glucose tolerance), dyslipidemia (either a low HDL-C or an elevated triglyceride level) or obesity (either central or BMI ≥ 30 kg/m2).
Table 5. Prevalence of cardiometabolic abnormalities and values of HOMA-IR and HbA1c in relation to presence of abnormalities
Prevalence
HOMA-IR (SI) (Mean ± SD)
HbA1c (%) (Mean ± SD)
Presence Absence Presence Absence
HDL-Ca 80 (57.1%) 3.55 ± 2.0 3.64 ± 1.5 7.59 ± 1.1 7.50 ± 1.1
Triglyceridesa 60 (42.9%) 3.98 ± 2.0 3.29 ± 1.5* 7.75 ± 1.1 7.41 ± 1.0
Hypertensiona 66 (47.1%) 4.05 ± 2.0 3.17 ± 1.4* 7.55 ± 1.0 7.55 ± 1.1
Fasting glucosea 43 (30.7%) 5.62 ± 2.1 2.68 ± 0.3* 7.37 ± 0.9 7.64 ± 1.1
Smoking 98 (70%) 3.59 ± 1.8 3.48 ± 1.5 7.56 ± 1.1 7.46 ± 1.0
LDL-Cb 103 (73.6%) 3.81 ± 1.9 2.95 ± 1.1* 7.69 ± 1.1 7.17 ± 1.0*
a Abnormal cut offs according to IDF criteria (see “Methods” section). b Abnormal cut off: LDL-C > 100 mg/dL.
* p < 0.05 for the difference between presence or absence.
Table 6. Factor loading patterns after orthogonal rotation of principal components showing the clusters of cardiometabolic risk variables
Factor loading
Communality
1 2
Fasting glucose 0.887 0.304 0.76
Fasting insulin 0.907 0.76
HDL-C -0.513 0.57
LDL-C 0.543 0.58
Triglycerides 0.600 0.57
Eigen values 3.928 2.314
% of variance 32.97 23.13
Copyright
© ABE&M todos os dir
eitos r
eser
vados.
DISCUSSION
Association between glycemic control and biochemical parameters
In the next century more than 100,000,000 individuals will be obese and, of these, more than 15,000,000 will become diabetic. The mechanism through which obe-sity causes diabetes remains obscure, but it is known that obesity is associated with insulin resistance, and that effective compensatory hiperinsulinemia initially maintains blood glucose levels within normal range (13). However, after some time, the ability of
pancreat-ic β cells to compensate for increasing insulin resistance
may flag, the so-called β-cell failure.
Obesity, as well as diabetes, is associated with dys-lipidemia, characterized by an increase in circulating free fatty acids (FFA), accumulation of triglycerides in peripheral tissues and changes in lipoprotein profile (13-16). High plasma levels of FFA are related with
excessive accumulation of fat in pancreatic β-cell, and
it leads to cellular dysfunction, called lipotoxicity (17-19). The lipotoxicity is the result of a constellation of
islet derangements, like the decreased β-cell GLUT-2
expression (20), enhanced nitric oxide formation (21),
impaired β-cell function (20) and apoptosis of a
sub-stantial subgroup ofβ cells (18).
In our results, a high level of triglycerides (upper tertile) was associated with insulin resistance (Table 1), a known fact, and with a poor glycemic control (Figure 1 and Tables 1, 2 and 3). Like said before, the glycemic control depends mainly on the degree of residual pan-creatic beta-cell function and insulin sensitivity (5), and the TG is associated with both. The pancreatic islets
ex-hibit an increased incorporation of [3H]palmitate into
triglycerides, and this is believed to be a major factor in the overaccumulation of fat, given the high levels of circulating fatty acids and triglycerides that character-izes obesity (22-23). A normal pancreatic islet contains approximately 24 ng of triglycerides and this number can increase to 990 ng in the islets of obese, leptin-resistance Zucker diabetic fatty rats (24), the animal
model used to study the mechanisms of β-cell failure
in obesity.
In our study, a poor glycemic control was associated with high levels of VLDL-C and LDL-C and with a low level of HDL-C too (Table 1). It was demonstrated that purified human very density lipoprotein and low-density lipoprotein particles reduced insulin mRNA
levels and β-cell proliferation and were proapoptotic,
whereas high-density lipoprotein protected β-cells
against these proapoptotic effects. These protective ef-fects were mediated, at least partially, by inhibition of caspase-3 cleavage and activation of Akt/protein kinase B, whereas proapoptotic lipoproteins seem to act via c-Jun N-terminal kinase (25). These results are highly suggestive that the changes in lipoprotein profile ob-served in obesity could contribute to the pathogenesis
and progression of β-cell failure (14).
Other proposed pathway of lipotoxicity is the en-hanced expression of sterol regulatory element-binding protein-1c (SREBP-1c) and lipogenic genes such as fat-ty acid synthase (FAS) and acefat-tyl-coenzyme A carboxy-lase (ACC) in pancreatic islets of ZDF rats (26). The
SREBP-1c, through a direct interaction with cis-acting
element, regulate the expression of the uncoupling protein-2 (UCP-2), which has the SRE sequence on its promoter region. It has been shown that the expres-sion of UCP-2, which has been involved in dissipation of the mitochondrial proton gradient, was enhanced in the pancreatic islets of lipotoxicity models (15).
In obesity, the flux of FFA from adipocytes into is-lets is greatly enhanced in proportion to the obesity. Because leptin levels, which are known for their ability to lower the TG content of isolated islets by reducing esterification and by increasing oxidation of FFA, also rise proportionately to the obesity, it is suggested that they prevent excessive accumulation of triglycerides and lipotoxicity. However, if the islet leptin receptors are defective or the sensitivity of islets to leptin is dimin-ished by postereceptor defects, like in morbid obesity, islet fat content may rise to a lipotoxic level, in which case adipogenic diabetes will ensue (19).
The obesity is also associated with a pro-inflamma-tory status that provides a potential link between insulin resistance and endothelial and beta cell dysfunction. The visceral and subcutaneous adipose tissues are the major source of cytokines/adipokines, which are low molecu-lar weight proteins that participate in inflammation and immune response. Thus, increased adipose tissue mass is associated with alteration in adipokine production as
over expression of tumor necrosis factor α,
plasmino-gen activator inhibitor 1 and interleukin 6 (14).
Copyright
© ABE&M todos os dir
eitos r
eser
vados.
markers most closely related to poor glycemic control. In addition, this marker is said to increase CVD (27) risk as well as to be associated with insulin resistance (28). Thus, if the goal is to identify those insulin-re-sistant with poor glycemic control individuals who are at risk for CVD, this marker may offer some advantage over the others.
Assessment of cardiometabolic risks
In this population-based study, we found that, before RYGBP, 78.5% of morbidly obese patients had at least one cardiometabolic risk factor, and that these factors clustered into two groups. The atherogenic dyslipi-demia (high TG and low HDL-C) is the commonest cardiometabolic abnormalities. In this population, the BMI is higher than the normal weight population and relatively constant, hence, the obesity did not consti-tute an important factor in our patients. The central characteristics of a unified metabolic syndrome in-cluded hyperglycemia (reflecting insulin resistance) and dyslipidemia. The glucose intolerance was linked to the dyslipidemia through mutual associations with fasting glucose levels.
Like showed in table 5, HOMA-IR values were sig-nificantly higher in subjects with cardiometabolic ab-normalities. It corroborates the idea that insulin resis-tance, although it is not the only, is considered to be an important contributor to cardiometabolic risk. Recent studies show that obesity, central obesity, high insulin response and insulin resistance, all independently and partially, contribute to cardiometabolic risk (29). The
glycemic control, assessed by HbA1c, has no correlation
with the presence of cardiometabolic risk in this popu-lation but, certainly, its control constitutes the basis of treatment of these patients, aiming at the prevention of diabetes and cardiovascular diseases (30).
Intercorrelation of variables introduces collinearity into predictive statistical models, producing unreliable estimates and making it difficult to ascertain which vari-ables represent the dominant physiological processes
(31).Factor analysis has long been used in psychometric
research to deal with this problem and has been an in-creasing use to analyze physiological relationships (10). In our results, factor analysis does not imply that insulin resistance causes dyslipidemia; rather, it demonstrates that these two phenotypes are very closely associated and defines a unique physiological domain.
In summary, factor analyses identify two indepen-dent factors underlying clustering of the basic cardio-metabolic risk variables. A hyperglycemia and dyslipi-demia define two distinct physiological domains linked together through mutual associations with fasting glu-cose levels. In our patients, insulin resistance plays an important role in the prevalence of cardiometabolic risk variables and the higher prevalence of atherogenic dys-lipidemia makes necessary the adoption of measures for prevention of cardiovascular diseases.
Some limitations are present in our study: the first is that HOMA-IR is not the gold standard in the evalua-tion of insulin resistance. Nevertheless, this index cor-relates moderately well with insulin resistance as mea-sured by hyperinsulinemic euglycemic clamp, which is considered to be the gold standard in the evaluation of insulin resistance (32). Thus, several large population studies have shown that the application of HOMA-IR is a good method for assessing insulin resistance across a range of glucose tolerance from normal to diabetes (33). A second limitation is that the study sample con-sisted primarily of white Brazilians, and the ability of the same metabolic markers or cut-points to predict poor glycemic control in overweight individuals of oth-er ethnicities is yet to be proven.
Disclosure: no potential conflict of interest relevant to this article was reported.
REFERENCES
American Diabetes Association. Standards of medical care in dia-1.
betes. Position Statement Diabetes Care. 2007;30:S4-S41. UK Prospective Diabetes Study (UKPDS) Group. Intensive blood-2.
glucose control with sulphonylureas or insulin compared with conventional treatment and risk of complications in patients with type 2 diabetes (UKPDS 33). Lancet. 1998;352(9131):837-53. [No authors listed]. The absence of a glycemic threshold for the de-3.
velopment of long-term complications: the perspective of the diabe-tes control and complications trial. Diabediabe-tes. 1996;45(10):1289-98. Hubert HB, Feinleib M, McNamara PM, Castelli WP. Obesity as 4.
an independent risk factor for cardiovascular disease: a 26-year follow-up of participants in the Framingham Heart Study. Circula-tion. 1983;67(5):968-77.
Dansuntornwong B, Chanprasertyothin S, Jongjaroenprasert W, 5.
Ngarmukos C, Bunnag P, Puavilai G, et al. The relation between parameters from homeostasis model assessment and glycemic control in type 2 diabetes. J Med Assoc Thai. 2007;90(11):2284-90. Bonora E, Targher G, Alberiche M, Formentini G, Calcaterra F, 6.
Lombardi S, et al. Predictors of insulin sensitivity in type 2 diabe-tes mellitus. Diabet Med. 2002;19:535-42.
McLaughlin T, Abbasi F, Cheal K, Chu J, Lamendola C, Reaven G. 7.
Copyright
© ABE&M todos os dir
eitos r
eser
vados.
Executive summary of the third report of the National Cholesterol 8.
Education Program (NCEP) Expert Panel on Detection, evaluation and treatment of high blood cholesterol in adults (Adult Treat-ment Panel III). JAMA. 2001;285:2486-97.
Guerrero-Romero F, Rodríguez-Morán M. Concordance between 9.
the 2005 International Diabetes Federation definition for diagnos-ing metabolic syndrome with the National Cholesterol Education Program Adult Treatment Panel III and the World Health Organiza-tion definiOrganiza-tions. Diabetes Care. 2005;28(10):2588-9.
Meigs JB, D’Agostino RB, Wilson PW, Cupples LA, Nathan 10.
DM, Singer DE. Risk variable clustering in the insulin resis-tance syndrome: the framingham offspring study. Diabetes. 1997;46(10):1594-600.
Levy JC, Matthews DR, Hermans MP. Correct homeostasis model 11.
assessment (HOMA) evaluation uses the computer program. Dia-betes Care. 1998;21(12):2191-2.
Cureton EE, D’Agostino RB. Factor analyses: an applied approach. 12.
Lawrence Eribaum Associates Hillsdale NJ; 1983.
Reaven GM. The fourth musketeer: from Alexandre Dumas to 13.
Claude Bernard. Diabetologia. 1995;38:3-13. Wajchenberg BL.
14. β-Cell failure in diabetes and preservation by
clinical treatment. Endocr Rev. 2007;28(2):187-218.
Yamashita T, Eto K, Okazaki Y, Yamashita S, Yamauchi T, Sekine N 15.
et al. Role of uncoupling protein-2 up-regulation and triglyceride accumulation in impaired glucose-stimulated insulin secretion in
a β-cell lipotoxicity model overexpressing sterol regulatory
ele-ment-binding protein-1c. Endocrinology. 2004;145(8):3566-77. Fraze E, Donner CC, Swislocki AL, Chiou YA, Chen YD, Reaven GM. 16.
Ambient plasma free fatty acid concentrations in noninsulin-de-pendent diabetes mellitus: evidence for insulin resistance. J Clin Endocrinol Metab. 1985;61(5):807-11.
Unger RH. Lipotoxicity in the pathogenesis of obesity-dependent NID-17.
DM. Genetic and clinical implications. Diabetes. 1995;44(8):863-70. Shimabukuro M, Zhou YT, Levi M, Unger RH. Fatty acid-induced 18.
β-cell apoptosis: A link between obesity and diabetes. Proc Natl
Acad Sci USA. 1998;95(5):2498-502.
Zhou YT, Shimabukuro M, Wang MY, Lee Y, Higa M, Milburn JL, et al. 19.
Role of peroxisome proliferator-activated receptor α in disease of
pancreatic β cells. Proc Natl Acad Sci USA. 1998;95(15):8898-903.
Johnson JH, Ogawa A, Chen L, et al. Underexpression of beta cell 20.
high Km glucose transporters in noninsulin-dependent diabetes. Science. 1990;250:546-9.
Shimabukuro M, Ohneda M, Lee Y, Unger RH. Role of ni-21.
tric oxide in obesity-induced beta cell disease. J Clin Invest. 1997;100(2):290-5.
Zhou YT, Shimabukuro M, Lee Y, Koyama K, Higa M, Ferguson T, et 22.
al. Enhanced de novo lipogenesis in the leptin-unresponsive pan-creatic islets of prediabetic zucker diabetic fatty rats: Role in the pathogenesis of lipotoxic diabetes. Diabetes. 1998;47(12):1904-8. Lee Y, Hirose H, Zhou YT, Esser V, McGarry JD, Unger RH. In-23.
creased lipogenic capacity of islets of obese rats: a role in the pathogenesis of NIDDM. Diabetes. 1997;46(3):408-13.
Zhou YT, Shimabukuro M, Koyama K, Lee Y, Wang MY, Trieu F, et al. 24.
Induction by leptin of uncoupling protein-2 and enzymes of fatty acid oxidation. Proc Natl Acad Sci USA. 1997;94(12):6386-90. Roehrich ME, Mooser V, Lenain V, Herz J, Nimpf J, Azhar S, et al. 25.
Insulin-secreting β-cell dysfunction induced by human
lipopro-teins. J Biol Chem. 2003;278(25):18368-75.
Kakuma T, Lee Y, Higa M, Wang Z, Pan W, Shimomura I, et al. Lep-26.
tin, troglitazone and the expression of sterol regulatory element binding proteins in liver and pancreatic islets. Proc Natl Acad Sci USA. 2000;97(15):8536-41.
Hokanson JE, Austin MA. Plasma triglyceride level is a risk factor 27.
for cardiovascular disease independent of high-density lipotein cholesterol level: a meta-analysis of population-based pro-spective studies. J Cardiovasc Risk. 1996;3(2):213-9.
Laws A, Reaven GM. Evidence for an independent relation-28.
ship between insulin resistance and fasting plasma HDL-cho-lesterol, triglyceride and insulin concentrations. J Intern Med. 1992;231(1):25-30.
Goldfarb B. Insulin resistance: one of many players in cardiomet-29.
abolic risk. DOC News 2007;4:7.
Hoerger TJ, Ahmann AJ. The impact of diabetes and associated 30.
cardiometabolic risk factors on members: Strategies for optimiz-ing outcomes. J Manag Care Pharm. 2008;14(Suppl 1):S2-14. Gordon T. Hazards in the use of the logistic function with spe-31.
cial reference to data from prospective cardiovascular studies. J Chron Dis. 1974;27(3):97-102.
DeFronzo RA, Tobin JD, Andres R. Glucose clamp technique: a 32.
method for quantifying insulin secretion and resistance. Am J Physiol. 1979;237(3):E214-223.
Haffner SM, Kennedy E, Gonzalez C, Stern MP, Miettinen H. A pro-33.