Article
Printed in Brazil - ©2017 Sociedade Brasileira de Química0103 - 5053 $6.00+0.00
*e-mail: [email protected]
Improvement of Solubility and Antifungal Activity of a New Aminothiophene
Derivative by Complexation with 2-Hydroxypropyl-
β
-cyclodextrin
Giovanna R. A. Eleamen,a Silvana C. da Costa,a Reginaldo G. Lima-Neto,b Rejane
P. Neves,b Larissa A. Rolim,b Pedro J. Rolim-Neto,b Ricardo O. Moura,a Thiago M.
de Aquino,c Edson S. Bento,c Marcus T. Scotti,d Francisco J. B. Mendonça-Junior,a
Elisangela A. M. Mendonçaa and Elquio E. Oliveira*,a
aLaboratório de Síntese e Vetorização Molecular (LSVM), Universidade Estadual da Paraíba,
58071-160 João Pessoa-PB, Brazil
bDepartamento de Ciências Farmacêuticas, Universidade Federal de Pernambuco,
50670-901 Recife-PE, Brazil
cLaboratório de Ressonância Magnética Nuclear, Instituto de Química e Biotecnologia,
Universidade Federal de Alagoas, 57072-900 Maceió-AL, Brazil
dDepartamento de Engenharia e Meio Ambiente, Universidade Federal da Paraíba, Campus IV,
58297-000 Rio Tinto-PB, Brazil
This study aimed to prepare a complex of 2-hydroxypropyl-β-cyclodextrin (HP-β-CD) and 6CN10, a poorly water soluble 2-aminothiophene derivative with antifungal properties, by freeze-drying technique. The complex was characterized by thermal analysis, infrared/Raman spectroscopy, X-ray diffraction and scanning electron microscopy. In addition, we used the data of the phase solubility study, 1H, and 2D NMR spectroscopy and molecular modeling in
order to investigate the interactions between 6CN10 and HP-β-CD. The apparent solubility of 6CN10 with HP-β-CD increased more than 29 fold. The phase solubility assay in water at 25 ºC showed an AP-type curve, with an apparent stability constant K1:1 and K1:2 of 96 and 0.1989 M-1,
respectively. The results of IR, NMR and docking indicate that 6CN10 is able to form complexes with HP-β-CD (1:1 and 1:2 stoichiometric ratios), generating the formation of inclusion and preferably, non-inclusion complexes. The antifungal activity against Cryptococcus neoformans
demonstrated the superior performance of the complex (46.66 µg mL-1) when compared with the
free drug (166.66-333.33 µg mL-1). The present study provides useful information for the potential
application of complexation with low soluble compounds and about the type of complex formation between 6CN10 and HP-β-CD.
Keywords: antifungal activity, inclusion complex, molecular modeling, NMR, solubility
improvement
Introduction
2-Aminothiophene derivatives are an important class of heterocycles found in several biologically active
compounds.1 This class of heterocycles has attracted great
interest from researchers due to their great versatility as
precursors of molecules with pharmacological properties.2
6CN10 is a 2-aminothiophene derivative synthesized via two-step reaction, starting with the obtainment of
2-amino-4,5,6,7-tetrahydro-4H-benzo[b
]thiophene-3-carbonitrile through the Gewald reaction, followed by condensation with 4-nitro-benzaldehyde to produce the
2-[(4-nitrobenzylidene)amino]-4,5,6,7-tetrahydro-4H
-benzo[b]thiophene-3-carbonitrile, called 6CN10 (Table 1).3
This lipophilic drug showed good antifungal activity, with
fungicidal profile, especially against Cryptococcus and can
be considered a good prototype for the development of a
new antimycotic drug.3 However, the therapeutic potential
of 6CN10 is limited due its very poor water solubility.4
Cyclodextrins (CD) have been extensively used as complexing agents to improve the solubility and stability
CD structure provides a hydrophilic outer surface and hydrophobic interior hollow. The inner part of CD molecules is apolar due to the presence of glycosidic oxygens and methanetriyl protons, while its external surface is polar due to the presence of hydroxyl groups, which allow complexation with hydrophobic compounds
improving its solubility.8,9 Nowadays, more than 35
different drugs are marketed as solid or solution-based CD complex formulations, including alprostadil, meloxicam, nicotine, omeprazole, itraconazole, aripiprazole, and insulin.10,11
Natural CDs have limited water solubility, which in turn negatively influences water solubility of the formed
complex.5,12 To overcome this problem several modified
CDs were introduced. 2-Hydroxypropyl-β-cyclodextrin
(HP-β-CD), a hydroxyalkyl derivative, is an alternative
to natural CDs, with improved water solubility properties. Furthermore, there are toxicological studies pointing out
that HP-β-CD is well tolerated in animal models and
humans by either oral or intravenous administration.7,9,13
The present work was carried out with the aim to evaluate
the formation of 6CN10:HP-β-CD complex to improve the
aqueous solubility and consequently the antifungal activity of 6CN10. The prepared complexes were characterized
by 1H and 2D nuclear magnetic resonance (NMR)
spectroscopy, Fourier transform infrared spectroscopy (FTIR), Raman spectroscopy, thermogravimetric analysis (TGA), X-ray diffractometry (XRD) and scanning electron microscopy (SEM). In addition, molecular modeling and docking studies of the complexes were performed to predict the models of interactions between 6CN10 and
HP-β-CD in the complexes. Finally, the antifungal activity
of 6CN10:HP-β-CD complex was also evaluated.
Experimental
Materials
The 6CN10 was synthesized in our laboratory according
to previously described methods.3 The
2-hydroxypropil-β-cyclodextrin (HP-β-CD) was purchased from
Sigma-Aldrich (Brazil). Other reagents, solvents and chemicals were of analytical reagent grade and were used without further purification.
Phase solubility studies of 6CN10 in 2-hydroxypropil-β -cyclodextrin
Phase solubility studies were carried out according
to the method described by Higuchi and Connors.14 An
excess amount of 6CN10 (3 mg) was added to a series of water solutions containing different amounts of
HP-β-CD, ranging from zero to its solubility limit. The
suspensions were shaken at 25 ± 1 °C until solubility equilibrium was reached (72 h). Then the samples were filtered through hydrophilic membrane filters (0.22 µm). The concentration of 6CN10 in the filtrate was determined at 280 nm by UV-Vis spectrophotometer (Genesys 10S, Thermo Scientific, USA). Solubility data were fitted using linear regression. Assuming the formation of a complex with 1:1 stoichiometric ratio, the apparent stability
constant (K1:1) of 6CN10 was calculated from the linear
relationship between the molar concentration of 6CN10 in
the solution medium as a function of the HP-β-CD molar
concentration according to equation 1,14 where the S
0 is
the solubility of the 6CN10 in the absence of HP-β-CD.
The stability constant (K1:2) of 6CN10 was calculated
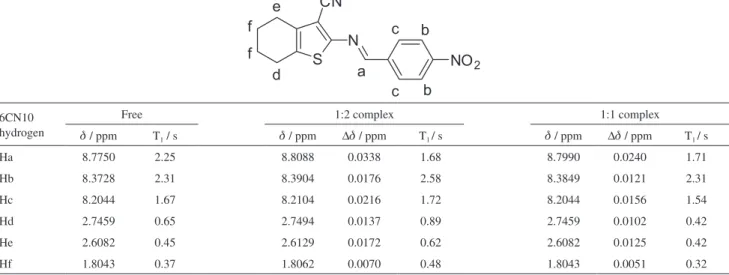
Table 1. Hydrogen chemical shift data (ppm) and longitudinal relaxation times T1 (s) of 6CN10 in the free state and in the complexes 1:1 and 1:2 molar ratios
6CN10 hydrogen
Free 1:2 complex 1:1 complex
d / ppm T1 / s d / ppm ∆d / ppm T1 / s d / ppm ∆d / ppm T1 / s
Ha 8.7750 2.25 8.8088 0.0338 1.68 8.7990 0.0240 1.71
Hb 8.3728 2.31 8.3904 0.0176 2.58 8.3849 0.0121 2.31
Hc 8.2044 1.67 8.2104 0.0216 1.72 8.2044 0.0156 1.54
Hd 2.7459 0.65 2.7494 0.0137 0.89 2.7459 0.0102 0.42
He 2.6082 0.45 2.6129 0.0172 0.62 2.6082 0.0125 0.42
from the equation 2 where [S0] is the solubility of the
6CN10 in the absence of HP-β-CD, and [St] and [Lt] are
the concentrations of 6CN10 and HP-β-CD in solution,
respectively:
K1:1 = slope / S0 × (1 – slope) (1)
K1:2 = ([St] − [ S0]) / [Lt] = K1:1[S0] + K1:1K1:2[S0][Lt] (2)
The complexation efficiency (CE) of 6CN10 was determined from data of the phase solubility curve
according to equation 3.15
CE = slope / (1 – slope) (3)
The 6CN10:HP-β-CD ratio was calculated according
to the equation 4.16
6CN10:HP-β-CD = 1 / (1 + 1/CE) (4)
Preparation of 6CN10:HP-β-CD inclusion complex
6CN10:HP-β-CD inclusion complexes were
prepared using freeze-drying technique according to
Mendonça et al.17 6CN10 and HP-β-CD were weighed
accurately in 1:1 and 1:2 molar ratios and dissolved in distilled water under agitation for 72 h at 25 ± 1 °C. The solution was frozen in liquid nitrogen and then lyophilized for 24 h.
The total recovery was calculated according to the following equation:
Total recovery (%) = Recovered powder / Initial (6CN10
+ HP-β-CD) × 100 (5)
Preparation of physical mixture
Stoichiometric amounts of 6CN10 and the HP-β-CD
were weighed and mixed until a simply solid physical mixture was obtained.
Nuclear magnetic resonance (NMR)
1H spectra and H-H spatial dipolar correlation
2D NMR analysis were recorded for 6CN10, HP-β-CD
and complexes in 1:1 and 1:2 molar ratios dissolved in
DMSO-d6 (0.02 mol L-1) using a Bruker AVANCE 400
spectrometer. The spectra were acquired at 25 ± 1 °C in 5 mm tubes. Two-dimensional rotating-frame Overhauser effect spectroscopy (ROESY) experiments were recorded using the standard pulse sequence found in the Bruker pulse
program library, applying a set of mixing times of 500, 300 or 150 ms under spin lock condition. During the acquisition, 256 increments were collected with 32 repetitions and the measured data matrix were processed as a matrix of 2k (F2) by 1k (F1) data points. The proton spin-lattice relaxation
time T1 was measured using the saturation method in a
spectrometer working at 400 MHz. 1H chemical shifts were
referenced to DMSO (2.50 ppm).
Molecular modeling and docking
The structures of HP-β-CD and 6CN10 were submitted
to molecular docking using the Molegro Virtual Docker
v. 6.0.1 (MVD).18 Both compounds were prepared using
default parameter settings in the same software. Moldock
score [GRID] algorithm was used as the score function.18
The docking procedure was performed using a GRID of 13 Å of radius and 0.20 Å of resolution covering the
whole structure of HP-β-CD at the site of each structure.
For the evaluation of the ligand, the following poses were used: internal electrostatic interactions, internal hydrogen bonds and additional dihedral terms between
atoms sp2. The search algorithm selected was MolDock
SE using 50 runs, 1500 interactions, population size of 50, 300 steps and the neighbor distance factor of 1. For pose generation, an energy threshold value of 100 with minimum and maximum tries of 10 and 30, respectively, were selected. For each run 10 poses were returned. After docking, two post-docking steps were
performed: (i) energy minimization in order to prevent
any inaccuracies due to energy grid approximations;
(ii) optimization of hydrogen bonds of both compound and
cyclodextrin.18
Thermal analysis
The thermogravimetric analysis was performed with a Shimadzu, model TGA Q60. Approximately 3 mg of
the samples (6CN10, HP-β-CD, physical mixture and
6CN10:HP-β-CD inclusion complex) were placed in
alumina pan and heated from 25 to 600 ºC at a rate of
10 ºC min-1 under a nitrogen flow of 50 mL min-1.
X-Ray diffractometry (XRD)
The X-ray powder diffraction patterns were obtained at room temperature with a diffractometer (model D8 Advance, Bruker) using Ni-filtered Cu-K radiation, a voltage of 30 kV and a current of 30 mA. The scanning
rate was employed for 2 degrees min-1 over a diffraction
Fourier transform infrared (FTIR) and Raman spectroscopy
The FTIR and Raman spectroscopy was carried with a spectrophotometer (Vertex 70 RAM II, Bruker). The FTIR spectra of the samples were obtained in the range between
4000 and 400 cm-1 using the KBr technique. FT-Raman
spectra were recorded in the range between 3500 and
70 cm-1 at a spectral resolution of 4 cm-1.
Scanning electron microscopy (SEM)
The surface morphology of the samples was evaluated by a scanning electron microscope (XL 30 ESEM, Philips) set at 20 kV. Prior to the examination, the samples were sputter coated with gold-palladium under argon atmosphere.
Antifungal activity evaluation
Four isolated Cryptococcus neoformans obtained from
cerebrospinal fluid (CSF) of immunocompromised patients from the Tertiary Public Hospital at Recife, Brazil, were assessed. Clinical samples were processed for mycological diagnosis using standard methods (direct examination and isolation in culture) at the Medical Mycology Laboratory, Federal University of Pernambuco, Recife, Brazil. Direct examination was performed without needing to add staining or clarification for blood samples and with India ink staining to CSF. Cultures were prepared using Sabouraud dextrose
agar (SDA) (Difco) with chloramphenicol (50 mg mL-1) and
incubated at 35 °C in an aerobic atmosphere for 15 days.
Pure cultures were transferred onto the surface of SDA
for taxonomic identification.19,20 All clinical isolates were
stocked in URM Culture Collection.
Pure 6CN10 and 6CN10:HP-β-CD complexes were
evaluated for antifungal potential. The concentrations tested
ranged from 2 to 2048 µg mL-1.
Reference microdilution trays, containing serial drug dilutions were prepared by following the CLSI M27-A3
guidelines.21 6CN10 and 6CN10:HP-β-CD were dissolved
in dimethyl sulfoxide (DMSO), and then stored at −80 °C.
In order to obtain a yeast inoculum containing 1.0 to
5.0 × 10⁶ CFU mL-1, each strain was cultured in a tube
containing 20 mL of 4% Sabouraud dextrose agar (SDA; Difco) plus yeast extract at 35 °C for two days. After that, yeast suspensions were prepared in sterile physiological solution (0.85%) and adjusted to 90% transmittance at 530 nm. Two serial dilutions from 1:100 and 1:20 were made to obtain
a final inoculum containing 0.5 to 2.5 × 10³ CFU mL-1.
The tests were performed in RPMI 1640 medium
buffered with 3-(N-morpholino)propanesulfonic acid
(MOPS). Microplate wells were inoculated with 100 µL
of the previously obtained inoculum. The microplates
were incubated at 35 °C in a non-CO2 incubator and were
visually evaluated 72 h after the incubation. The minimum inhibitory concentrations (MICs) corresponded to the lowest drug dilution that showed growth inhibition compared to the control wells. All tests were performed in duplicate.
Results and Discussion
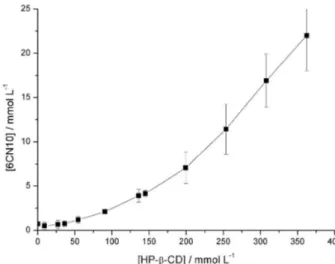
Phase solubility studies
The phase solubility diagram is the most commonly used method to evaluate the effect of cyclodextrin in the
aqueous solubility of a drug.14 The phase solubility profile
of 6CN10 in aqueous solutions of HP-β-CD is presented in
Figure 1. The solubility of 6CN10 increased with a rise in
the HP-β-CD concentration, showing a positive deviation
from linearity, indicating an AP-type phase solubility
diagram. This may indicate the formation of 1:1 and 1:2
stoichiometric ratios of 6CN10:HP-β-CD complexes.
Furthermore, the AP-type phase solubility diagram also
indicated the formation of complex aggregates that can solubilize an additional amount of the guest molecules through non-inclusion complexation as also suggest by the
study of molecular modeling and docking.22,23 The apparent
solubility of 6CN10 with 0.36 mol L-1 of HP-β-CD was
increased by more than 29-fold, confirming the ability of the
HP-β-CD to improve the apparent solubility of the 6CN10.
The K values are good indicators to estimate the binding
strength between the ligand and host.14,23 The value of K
1:1
and K1:2 were 94 and 0.1989 M-1, respectively. A small K
value indicates a weak interaction with a higher amount of free ligand, while large K value indicates the formation
of a stable complex. The K1:1 value was much larger than
the K1:2, indicating that the 1:1 complex is more stable than
the 1:2 complex.
For poorly soluble drugs, like 6CN10, S0 is in general
much larger than the intrinsic solubility of the compound
in water (Sint). This can lead to erroneous K-values.
According to Loftsson et al.,16 a more accurate method for
determination of the solubilizing efficiency of cyclodextrins with poorly soluble drugs is to determine their complexation
efficiency due to the independence of both S0 and Sint in
the calculation. The CE of 6CN10 in HP-β-CD solution,
calculated according to equation 2, was 0.059. This value
indicated that the molar ratio of [6CN10]:[HP-β-CD] was
1:18, which implies that the host will be responsible for a great increase in formulation bulk.
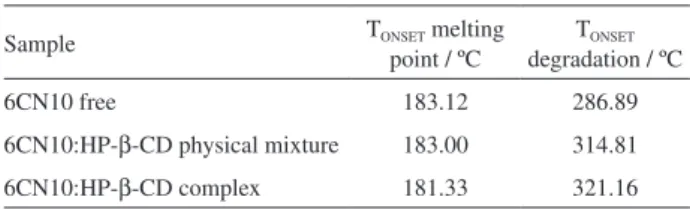
Thermogravimetric analysis
Thermal analyses can be used to detect the formation of inclusion complexes. When guest molecules are embedded in CD cavities, their melting, boiling or degradation points
generally shift to a different temperature or disappear.6,24,25
Analyzing the 6CN10 and physical mixture, DTA curves with a peak at 186 ºC can be observed with an onset
temperature (TONSET) 183 ºC, corresponding to the melting
point of the drug. However, in the complex this TONSET
changes to 181 ºC. A reduction in TONSET in the melting point
normally indicates a possible destabilization of the crystal lattice of the compound. This phenomenon indicates an improvement in the drug solubility due to the crystalline conformation being changed to an “arrangement” of lower energy. Furthermore, the degradation temperature of the complex, presented in Table 2, shows that the complexation confers stability to 6CN10, since with the complex formation the initial degradation temperature was displaced from 286 to 321 ºC. In the physical mixture a physical delay of the initial degradation temperature is also shown, although less effective when compared to the inclusion complex.
X-Ray diffraction
Powder X-ray diffractometry is a useful method for the detection of CD complexation in powder or microcrystalline
states. The XRD patterns of 6CN10, HP-β-CD, physical
mixture and the corresponding inclusion complex are presented in Supplementary Information (Figure S1). The XRD pattern of pure drug presented several diffraction peaks that demonstrate the crystalline nature of the drug.
The HP-β-CD exhibited a typical crystalline diffraction
pattern, confirming its amorphous character. The XRD
pattern of 6CN10 and HP-β-CD physical mixture
presented the characteristic of the HP-β-CD, whereas some
crystallinity peaks of the drug were observed. The sharp peaks of the pattern indicated the retention of the crystalline structure of 6CN10 in the physical mixture. However, the XRD pattern of the inclusion complex was evidently different from the XRD patterns of the raw materials, with an intense reduction in the sharp peaks, indicating the formation of amorphous material. These results indicate
the formation of 6CN10:HP-β-CD complexes.
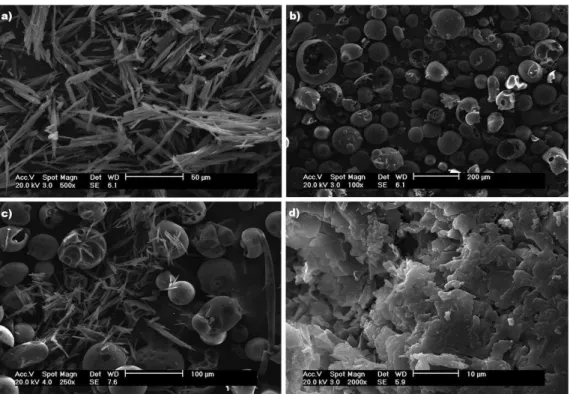
Scanning electron microscopy
The SEM photographs of 6CN10, HP-β-CD, 6CN10
and HP-β-CD physical mixture and 6CN10:HP-β-CD
complex are presented in Figure 2. The 6CN10 is presented
as a needle-like crystal, whereas HP-β-CD was observed
as an amorphous compound. In the 6CN10 and HP-β-CD
physical mixture the characteristic of the HP-β-CD and
6CN10 crystal is clearly observed. However, the SEM of the complex showed that the original morphology of the raw materials disappeared, and it was not possible to
differentiate the 6CN10 and HP-β-CD. These changes in
the morphologic aspect of the complex samples suggest the
existence of a single phase as previously related.26,27 The
comparison of these images suggests the formation of the
complex between the 6CN10 and the HP-β-CD.
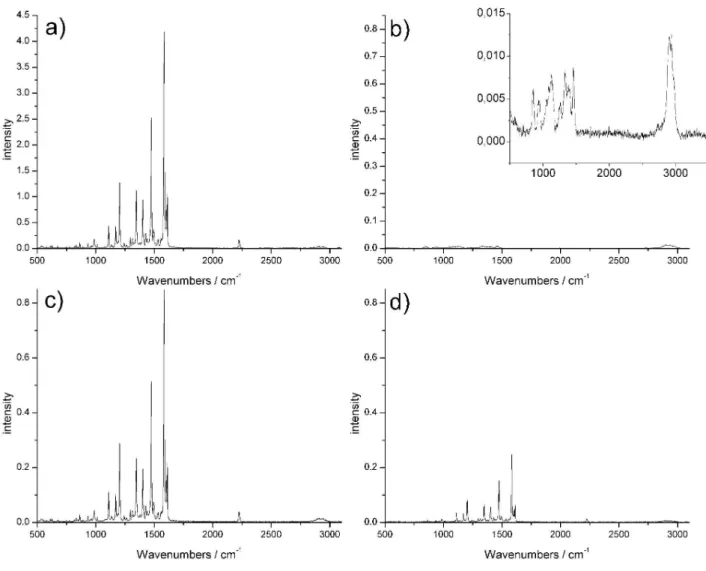
Fourier transform infrared and Raman spectroscopy
The FTIR spectra of 6CN10, HP-β-CD, 6CN10 and
HP-β-CD physical mixture and 6CN10:HP-β-CD complex
are presented in Figure 3. The FTIR spectrum of 6CN10 shows the presence of the main characteristic bands of
C−H stretch (aliphatics and aromatics) at 2850-3050 cm-1,
the C≡N stretching at 2221 cm-1 and the symmetric and
asymmetric stretching vibration of nitro group (NO2) at
1553 and 1346 cm-1. The most characteristic bands of
HP-β-CD appeared at 3402 (O–H, characterizing the
presence of intermolecular hydrogen bonds); 2931 (C–H); 1159, 1083 and 1031 (C–H and C–O–C). These results are
in agreement with the previous studies.17,28 The IR spectrum
of the physical mixture did not differ significantly from those of the single components and can be interpreted as
Table 2. Initial temperatures of melting and degradation of 6CN10,
physical mixture and complex
Sample TONSET melting
point / ºC
TONSET degradation / ºC
6CN10 free 183.12 286.89
6CN10:HP-β-CD physical mixture 183.00 314.81
the linear combination of the corresponding 6CN10 and
HP-β-CD spectra. Analyzing the 6CN10:HP-β-CD complex
spectrum, a narrowing of the absorption band around
3402 cm-1 can be observed due to the axial deformation
of O–H stretch. Alteration in the intensity in this broad peak was previously associated with the formation of
inclusion complex.28 Furthermore, a significant decrease
in the intensity of all characteristic absorptions bands of 6CN10 was observed, probably owing to a restriction in the vibration related to the complexation process.
This phenomenon is observed in all spectra, however, it is better evidenced in the region of the symmetric and asymmetric stretching vibration of the nitro group (bands
at 1553 and 1346 cm-1) and symmetric and asymmetric
stretching of the imine group (band at 1590 cm-1).
These changes in FTIR spectra suggest that the
interaction between the 6CN10 and HP-β-CD does not
occur by an inclusion process, which is generally observed only decrease in the intensity of the absorptions bands of the functional groups that are within the cyclodextrin cavity,
or very close to the cavity.28,29 Furthermore, no additional
peaks were detected in the spectrum of 6CN10:HP-β-CD
complex, indicating the absence of any chemical reactions
between 6CN10 and HP-β-CD.
Raman spectroscopy has been used as a complementary
technique to evaluate the complex formation.30-33 This
technique presents a clear advantage when compared to the analogous FTIR spectra due to the relative silence of the cyclodextrin in the Raman spectra, which does
not show any relevant overlap in the spectral patterns, permitting a better comparison between the free and the
included molecule.34
Raman spectra showed a decrease in the peak intensity
in the 6CN10:HP-β-CD complex when compared with the
6CN10 and with the 6CN10 and HP-β-CD physical mixture
spectra (Figure 4). Such attenuation of signal intensity was previously connected to a reduction of electron molecular polarizability within the complex probably due the
interactions between the compound and CD.32,33 Similar
to the results obtained in the FTIR spectra, no spectral
Figure 2. Scanning electron microscopy of (a) 6CN10; (b) HP-β-CD; (c) physical mixture and (d) 6CN10:HP-β-CD complex.
difference from the free 6CN10 and 6CN10 in the complex was observed, reinforcing the absence of any chemical
reaction between 6CN10 and HP-β-CD.
Nuclear magnetic resonance study
1D and 2D 1H NMR analysis were used for study
complex formation in solution phase. The differences in hydrogen chemical shifts between 6CN10 in the free and in the complexed states were analyzed and are presented
in Table 1. The influence of HP-β-CD on the chemical
shifts of 6CN10 hydrogens is also shown in Supplementary Information. An upfield shift displacement, as observed, indicates the existence of weaker interaction (van der Waals forces) between 6CN10 hydrogens and cyclodextrin
chains. Moreover, T1 values of the 6CN10 hydrogens
signals change between the free and the complexed states, indicating a change of 6CN10 dynamics, which suggest the existence of formation of both complexes (1:2 and 1:1
molar ratios) (Table 1).35,36
To obtain further information on the complex formation, 2D ROESY experiments were performed in order to evaluate the mode of complexation and spatial arrangement
between 6CN10 and HP-β-CD atoms. Intermolecular
cross-peaks were observed between imine and aromatic
hydrogens of 6CN10 and HP-β-CD hydrogens (Figure 5),
corroborating the 1H NMR data that showed that the major
changes in the chemical shifts happened in the imine and aromatic hydrogens of 6CN10 in complex.
The 2D ROESY results also suggest that complexes 1:2 and 1:1 molar ratios were formed between 6CN10 and
HP-β-CD, but as the individual HP-β-CD hydrogens could
not be assigned to resonance signals, inclusion process by noncovalent interactions cannot be confirmed using 2D NMR technique.
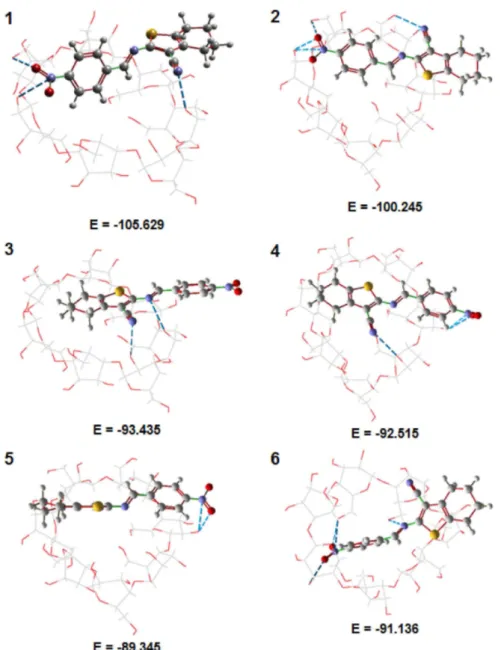
Molecular modeling and docking study
The molecular docking performed showed that 6CN10 has a greater length than the width of the cavity of
HP-β-CD. In Figure 6 we can observe the six 3D positions with lower energies along with the hydrogen bonds and
their energy values (Edock). The dashed lines in each position
represent hydrogen bonds between 6CN10 and HP-β-CD.
The groups responsible for these interactions in 6CN10
are the radicals 4-nitro (−NO2), and the nitrogen of the
nitrile (−C≡N) and imine (−C=N−) and represent the
strongest interactions between the HP-β-CD and 6CN10,
which contribute to stabilization of the complex (data also
observed in the 1H NMR and ROESY).
Among the six lowest energy positions, in five different poses the 6CN10 is over the cyclodextrin cavity but not inside (poses 1-5). The only position in which the 6CN10
is inside the cavity (position 6, Edock = −91.136 kJ mol-1)
Figure 5. Expansion of a 2D ROESY of 6CN10:HP-β-CD complex 1:1 molar ratio in DMSO-d6.
there is a higher energy value than four of the five positions (positions 1 to 4) found outside the cavity (Figure 6). The energy difference is very significant (higher than 10%) when comparing positions 1 and 2 (outside the cavity) with position 6 (inside the cavity).
These docking results indicate that the 6CN10 is able to
form stable complexes with HP-β-CD, but the interaction
preferably takes place by the outer portion of HP-β-CD,
generating non-inclusion complexes.
These results also support and are in accordance with the IR and NMR data. Since, if there was a preferential or exclusive formation of inclusion complexes between
6CN10 and HP-β-CD, we would not expect to observe
deviations in the chemical shifts and in the T1 values of
all 6CN10 hydrogens and a decrease in the intensity of all characteristic absorptions bands of 6CN10 as found in our study.
Based in these NMR and docking data, associated with the phase solubility results, we can affirm that the 6CN10
is able to form stable complexes with HP-β-CD, however,
the differences observed in the curve lead us to believe in the concomitant existence of different populations of
6CN10:HP-β-CD complexes, including inclusion and
preferably, non-inclusion complexes.
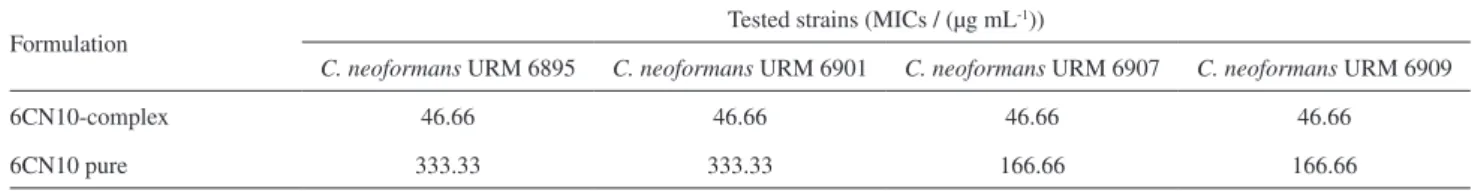
Antifungal activity evaluation
Comparative data of the antifungal activity of free
6CN10 and 6CN10:HP-β-CD complex are presented in
Table 3. As can be seen, both the free 6CN10 and the 6CN10 complex were able to inhibit the growth of the
C. neoformans strains. However, the inclusion of the
6CN10 in the HP−β-CD caused a significant improvement
in the anti-Cryptococcus activity profile, promoting an
increase in the activity from about 3.5 to 7 times (from
333.33-166.66 µg mL-1 (free drug) to 46.66 µg mL-1
(complexed drug)). This may be directly related to improved water solubility of 6CN10 upon complexation.
The results suggest that the formation of the complex
between the 6CN10 and the 2-hydroxypropyl-β-cyclodextrin
clearly improves the in vitro antifungal effect of the active
compound against Cryptococcus neoformans. Furthermore,
the formulation of 6CN10:HP-β-CD complex may be a
Table 3. Antifungal activity of free 6CN10 and 6CN10:HP-β-CD complex against Cryptoccocus neoformans
Formulation Tested strains (MICs / (µg mL
-1))
C. neoformans URM 6895 C. neoformans URM 6901 C. neoformans URM 6907 C. neoformans URM 6909
6CN10-complex 46.66 46.66 46.66 46.66
6CN10 pure 333.33 333.33 166.66 166.66
promising antifungal formulation to be used as a traditional or as a new drug delivery system.
Conclusions
In this study, a 6CN10:HP-β-CD complex was
successfully prepared by freeze-drying method and provides an alternative means of overcoming the low aqueous solubility of the 6CN10. The complexation was able to enhance the apparent solubility and thermal stability of the drug. The molecular complexation mechanism proposed by FTIR, NMR and docking data showed that the 6CN10 is able to form stable
complexes with HP-β-CD, but preferably by the outer
portion, generating the formation of both inclusion and, preferentially non-inclusion complexes. Furthermore, FTIR, Raman, TG-DTA, XRD and SEM confirm that
the 6CN10:HP-β-CD complex can lead to modifications
in the physicochemical characteristics of the drug, as thermal stability and crystallinity properties. Regarding the antifungal activity, the considerable increase in 6CN10 solubility in the complexed form, potentially enhanced the in vitro antifungal efficacy of 6CN10 (up to 7-fold).
The results reveal that this inclusion complex should be regarded as a promising strategy in the design of a novel formulation of 6CN10, and others low soluble drugs to
function as new antifungal agents. Further in vivo studies
comparing the 6CN10 and 6CN10:HP-β-CD inclusion
complexes will be conducted to corroborate the results of this investigation.
Supplementary Information
Supplementary data are available free of charge at http://jbcs.sbq.org.br as PDF file.
Acknowledgments
References
1. Puterova, Z.; Krutosikova, A.; Vegh, D.; Arkivoc2010, 209. 2. Souza, B. C. C.; De Oliveira, T. B.; Aquino, T. M.; de Lima, M.
C. A.; Pitta, I. R.; Galdino, S. L.; Lima, E. O.; Goncalves-Silva, T.; Militao, G. C. G.; Scotti, L.; Scotti, M. T.; Mendonça Jr., F. J. B.; Acta Pharm.2012, 62, 221.
3. Mendonça, F. J. B.; Lima-Neto, R. G.; de Oliveira, T. B.; de Lima, M. D. A.; Pitta, I. R.; Galdino, S. L.; da Cruz, R. M. D.; de Araujo, R. S. A.; Neves, R. P.; Lat. Am. J. Pharm.2011, 30,
1492.
4. Scotti, L.; Scotti, M. T.; Lima, E. O.; da Silva, M. S.; de Lima, M. C. A.; Pitta, I. R.; de Moura, R. O.; de Oliveira, J. G. B.; da Cruz, R. M. D.; Mendonça Junior, F. J. B.; Molecules2012,
17, 2298.
5. Figueiras, A.; Ribeiro, L.; Vieira, M. T.; Veiga, F.; J. Inclusion Phenom. Macrocyclic Chem.2007, 57, 173.
6. He, Z.; Wang, Z.; Zhang, H.; Pan, X.; Su, W.; Liang, D.; Wu, C.; Acta Pharm. Sin. B2011, 1, 254.
7. Hu, L.; Zhang, H.; Song, W.; Gu, D.; Hu, Q.; Carbohydr. Polym.
2012, 90, 1719.
8. Del Valle, E. M. M.; Process Biochem.2004, 39, 1033.
9. Wu, H.; Liang, H.; Yuan, Q.; Wang, T.; Yan, X.; Carbohydr. Polym.2010, 82, 613.
10. Carrier, R. L.; Miller, L. A.; Ahmed, I.; J. Control. Release
2007, 123, 78.
11. Hwang, Y. Y.; Shin, D. C.; Nam, Y. S.; Cho, B.-K.; J. Ind. Eng. Chem.2012, 18, 1412.
12. Lyra, M. A. M.; Soares-Sobrinho, J. L.; Figueiredo, R.; Sandes, J. M.; Lima, A. A. N.; Tenorio, R. P.; Fontes, D. A. F.; Santos, F. L. A.; Rolim, L. A.; Rolim-Neto, P. J.; J. Inclusion Phenom. Macrocyclic Chem.2012, 73, 397.
13. Gould, S.; Scott, R. C.; Food Chem. Toxicol.2005, 43, 1451. 14. Higuchi, T.; Connors, K. A. In Advances in Analytical Chemistry
and Instrumentation, vol. 4; Reilley, C. N., ed.; 1965, p. 117. 15. Loftsson, T.; Hreinsdóttir, D.; Másson, M.; Int. J. Pharm.2005,
302, 18.
16. Loftsson, T.; Hreinsdottir, D.; Masson, M.; J. Inclusion Phenom. Macrocyclic Chem.2007, 57, 545.
17. Mendonça, E. A. M.; Lira, M. C. B.; Rabello, M. M.; Cavalcanti, I. M. F.; Galdino, S. L.; Pitta, I. R.; Lima, M. C. A.; Pitta, M. G. R.; Hernandes, M. Z.; Santos-Magalhaes, N. S.; AAPS PharmSciTech2012, 13, 1355.
18. Thomsen, R.; Christensen, M. H.; J. Med. Chem.2006, 49,
3315.
19. Barnett, J. A.; Payne, R. W.; Yarrow, D.; Yeasts: Characteristics and Identification; Cambridge University Press: Cambridge,
UK, 2000.
20. Hoog, G. S.; Guarro, J.; Gené, J.; Figueras, M. J.; Atlas of Clinical Fungi, 2nd ed.; American Society for Microbiology:
Utrecht/Reus, 2000.
21. Clinical and Laboratory Standards Institute; M27-A3 Reference Method for Broth Dilution Testing of Yeasts: Approved
Standard-Third Edition; CLSI: Wayne, 2008.
22. Zhou, Q.; Wei, X.; Dou, W.; Chou, G.; Wang, Z.; Carbohydr. Polym.2013, 95, 733.
23. Loftsson, T.; Masson, M.; Brewster, M. E.; J. Pharm. Sci.2004,
93, 1091.
24. Marques, H. M. C.; Hadgraft, J.; Kellaway, I. W.; Int. J. Pharm.
1990, 63, 259.
25. Shen, C.; Yang, X.; Wang, Y.; Zhou, J.; Chen, C.; J. Inclusion Phenom. Macrocyclic Chem.2012, 72, 263.
26. Haiyee, Z. A.; Saim, N.; Said, M.; Illias, R. M.; Mustapha, W. A. W.; Hassan, O.; Food Chem.2009, 114, 459.
27. Reddy, M. N.; Rehana, T.; Ramakrishna, S.; Chowdary, K. P. R.; Diwan, P. V.; AAPS PharmSci2004, 6, 68.
28. Wang, J.; Cao, Y.; Sun, B.; Wang, C.; Food Chem.2011, 124,
1069.
29. Tang, P.; Ma, X.; Wu, D.; Li, S.; Xu, K.; Tang, B.; Li, H.;
Carbohydr. Polym.2016, 142, 16.
30. Heise, H. M.; Kuckuk, R.; Bereck, A.; Riegel, D.; Vib. Spectrosc.
2010, 53, 19.
31. Iliescu, T.; Baia, M.; Miclaus, V.; Eur. J. Pharm. Sci.2004, 22,
487.
32. Li, W.; Lu, B.; Chen, F.; Yang, F.; Wang, Z.; J. Mol. Struct.
2011, 990, 244.
33. Mohan, P. R. K.; Sreelakshmi, G.; Muraleedharan, C. V.; Joseph, R.; Vib. Spectrosc.2012, 62, 77.
34. Arrais, A.; Savarino, P.; J. Inclusion Phenom. Macrocyclic Chem.2009, 64, 73.
35. Ceborska, M.; Zimnicka, M.; Pietrzak, M.; Troc, A.; Kozbial, M.; Lipkowski, J.; Org. Biomol. Chem.2012, 10, 5186. 36. Pessine, F. B. T.; Calderine, A.; Alesandrino, G. L. In Magnetic
Resonance Spectroscopy; Kim, D.-H., ed.; InTech: Rijeka, Croatia, 2012, ch. 12.
Submitted: February 26, 2016