Article
Printed in Brazil - ©2017 Sociedade Brasileira de Química0103 - 5053 $6.00+0.00
*e-mail: [email protected]
Determination of Volatile Organic Compounds in Andean Tomato Landraces by
Headspace Solid Phase Microextraction-Gas Chromatography-Mass Spectrometry
Pablo R. Cortina,a Ramón Asis,b Iris E. Peralta,c,d Pablo D. Asprellid,e and Ana N. Santiago*,a
aINFIQC, Departamento de Química Orgánica and bCIBICI, Departamento de Bioquímica Clínica,
Facultad de Ciencias Químicas, Universidad Nacional de Córdoba, Ciudad Universitaria, 5000 Córdoba, Argentina
cIADIZA CCT CONICET Mendoza, Parque General San Martín, 5500 Mendoza, Argentina
dFacultad de Ciencias Agrarias, Universidad Nacional de Cuyo y CCT CONICET Mendoza,
Chacras de Coria, Luján de Cuyo, 5505 Mendoza, Argentina
eEEA La Consulta, INTA, La Consulta, San Carlos, 5567 Mendoza, Argentina
Traditional tomatoes (Solanum lycopersicum L.) have been mainly selected for their fruit quality and maintained by local farmers in Andean areas of Cuyo and Northwestern Argentina. Volatile organic compounds (VOCs) in mature fruits of Andean tomato landraces were evaluated for the first time using headspace solid phase microextraction (HS-SPME) and gas chromatography-mass spectrometry (GC-MS) and combined with classical multivariate analysis. The data sets composed of 101 volatile metabolites were identified in 4 accessions of Andean landraces, one commercial variety and one wild tomato accession (Solanum pimpinellifolium L.). The metabolic profile showed typical VOCs of tomato and 21 new compounds never informed in S. lycopersicum. Andean traditional tomatoes have been shown to be metabolically different from wild species. In addition, some varieties of Andean tomatoes have a different profile of VOCs and are richer than the commercial variety. A different and original metabolic volatile composition found in fruits of Andean tomato landraces of Argentina, in comparison with commercial cultivars, might probably reveals selection based on quality attributes made by local farmers.
Keywords: tomato, fruit, SPME, volatile metabolites, multivariate analysis
Introduction
The study of volatile organic compounds (VOCs) in fruits and vegetables poses a continuous analytical challenge. Some problems are due to the low levels of VOCs present in complex matrices, together with their large chemical diversity. In recent years, the trend for new analytical strategies has aimed at maximizing the extraction and exhaustive identification of VOCs (omics-like) present in the sample. This design requires the optimization of careful methodology, including sample conservation and preparation. Several processes must be under control, like care extraction, concentration and analytical determination in order to obtain reliable and reproducible results.1 Solid phase microextraction (SPME) is one of the methodologies employed in recent years for determining
The analysis of VOCs in tomato fruit has been studied for a long time, reporting to date approximately 400 VOCs in different varieties of the cultivated species S. lycopersicum.7 Within this extensive list of VOCs, a small group of volatile metabolites is considered of fundamental importance due to its role in the development of the characteristic aroma of ripe fruit.8 Further, those VOCs reveal a correlation with health-promoting compounds and essential nutrients such as aminoacids and fatty acids.9 VOCs profile in tomato includes a large variety of molecules having low molecular weight, with extensive physicochemical characteristics, different functional groups and multiple metabolic origins.10
In the present study, we report on the use of headspace solid phase microextraction and gas chromatography-mass spectrometry (HS-SPME-GC-MS) as a reliable methodology to determine the VOCs composition in tomato landraces that have been mainly selected for their good fruit quality and flavor by local farmers in Andean areas of Cuyo and Northwestern Argentina.11 This report is the first study of VOCs in local varieties of tomatoes from this geographical area, where their fruit metabolomic volatile profile is described and compared with the composition found in commercial varieties and in the wild ancestral and most related species S. pimpinellifolium.
Experimental
Growing tomato plants
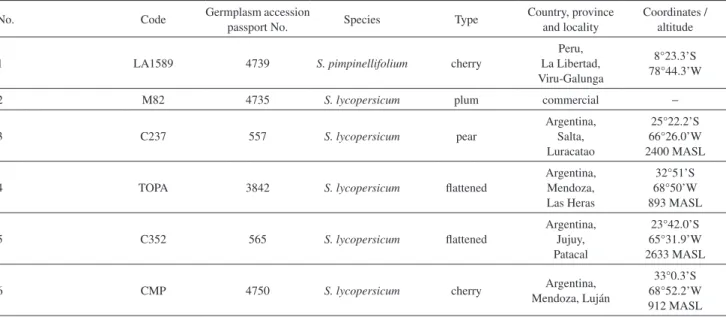
Traditional tomatoes or landraces have been recovered recently in Andean areas of Cuyo and Northwestern
Argentina and maintained in the Horticulture Germplasm Bank of La Consulta Agricultural Experimental Station of the National Institute of Agropecuary Technology (INTA), Mendoza, Argentina (Table 1). These landraces have been evaluated and characterized by their agronomic performance, plant morphology and fruit quality traits.11
The VOCs composition was determined in selected tomato landraces (germplasm passport 4750, 3842, 565 and 557) considered as potential heirloom varieties.12,13 These Andean tomato landraces possess a diverse morphology compared with the standard plum-shaped fruit of the cultivable variety, M82 (germplasm passport 4735); 4750 accession have a regular brown-greenish cherry fruit, 557 accession have a red pear-shaped fruit, and 565 and 3842 accessions have large round-flattened, slightly segmented fruits (named Platense type in Argentina). These traditional tomatoes are also very prized for their intense flavor, flesh quality, color and texture. These important organoleptic characteristics allow considering Andean landraces and similar local varieties as valuable genomic reservoirs for improvement of future tomato cultivars with modern breeding techniques.14 One accession (LA1589, originally from C. M. Rick Tomato Genetics Resource Center, University of California, Davis, USA; Horticulture Germplasm Bank passport number 4739) of Solanum pimpinellifolium, a wild species closely related to cultivated tomatoes, was also included in this study.
Seeds were provided by the Horticulture Germplasm Bank. Plants were grown according to a random design with three replicates, in comparative field parcels of the Institute of Horticulture, Agronomy Faculty of the National
Table 1. Tomato varieties studied (2009)
No. Code Germplasm accession
passport No. Species Type
Country, province and locality
Coordinates / altitude
1 LA1589 4739 S. pimpinellifolium cherry
Peru, La Libertad, Viru-Galunga
8°23.3’S 78°44.3’W
2 M82 4735 S. lycopersicum plum commercial −
3 C237 557 S. lycopersicum pear
Argentina, Salta, Luracatao 25°22.2’S 66°26.0’W 2400 MASL
4 TOPA 3842 S. lycopersicum flattened
Argentina, Mendoza, Las Heras 32°51’S 68°50’W 893 MASL
5 C352 565 S. lycopersicum flattened
Argentina, Jujuy, Patacal 23°42.0’S 65°31.9’W 2633 MASL
6 CMP 4750 S. lycopersicum cherry Argentina,
Mendoza, Luján
33°0.3’S 68°52.2’W 912 MASL
University of Cuyo, Mendoza, Argentina (32°50’S, 68°52’O, 900 meters above sea level). Mature fruits were harvested at the end of February 2009, in sunny days between 10:00 am and 16:00 pm in order to avoid variations in metabolism due to environmental light effects.
Fruit samples were selected fully red ripe (80 to 100% of the tomatoes revealed a uniform red coloration) with firm pericarp (should yield slightly to finger pressure), which is the mature stage normally preferred by people for fresh consumption. In all cases, six to ten different fruits from each landrace accession, commercial cultivars and the wild tomato species were harvested from three replicates, randomly distributed in the experimental parcel in order to avoid environmental effects.1 Harvested fruits were immediately transported in an icebox to the laboratory. Each fruit was immediately chopped, frozen in liquid nitrogen and stored in ultra-freezer at −80 °C in individual plastic boxes until sample processing. Frozen samples were ground in an electrical mill previously cooled with liquid nitrogen until obtaining a homogeneous fine tomato powder. Grounded samples were stored in freezer at −80 ºC in 50 mL polypropylene tube until sample analysis.
Sample preparation
Tomato powder (1.0 g) was placed in a polypropylene tube (15 mL) and immersed in a water bath at 35 °C for 10 min. Next, 15 µL of 2-methylcyclohexanone (internal standard dissolved in methanol at a concentration of 23 mg L-1) were added to the samples in addition to 1 mL ethylenediaminetetraacetic acid/sodium hydroxide (EDTA/NaOH) solution and CaCl2 (2.2 g). EDTA/NaOH aqueous solution was prepared by adjusting 100 mM EDTA to a pH = 7.5 with sodium hydroxide. Samples were sonicated for 15 min. Then, 1 mL processed sample was transferred to a 10 mL screw-capped (magnetic cap) vial, fitted with a silicone septum. The vial was introduced in a Combi Pal (Varian Inc.) autosampler and conditioned 10 min at 50 °C with 500 rpm shaking speed. After that, VOCs arising from the sample headspace were extracted using a SPME fiber assembly divinylbenzene/carboxen/polydimethylsiloxane (DVB/CAR/PDMS) (50/30 µm, 1 cm long from Supelco Ltd., Bellefonte, PA, USA) during 35 min at 50 °C and with 250 rpm shaking speed. Adsorbed VOCs were immediately desorbed at 250 °C in the injection port of the GC during 1 min.
Analysis of volatile organic compounds (VOCs) using gas chromatography-mass spectrometry
VOCs were measured using gas chromatography coupled to mass spectrometry (GC-MS) by capillary GC
(Varian 3800 gas chromatograph equipped with a Varian VF-5ms column, 30 m × 0.25 mm i.d. 1.00, 0.25 µm film thickness) and analyzed by MS using an ion trap detector (ITD-Varian 2000 MS). The SPME fiber was further heated for 3 min at 250 °C under nitrogen to avoid carry-over effect in the bake-out module. The MS trap temperature was set at 200 °C, the manifold was heated at 100 °C and the transfer line at 230 °C to avoid condensation of VOCs at the GC-MS interface. Electron impact mass spectra were recorded at 70 eV ionization energy in the 33-300 amu mass range in scanning mode, with 1 scan per second. Oven temperature conditions were 35 °C for 5 min, 3 °C min-1 ramp until 45 °C and 1.5 °C min-1 ramp until 50 °C, held for 1.5 min, 3 °C min-1 ramp until 68 °C, held for 2 min, 3 °C min-1 ramp until 131 °C, held for 1 min, 10 °C min-1 ramp until 250 °C, and then held isothermally at 250 °C for 2.93 min using helium 5.0 ultrapure carrier gas at 1 mL min-1. The runtime for a single chromatographic analysis was 58 min. Mass spectra were analyzed with the Varian MS Workstation (Version 6.6) software.
Data analysis
The integrated area of each metabolite was normalized to the sample weight (1 g) in HS-SPME optimization. The area of a selected m/z for a given VOCs (Ion area) was normalized to the sample weight (1 g) and the area of m/z = 112 of the internal standard (Sti area) in order to obtain the final volatile profiles (equation 1). Data tables are in the Supplementary Information, Table S7.
(1)
VOCs data were processed and analyzed by univariate and multivariate statistical techniques. Significant differences were obtained on VOCs data applying an analysis of variance (ANOVA) using a significance level of p < 0.05 and a mean comparison method, DGC.15 Multivariate data analysis was performed using principal component analysis (PCA) and discriminant analysis (DA). All statistical techniques were applied using the statistical software Infostat.16
Results and Discussion
SPME optimization
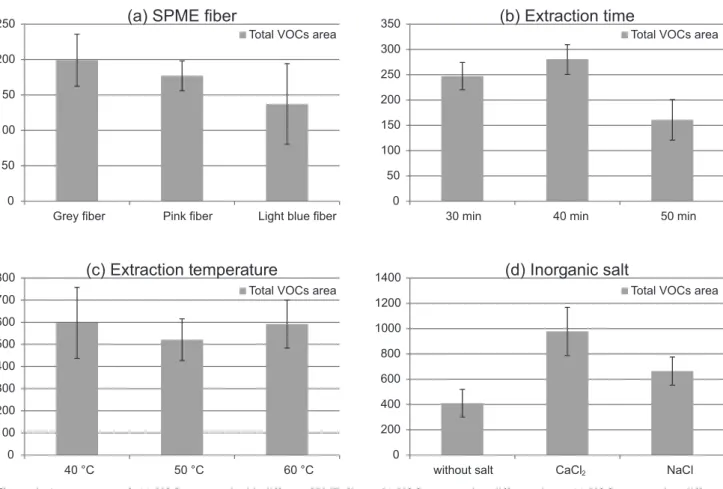
optimization parameters. Some VOCs known in tomato were chosen to perform SPME optimization. The criterion for the best parameter extraction condition was the highest total average peak area and the minimal variation (CV, %) of the selected VOCs. Based on a previous report,5 three commercially available SPME fibers, 75 µm carboxen/ polydimethylsiloxane (CAR/PDMS: light blue), 65 µm divinylbenzene/polydimethylsiloxane (DVB/PDMS: pink) and 50/30 µm DVB/CAR/PDMS (grey) were tested for extraction efficiency. Figure 1a summarizes average normalized areas of total selected compounds and standard deviation with different SPME fibers. Even though there are no significant differences between SPME fibers, the grey one shows higher absorption (Figure 1a) and the lowest individual analytical variability (CV 15.6%, for more details see Supplementary Information, Table S1). Based on this, DVB/CAR/PDMS (50/30 µm) (grey) was the fiber chosen to extract the volatile metabolites from tomato.
Having selected the fiber (DVB/CAR/PDMS), the effect of extraction time change was assessed. The extraction was performed during 30, 40 and 50 minutes, at 30 °C under constant shaking. As shown in Figure 1b, higher area values are obtained at 30 or 40 minutes. In general, VOCs of lower molecular weight have higher area values at
short times; instead, VOCs of higher molecular weight have higher area values at longer extraction times (for further details see Supplementary Information, Table S2). Given the chemical nature of the VOCs, the small difference in area between 30 and 40 minutes, and the need for a shorter analysis time due to the number of samples, it was decided that 35 minutes was the most convenient extraction time.
The next experimental parameter analyzed was extraction temperature of VOCs in the fiber. Using the previously selected parameters ((DVB/CAR/PDMS) fiber and 35 minutes of extraction time), the optimal temperature was assessed. The extraction was performed at: 40, 50 and 60 °C (Figure 1c). It should be noted that no significant differences were observed between measurements done at the three different temperatures when total area analysis was considered. However, small metabolites at lower temperatures reached higher concentrations in a shorter time in the headspace. Instead, high molecular weight VOCs needed higher temperatures to produce a significant measurement. Using the intermediate temperature of 50 ºC, a lower variability and a more elevated area of small and high molecular weight metabolites were observed (CV 18.2 against 26.2%, for more details see Supplementary Information, Table S3). Based on this phenomenon, 50 ºC
was selected to produce the best combined result in order to achieve good signal areas for the diverse chemical nature of the selected VOCs.
One of the most important challenges in the analysis of VOCs in biological matrices is to obtain a stable profile, because they can undergo transformation due to enzymatic and non-enzymatic reactions.17 The addition of inorganic salts in these matrices promotes precipitation of proteins, changing the ionic strength in the medium (salting out) and increasing the concentration of VOCs in the vapor phase.18 Sodium chloride is commonly used due to their low interference with VOCs, however in complex matrices such as tomato, CaCl2 is often used since it promotes the reduction of enzyme activity and generates the effect of salting out.8 In addition, Tikunov et al.5 reported the necessity of adding to the matrix a solution of ethylenediaminetetraacetic acid (EDTA) dissolved in sodium hydroxide. This addition causes two effects: firstly the inclusion of a chelating agent to reduce the action of certain metalloenzymes and secondly the increase in the matrix pH. Considering the physiological pH of the fruit (close to 4-4.5), lower acidity aims at reducing the enzyme action and decreasing the non-enzymatic oxidation of labile functional groups.In addition to the desirable effect of maximizing VOCs concentration in the headspace, some divalent salt can interact with specific functional groups, like thiazole, reducing the availability of interacting with the SPME fiber polymer.16
Hereby, the addition of inorganic salt and EDTA was assayed, using the best extracting fiber (DVB/CAR/PDMS), the optimal extraction temperature (50 °C) and the optimal extraction times (35 min). The extraction was performed using 1 g of sodium chloride, 1 g of CaCl2 and no salt. As Figure 1d shows, the highest total peak area was achieved using CaCl2 and the lowest was without salt addition (for further details see Supplementary Information, Table S4). Considering the best result achieved, CaCl2 was selected to enhance the VOCs extraction. Next, it was also necessary
to determine the amount of CaCl2 to be used. Hence, the extraction assay was performed using 0.75, 1.5, 2.2 and 3 g of CaCl2 (Figure 2a). As Figure 2a shows, no significant differences in total peak area were observed between measurements. However, different CaCl2 quantities produced changes in the individual areas of some VOCs. When a large amount of CaCl2 was used (3 g or above), a more orderly aggregation state of the sample matrix was obtained and some selected VOCs could not be observed at this experimental assay.19 This sample condition, as a very viscous liquid, hinders the promotion of VOCs to the headspace. On the other hand, when the minimum amount was used (0.75 g), almost all the individual areas of the VOCs decreased (for further details see Supplementary Information, Table S5). Therefore, 1.5 and 2.2 g of CaCl2 were chosen as the best conditions with minimal differences.
Finally, using the best extracting conditions, the addition of EDTA was assayed. A solution 100 mM of EDTA in NaOH at pH = 7.5 was employed. Two amounts of CaCl2 (1.5 or 2.2 g) combined with 1 mL of EDTA or without EDTA were used to optimize the best condition. As Figure 2b shows, no significant differences were observed between measurements when total area analysis was considered. Moreover, a decrease in the individual compound areas was determined using EDTA, probably due to sample dilution on matrix (Supplementary Information, Table S6). Despite this, EDTA solution was used, since a reduction in analytical variability was observed. In addition, previous work20 proposed that a dilution in sample matrix also favors the dilution of possible interferences, such as suspension fruit pulp, producing an accurate VOCs recovery. Hence, 2.2 g CaCl2 with 1 mL EDTA solution was chosen as the best condition.
Based on the best parameters obtained, the SPME optimized protocol for VOCs extraction of tomato was: DVB/CAR/PDMS SPME fiber, 50 °C extraction temperature, 35 min extraction time, 2.2 g CaCl2 with
Figure 2. (a) Average areas of VOCs extracted with different CaCl2 amount; (b) average areas of VOCs extracted with 1.5 or 2.2 g of CaCl2 without EDTA
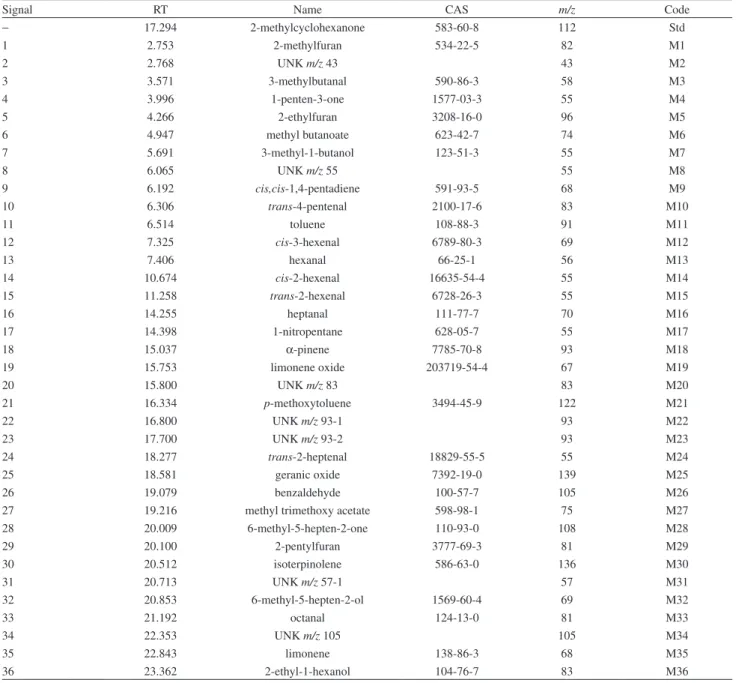
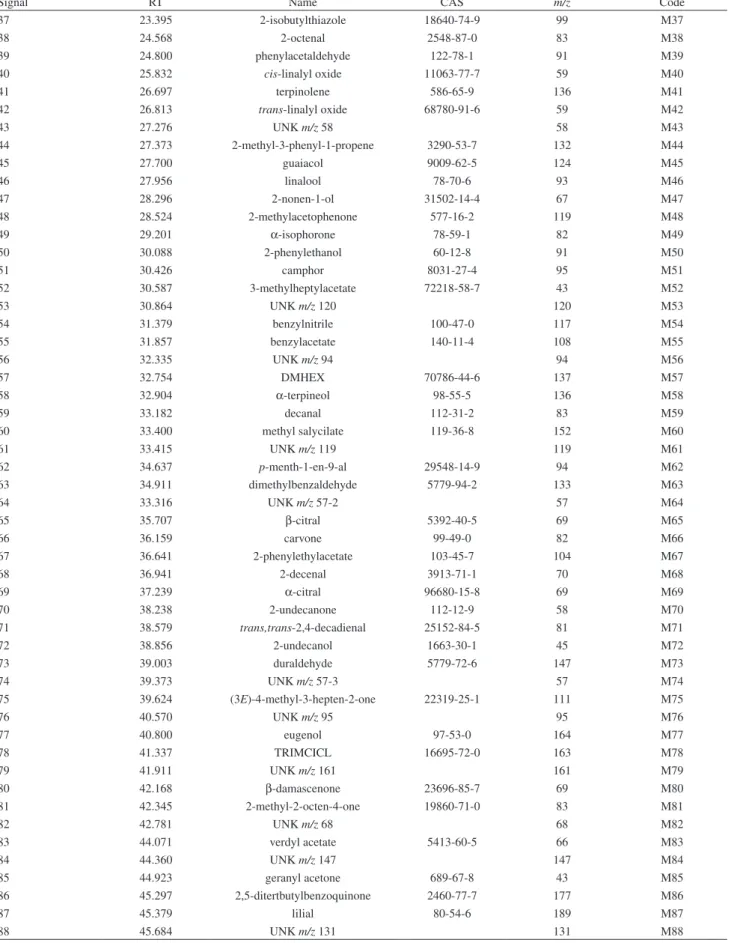
1 mL EDTA/NaOH solution. The optimized extraction protocol was used to study the VOCs of Andean tomato landraces from Argentina. A mixture of the different tomatoes included in this study was performed to adjust the chromatographic method and allow reducing signal overlapping in a complex chromatogram. The profile consisted of 101 signals of volatile metabolites; it was identified considering both retention times against known standard and mass spectral match with NIST MS library. VOCs were quantified using a relative internal standard and are expressed as relative area units per g fruit (fresh weight). Signals designated as UNK could not be assigned to a definitive structure. Despite extensive and optimized
chromatographic program used to resolve complex co-elution zones, it was necessary to employ extracted ion chromatogram (EIC) in order to quantify signals of interest.21 EIC simplifies the quantification of all the VOCs along a complex chromatogram using a specific relation of
m/z for each signal of interest (Table 2). This methodology has been used to facilitate the screening of a large amount of VOC with excellent results. For example, EIC was used to determine pesticide residues and volatile metabolites in tomato fruits.5,6,22 Table 2 shows the signals and the ions of VOCs determined in the HS-SPME-GC-MS analysis in tomato. Codes were assigned to each metabolite in order to facilitate study.
Table 2. Volatile metabolites extracted by HS-SPME-GC-MS
Signal RT Name CAS m/z Code
− 17.294 2-methylcyclohexanone 583-60-8 112 Std
1 2.753 2-methylfuran 534-22-5 82 M1
2 2.768 UNK m/z 43 43 M2
3 3.571 3-methylbutanal 590-86-3 58 M3
4 3.996 1-penten-3-one 1577-03-3 55 M4
5 4.266 2-ethylfuran 3208-16-0 96 M5
6 4.947 methyl butanoate 623-42-7 74 M6
7 5.691 3-methyl-1-butanol 123-51-3 55 M7
8 6.065 UNK m/z 55 55 M8
9 6.192 cis,cis-1,4-pentadiene 591-93-5 68 M9
10 6.306 trans-4-pentenal 2100-17-6 83 M10
11 6.514 toluene 108-88-3 91 M11
12 7.325 cis-3-hexenal 6789-80-3 69 M12
13 7.406 hexanal 66-25-1 56 M13
14 10.674 cis-2-hexenal 16635-54-4 55 M14
15 11.258 trans-2-hexenal 6728-26-3 55 M15
16 14.255 heptanal 111-77-7 70 M16
17 14.398 1-nitropentane 628-05-7 55 M17
18 15.037 α-pinene 7785-70-8 93 M18
19 15.753 limonene oxide 203719-54-4 67 M19
20 15.800 UNK m/z 83 83 M20
21 16.334 p-methoxytoluene 3494-45-9 122 M21
22 16.800 UNK m/z 93-1 93 M22
23 17.700 UNK m/z 93-2 93 M23
24 18.277 trans-2-heptenal 18829-55-5 55 M24
25 18.581 geranic oxide 7392-19-0 139 M25
26 19.079 benzaldehyde 100-57-7 105 M26
27 19.216 methyl trimethoxy acetate 598-98-1 75 M27
28 20.009 6-methyl-5-hepten-2-one 110-93-0 108 M28
29 20.100 2-pentylfuran 3777-69-3 81 M29
30 20.512 isoterpinolene 586-63-0 136 M30
31 20.713 UNK m/z 57-1 57 M31
32 20.853 6-methyl-5-hepten-2-ol 1569-60-4 69 M32
33 21.192 octanal 124-13-0 81 M33
34 22.353 UNK m/z 105 105 M34
35 22.843 limonene 138-86-3 68 M35
Signal RT Name CAS m/z Code
37 23.395 2-isobutylthiazole 18640-74-9 99 M37
38 24.568 2-octenal 2548-87-0 83 M38
39 24.800 phenylacetaldehyde 122-78-1 91 M39
40 25.832 cis-linalyl oxide 11063-77-7 59 M40
41 26.697 terpinolene 586-65-9 136 M41
42 26.813 trans-linalyl oxide 68780-91-6 59 M42
43 27.276 UNK m/z 58 58 M43
44 27.373 2-methyl-3-phenyl-1-propene 3290-53-7 132 M44
45 27.700 guaiacol 9009-62-5 124 M45
46 27.956 linalool 78-70-6 93 M46
47 28.296 2-nonen-1-ol 31502-14-4 67 M47
48 28.524 2-methylacetophenone 577-16-2 119 M48
49 29.201 α-isophorone 78-59-1 82 M49
50 30.088 2-phenylethanol 60-12-8 91 M50
51 30.426 camphor 8031-27-4 95 M51
52 30.587 3-methylheptylacetate 72218-58-7 43 M52
53 30.864 UNK m/z 120 120 M53
54 31.379 benzylnitrile 100-47-0 117 M54
55 31.857 benzylacetate 140-11-4 108 M55
56 32.335 UNK m/z 94 94 M56
57 32.754 DMHEX 70786-44-6 137 M57
58 32.904 α-terpineol 98-55-5 136 M58
59 33.182 decanal 112-31-2 83 M59
60 33.400 methyl salycilate 119-36-8 152 M60
61 33.415 UNK m/z 119 119 M61
62 34.637 p-menth-1-en-9-al 29548-14-9 94 M62
63 34.911 dimethylbenzaldehyde 5779-94-2 133 M63
64 33.316 UNK m/z 57-2 57 M64
65 35.707 β-citral 5392-40-5 69 M65
66 36.159 carvone 99-49-0 82 M66
67 36.641 2-phenylethylacetate 103-45-7 104 M67
68 36.941 2-decenal 3913-71-1 70 M68
69 37.239 α-citral 96680-15-8 69 M69
70 38.238 2-undecanone 112-12-9 58 M70
71 38.579 trans,trans-2,4-decadienal 25152-84-5 81 M71
72 38.856 2-undecanol 1663-30-1 45 M72
73 39.003 duraldehyde 5779-72-6 147 M73
74 39.373 UNK m/z 57-3 57 M74
75 39.624 (3E)-4-methyl-3-hepten-2-one 22319-25-1 111 M75
76 40.570 UNK m/z 95 95 M76
77 40.800 eugenol 97-53-0 164 M77
78 41.337 TRIMCICL 16695-72-0 163 M78
79 41.911 UNK m/z 161 161 M79
80 42.168 β-damascenone 23696-85-7 69 M80
81 42.345 2-methyl-2-octen-4-one 19860-71-0 83 M81
82 42.781 UNK m/z 68 68 M82
83 44.071 verdyl acetate 5413-60-5 66 M83
84 44.360 UNK m/z 147 147 M84
85 44.923 geranyl acetone 689-67-8 43 M85
86 45.297 2,5-ditertbutylbenzoquinone 2460-77-7 177 M86
87 45.379 lilial 80-54-6 189 M87
88 45.684 UNK m/z 131 131 M88
Signal RT Name CAS m/z Code
89 45.847 β-ionone 14901-07-6 177 M89
90 45.960 β-ionone epoxide 23267-57-4 123 M90
91 46.171 2-dodecanone 6175-49-1 85 M91
92 46.284 1-phenyl-1-propanol 93-54-9 107 M92
93 46.299 ar-himachalen-2-ol 119660-66-1 203 M93
94 46.766 propyl salicylate 607-90-9 120 M94
95 46.864 UNK m/z 115 115 M95
96 47.609 isoamyl salicylate 87-20-7 120 M96
97 48.189 pseudoionone 141-10-6 69 M97
98 48.880 β-methylionone 127-43-5 191 M98
99 49.188 benzophenone 119-61-9 182 M99
100 49.418 8-pentadecanone 818-23-5 57 M100
101 50.638 α-hexylcinnamaldehyde 101-86-0 129 M101
std: 2- methylcyclohexanone added as internal standard; signal 25: 2,6,6-trimethoxy-2-vinyltetrahidropyrane; signal 57: 3,6-dimethyl-2,3,3a,4,5,7a-hexahidrobenzofurane; signal 78: (1E)-1-(3,5,5-trimethyl-2-cyclohexen-1-ylidene)-2-propanone; RT: retention time; m/z: quantification ion.
Table 2. Volatile metabolites extracted by HS-SPME-GC-MS (cont.)
HS-SPME-GC-MS tomato VOCs profile
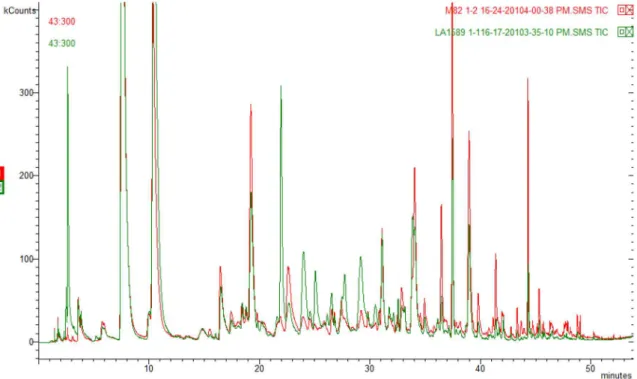
VOCs profiles of different tomato samples obtained with the optimized protocol showed a variable metabolic composition. Figure 3 shows the chromatographic comparison between S. lycopersicum and S. pimpinellifolium
tomato species. As can be seen, there is a noticeable difference on the volatile profile of the analyzed fruits.
Particularly, the wild species (4739), S. pimpinellifolium, showed the highest number of VOCs derived from fatty acids. Among S. lycopersicum varieties, the accessions
565 and 3842 showed the highest contribution of VOCs derived from aromatic amino acid and an equal contribution of VOCs derived from apocarotenoids and fatty acid (see Supplementary Information, Table S8).
Volatile compounds which have not been previously reported in tomato were identified in volatile profiles (see Supplementary Information, Table S8). Novel VOCs associated with the wild species 4739 were cis,cis -1,4-pentadiene, cis-4-pentenal, 2-methyl-3-phenyl-1-propene, 2-methylacetophenone, DMHEX: 3,6-dimethyl-2,3,3a,4,5,7a-hexahidrobenzofurane and
1-phenyl-1-Figure 3. Chromatographic comparison of two tomato species. In gray chromatogram: M82 (No. 4735, S. lycopersicum) and black chromatogram: LA1589 (No. 4739, S. pimpinellifolium).
propanol (Supplementary Information, Table S9).
Other novel compounds were more related to the
S. lycopersicum landraces. For example, geranic oxide and lilial were more expressed in accessions 4750 and 557. By contrast, accessions 565 and 3842 showed higher levels of the novel volatile compounds. They were 3-methylheptyl acetate, duraldehyde, (3E )-4-methyl-3-hepten-3-one, TRIMCICL: (1E )-1-(3,5,5-trimethyl-2-cyclohexen-1-ylidene)-2-propanone, 2-methyl-2-octen-4-one, verdyl acetate, ar-himachalen-2-ol, propyl salicylate, isoamyl salicylate, β-methyl ionone, benzophenone, 8-pentadecanone and α-hexyl cinnamaldehyde (Supplementary Information, Table S9).
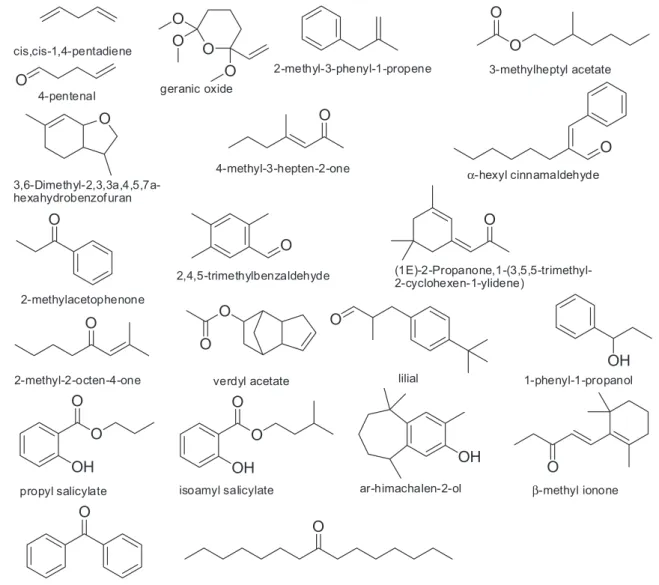
In a few words, 21 novel volatile compounds could be identified in tomatoes analyzed by an exhaustively optimized method of HS-SPME coupled to GC-MS (Figure 4). It should be mentioned that using SPME for extraction of VOCs has many advantages which help to avoid possible derivatization
of VOCs (low temperature, addition of additives) and that the conditions used in the present study were similar to those reported by other authors.5,6,23
Taking into consideration the flavor quality of the Andean landraces, these results provide new VOCs as potential candidates involved in the good flavor perception of tomato fruit. In addition, it is well known that more abundant VOCs no necessarily contribute to the characteristic tomato flavor;24 hence, these new VOCs must be more intensely studied to be considered relevant in the complex chemistry trivia associated with tomato flavor perception.
Chemometric study of Andean tomato VOCs profile
Data obtained from HS-SPME-GC-MS studies were subjected to principal component analysis (PCA) (Figures 5 and 6). PCA is a multivariate statistical technique
O
O O O
O
O
O
O
O O
O
O
O
O O
OH
OH OH
O
O
OH O
O
O
O
O
O
O
cis,cis-1,4-pentadiene
4-pentenal geranic oxide
2-methyl-3-phenyl-1-propene 3-methylheptyl acetate
2-methylacetophenone 3,6-Dimethyl-2,3,3a,4,5,7a-hexahydrobenzof uran
2,4,5-trimethylbenzaldehyde
(1E)-2-Propanone,1-(3,5,5-trimethyl-2-cyclohexen-1-ylidene) 4-methyl-3-hepten-2-one
2-methyl-2-octen-4-one verdyl acetate lilial 1-phenyl-1-propanol
propyl salicylate isoamyl salicylate ar-himachalen-2-ol β-methyl ionone
8-pentadecanone benzophenone
α-hexyl cinnamaldehyde
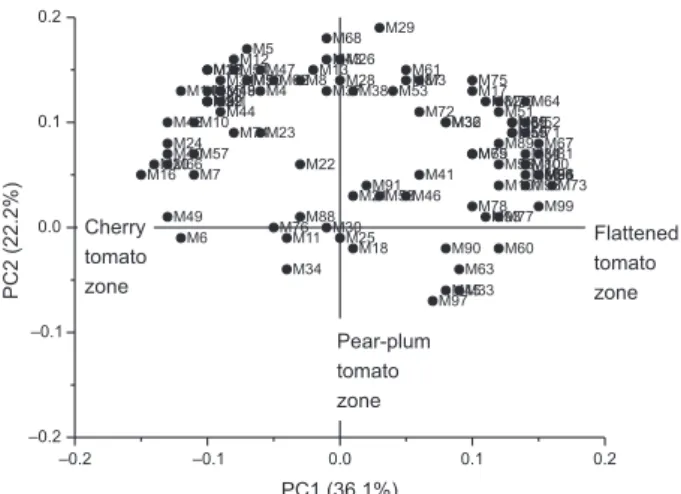
commonly used to provide a better visualisation of a large data matrix, such as VOCs profile.25 In the present study, the PCA permitted to observe relationships and differences between tomatoes. Specifically, the chemometric analysis allowed observing the grouping of three different sets of tomatoes. The wild species (4739) stood separately from all S. lycopersicum varieties. Furthermore, two Andean landraces (4750 and 557) had a closer relation to the cultivable variety, 4735 (M82), while the landraces 3842 and 565 differed from the last group mentioned.
The first two principal components (PC1 and PC2) explain the 59% of total variability, showing a good differentiation between tomato samples (Figure 5). PC1 separates the three main tomato groups in the biplot in accordance with tomato morphology (cherry, plum, flattened). The cherry wild tomato 4739 and cherry Andean landrace 4750 were differentiated from the others groups due to their characteristic volatile profile. Andean tomato landraces 565 and 3842, with large round-flattened and slightly segmented multilocular fruits, were separated from the central group containing the pear tomato landrace 557 and the plum tomato commercial variety 4735, mainly used for processing. In addition, PC2 allowed differentiating the wild red cherry 4739 from the brown-greenish cherry 4750 and the two flattened tomatoes 565 from 3842.
VOCs that most contributed to group separation in PC1 (Figure 6) and were more related to 4739 and 4750 (cherry group) were M16 (heptanal), M20 (UNK m/z 83), M24 (trans-2-heptenal), M40 (cis-linalyl oxide), M42 (trans-linalyl oxide), M49 (α-isoforone), M66 (carvone), M6 (methyl butanoate), M14 (cis-2-hexenal), M10 (4-pentenal), M7 (3-methyl-1-butanol) and M57 (DMHEX: 3,6-dimethyl-2,3,3a,4,5,7a-hexahidrobenzofurane).
The volatile compounds more related with flattened fruit Andean landraces, differing from the commercial tomato 4735, were M67 (2-phenyethyl acetate), M81 (2-methyl-2-octen-4-one), M83 (verdyl acetate), M94 (propyl salicylate), M95 (UNK m/z 115), M96 (isoamyl salicylate), M99 (benzophenone), M73 (duraldehyde), M100 (8-pentadecanone), M98 (β-methyl ionone), M86 (2,5-ditertbutylbenzoquinone), M84 (UNK m/z 147), M80 (β-damascenone), M71 (trans,trans-2,4-decadienal) and M64 (UNK m/z 57-2). As can be seen in the loading weight plot (Figure 6), tomatoes 565 and 4739 showed the presence of more VOCs due to their high concentration on the fruits. Concerning flavor-related volatiles8,9 in the PCA, they were distributed mainly in two areas (cherry tomato and flattened tomato). The central zone (pear-plum tomatoes) contained no VOCs associated with the characteristic flavor of the fruit. However, in this area some landraces of good sensory acceptance were located. This makes us think that other VOCs, different from the characteristic ones, can contribute to a good sensory evaluation of fruit. These results are consistent with the Tiemann’s theory, which suggests that not only the historically accepted flavor-related volatiles contribute to the aroma of tomato.5
The multivariate analysis of VOCs profiles showed the metabolic differences between related tomato species, non-commercial regional accessions and a non-commercial variety of S. lycopersicum. Andean landraces exhibited richer VOCs content and higher amounts of novel compounds than those with the commercial variety (Supplementary Information, Table S10).
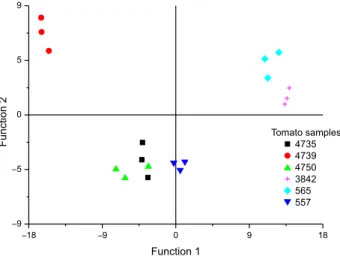
On the other hand, using only the 21 novel VOCs described, discriminant analysis (DA) was performed. The multivariate analysis allowed discriminating and classifying a set of objects based on the significant differences of multiple variables. The results of DA showed a correct
Figure 5. Principal components analysis scores scatter plot of Andean tomato landraces, modern edible cultivar (4735) and S. pimpinellifolium (4739).
classification of the six tomato samples (Figure 7 and see Supplementary Information, Table S10).
The first discriminant function explains the correct grouping of fruits of the same accession. Only the Andean landrace 4750 presented more similarity to the commercial variety 4735. In a similar way to PCA, the grouping of samples on DA maintains the observed relationship to the fruit shape.
Finally, the multivariate classification process presented a satisfactory result based on a few characteristic volatile compounds. The 21 novel VOCs are sufficient to discriminate among the tomato samples.
Conclusion
The results presented here involve the optimization of HS-SPME extraction parameters, GC-MS-EIC quantification and chemometric analysis of VOCs profile of Andean tomato landraces. The study reports 21 new VOCs used to perform a statistical classification of tomato fruits. The valuable metabolic information presented could be used in future studies on the discovery of new enzymatic processes within known biological pathways impacting on tomato flavor.14 Moreover, taking into account that biodiversity is a fundamental requirement to improve the quality of fruits of this important crop, Andean landraces can be an interesting source of genetic variability.26 The results revealed a promising breeding perspective, since the incorporation of Andean accessions could reinforce genetic variability and the incorporation of valuable new compounds that could contribute to improve quality of cultivated tomatoes. Finally, to our knowledge this is the first time that Argentinean tomato landraces are studied
Figure 7. Discriminant analysis scatter plot of four Andean tomato landraces, modern edible cultivar (4735) and S. pimpinellifolium accession (4739).
by their volatile metabolites content and compared with a commercial variety and a wild tomato species.
Supplementary Information
Supplementary data (Tables of optimization of HS-SPME-GC-MS, more details about VOCs quantities in tomato samples) are available free of charge at http://jbcs.sbq.org.br as PDF file.
Acknowledgments
This work was supported in part by CONICET, SECYT and ANPCyT. P. R. C. gratefully acknowledges receipt of a fellowship from CONICET.
References
1. Fukusaki, E.; Kobayashi, A.; J. Biosci. Bioeng. 2005, 100, 347. 2. Yang, C.; Wang, J.; Li, D.; Anal. Chim. Acta 2013, 799, 8. 3. Zhang, Z.; Pawliszyn, J.; Anal. Chem. 1993, 65, 1843.
4. Iijima, Y.; Metabolites 2014, 4, 699.
5. Tikunov, Y.; Lommen, A.; de Vos, C. H. R.; Verhoeven, H. A.; Bino, R. J.; Hall, R. D.; Bovy, A. G.; Plant Physiol. 2005,139, 1125.
6. Figueira, J.; Câmara, H.; Pereira, J.; Câmara, J. S.; Food Chem. 2014, 145, 653.
7. Petro-Turza, M.; Food Rev. Int. 1986, 2, 309.
8. Baldwin, E. A.; Scott, J. W.; Shewmaker, C. K.; Schuch, W.; HortScience 2000, 35, 1013.
9. Goff, S. A.; Klee, H. J.; Science 2006, 311, 815.
10. El Hadi, M.; Zhang, F.-J.; Wu, F.-F.; Zhou, C.-H.; Tao, J.; Molecules 2013, 18, 8200.
11. Asprelli, P. D.; Occhiuto, P. N.; Makuch, M. A.; Lorello, I. M.; Tongo, L. S.; Lampasona, S. C. G.; Peralta, I. E.; Horticultura Argentina 2011, 30, 30.
12. Jordan, J.; Sociol. Ruralis 2007, 47, 20.
13. Watson, B.; Taylor’s Guide to Heirloom Vegetables: A Complete Guide to the Best Historic and Ethnic Varieties, 1st ed.;
Houghton Mifflin: New York, USA, 1996.
14. Klee, H. J.; Tieman, D. M.; Trends Genet. 2013, 29, 257. 15. Di Rienzo, J. A.; Guzmán, A. W.; Casanoves, F. A.; J. Agric.
Biol. Environ. Stat. 2002, 7, 1.
16. Di Rienzo, J. A.; Casanoves, F.; Balzarini, M. G.; Gonzalez, L.; Tablada, M.; Robledo, C. W.; InfoStat versión 2014, Grupo InfoStat, FCA, Universidad Nacional de Córdoba, Argentina, 2014. Available at http://www.infostat.com.ar, accessed in April 2016.
18. Steffen, A.; Pawliszyn, J.; J. Agric. Food Chem. 1996,44, 2187. 19. Guinard, J. X.; Marty, C.; J. Food Sci. 1995, 60, 727; Siefarth,
C.; Tyapkova, O.; Beauchamp, J.; Schweiggert, U.; Buettner, A.; Bader, S.; Food Res. Int. 2011, 44, 3202.
20. Cheong, K. W.; Tan, C. P.; Mirhosseini, H.; Chin, S. T.; Che Man, Y. B.; Hamid, N. S. A.; Osman, A.; Basri, M.; Food Chem. 2011, 125, 1481.
21. Hübschmann, H. J.; Handbook of GC/MS: Fundamentals and Applications, 2nd ed.; Wiley-VCH Verlag GmbH & Co. KGaA:
Weinheim, Germany, 2008.
22. Silva, B. J.; Tranchida, P. Q.; Purcaro, G.; Queiroz, M. E.; Mondello, L.; Lancas, F. M.; J. Chromatogr. A 2012, 1255, 177. 23. Zanor, M. I.; Rambla, J. L.; Chaïb, J.; Steppa, A.; Medina, A.;
Granell, A.; Fernie, A. R.; Causse M.; J. Exp. Bot. 2009, 60, 2139.
24. Tieman, D. M.; Bliss, P.; McIntyre, L. M.; Blandon-Ubeda, A.; Bies, D.; Odabasi, A. Z.; Rodriguez, G. R.; van der Knaap, E.; Taylor, M. G.; Goulet, C.; Mageroy, M. H.; Snyder, D. J.; Colquhoun, T.; Moskowitz, H.; Clark, D. G.; Sims, C.; Bartoshuk, L.; Klee, H. J.; Curr. Biol. 2012, 22, 1035. 25. Socaci, S. A.; Socaciu, C.; Mureşan, C.; Fărcaş, A.; Tofană, M.;
Vicaş, S.; Pintea, A.; Phytochem. Anal. 2014, 25, 161. 26. Corrado, G.; Caramante, M.; Piffanelli, P.; Rao, R.; Sci. Hort.
2014, 168, 138.
Submitted: February 2, 2016