Article
Printed in Brazil - ©2017 Sociedade Brasileira de Química0103 - 5053 $6.00+0.00*e-mail: [email protected], [email protected]
Electrodeposition of Gold Films from a Glycerol Solution on Carbon Paste
Electrode and the Effect of Chemical and Electrochemical Parameters of
Electrodeposition on the Electrode Performance in Potassium Ferrocyanide Solution
Elter G. Gama and Gildiberto M. Oliveira*
Curso de Química, Universidade Federal de Goiás, Regional Jataí, CP 03, 75800-000 Jataí-GO, Brazil
The gold electrodeposition process from a glycerol solution on a carbon paste electrode (CPE) was investigated by voltammetry and the morphologies of the electrodeposits were analyzed by scanning electron microscopy (SEM). Voltammetric study indicated that AuCl4− was reduced to Au0
and the process was mixed controlled (mass transport and electron transfer), preceded probably by AuCl4− decomplexation. Glycerol affected the kinetic of gold electrodeposition in function of the
AuCl4− concentration. SEM images indicated that the gold electrodeposit covered totally some of
the graphite lake by a homogeneous morphology, regardless of the electrodeposition condition. Moreover, using a full factorial planning it was veriied that the deposition charge and potential affected the modiied CPE performance in a potassium ferrocyanide solution, while HAuCl4 and
glycerol concentrations affected only by interactions with the other factors.
Keywords: gold electrodeposition, carbon paste electrode, glycerol, planning factorial, voltammetry
Introduction
Carbon paste is a composite material obtained by mixing graphite powder and a binder (nujol, paraine, etc.).1,2 The carbon paste electrode (CPE) is used in electroanalysis mainly due to the possibility of changing its composition, which can enhance the method sensibility and selectivity.1,2 The modiied CPE can be made by introducing a desired substance (organic,3,4 inorganic,5,6 enzyme,7,8 etc.) into the carbon past or on its surface. The modiication by metals are made mainly by introducing nanoparticles of the metal, dispersed into the binder, produced by an ex situ process.9-16 By electrodeposition also is possible to modify the CPE, producing nanoparticles or thin ilms which cover the graphite lake surface.17-29
The modiied CPE by metallic electrodeposits (gold,17-21 bismuth,22,23 palladium,24-26 antimony,27,28 silver,29 etc.) has been employed at analysis of various analytes, for example: mercury(II) in water;17 dopamine18 and morphine19 in the presence of ascorbic acid and uric acid; morphine in urine;20 methadone in biological luids;21 heavy metals;22,27 nitrobenzene;23 electrooxidation of oxalic acid;24 hydrogen peroxide, dopamine and ascorbic acid;25 electrocatalytic oxidation of formaldehyde;26 indium, thallium and zinc28
and paraquat.29 Although the use of metallic electrodeposit as modifier on the electrodes surfaces has been very studied and some electrochemical parameters (deposition potential and time deposition) of electrodeposition are investigated on the electrode response,22,24 the effect of other electrodeposition parameters are not completely described in these papers, that is, it is not investigated which electrodeposition parameters are main factors or if these factors affect the electrode response by interations.30 In this context, a factorial planning can be used as tool to ind the main factors and its interactions.
The electrodeposition process involves the reduction of metal ion from a solution, which deposit morphology and structure can be influenced by the chemical solution composition and electrochemical parameters of electrodeposition.31,32 In order to enhance the features of the metal electrodeposit morphologies (brightness, roughness, levelness, grain size, etc.), a substance named as additive can be introduced into the electrodeposition solution.31-39 Glycerol has been shown good results for nickel,35 lead,36 zinc,37 copper38 and zinc-nickel39 electrodeposition processes.
transfer rate. The ferri/ferrocyanide redox couple has been chosen to evaluate the performance of CPE because this redox couple has a well known electrochemical behavior, considered as reversible system.40-50 In this reversible system, it is expected to obtain a difference between the anodic and cathodic peak potentials of 60 mV and a ratio of anodic/cathodic peak current equal to 1. In a reversible system, the rate of electron transfer is higher than the mass transport, showing a high exchange current density to the redox couple.51
In the present work, the effect of the glycerol on gold electrodeposition process on the CPE was studied by voltammetry and the morphology of the electrodeposit were analyzed by scanning electron microscopy (SEM). In addition, using a factorial planning, it was investigated the effect of some chemical and electrochemical parameters of electrodeposition on the modiied carbon past electrode features in ferri/ferrocyanide system reversibility.
Experimental
All chemicals were analytical grade. The solutions were prepared with distilled water throughout. The electrochemical experiment was realized in freshly prepared plating solutions containing HAuCl4 (chloroauric acid, Synth) and C3H8O3 (glycerol, Synth) or K4Fe(CN)6 (potassium ferrocyanide, Synth). The NaCl (sodium cloride, Proquimicos) were employed as supporting electrolyte.
UV-Vis spectrums were taken with a PerkinElmer UV-Vis Lambda 35 spectrometer.
The carbon paste (CP) was obtained by mixing graphite powder (Synth, diameter < 50 mm) and mineral oil (Isofar) in a mass ratio of 70:30 in an agate mortar until the paste acquired homogeneous consistency. The electrode was made of a polypropylene syringe (1 mL) with an electrical contact of copper wire.
Electrochemical measurements were recorded with an Ivium Compactstat 800 mA Potentiostat/Galvanostat, using an electrochemical cell with three electrodes. As working, counter and reference electrodes, CPE, platinum wire and Ag/AgCl, KCl 1.0 mol L-1 were employed, respectively.
Scanning electron microscopy (SEM) photographs were taken with a JEOL JSM-IT300LV microscopy. The SEM images were obtained in the backscattered electrons (BSE) mode. To avoid SEM microscopy damage, it was removed the mineral oil from the carbon paste. The samples were prepared cutting off a little piece of the CPE and removing the mineral oil off the carbon paste by successive washing in cyclohexane, ammonium solution (1.4 × 10⁻³ mol L-1) and distilled water. After this, the samples were dried at 80 °C for 4 h.
Results and Discussion
Chemical solution of electrodeposition
The electrodeposition of gold was studied from solutions containing HAuCl4, which forms AuCl4− ions in solution, and glycerol. Glycerol has OH groups that could act as ligand for Au3+ ions. To form a complex with Au3+, the glycerol needs to dislocate the chloride ion of the metal ion AuCl4− at a solution that contains NaCl (0.10 mol L-1), which could be reached in solution with high glycerol concentration. Figure 1 shows the UV-Vis spectrum for the aqueous solution containing HAuCl4:glycerol in the ratios of 1:1, 1:10 and 1:100. It can be seen that the features of the UV-Vis spectrums were similar, showing two peaks (at 224 and 310 nm) related to AuCl4– species. This result indicated that glycerol did not act as ligand for Au3+ in these solutions. In this case, it was investigated the effect of glycerol as additive (brighter, smoothing, etc.) on the gold electrodeposition.31-39
Gold electrodeposition process characterization
Electrochemical studies
Figure 2 (dashed curve) shows typical voltammetric curves for the CPE in HAuCl4 solution. It can be seen in the cathodic sweep that the current increased from potential more negative than +0.700 V, showing a peak at +0.600 V (region named cAu1), while in the anodic sweep the current increased at potentials more positive than +0.600 V, showing a peak at +0.900 V (region named aAu1). Reversing the cathodic sweep at +0.45 V (Figure 2 inset), it was observed a crossover at about +0.600 V, indicating Au deposition by a 3D nucleation process.33,34,52 This result
Figure 1. UV-Vis spectrum for aqueous solution containing
1.4 × 10⁻² mol L-1 NaCl + 1.4 × 10⁻⁴ mol L-1 HAuO
indicated that regions cAu1 and aAu1 probably were related to AuCl4− reduction to Au metallic and Au metallic oxidation to AuCl4−, respectively.
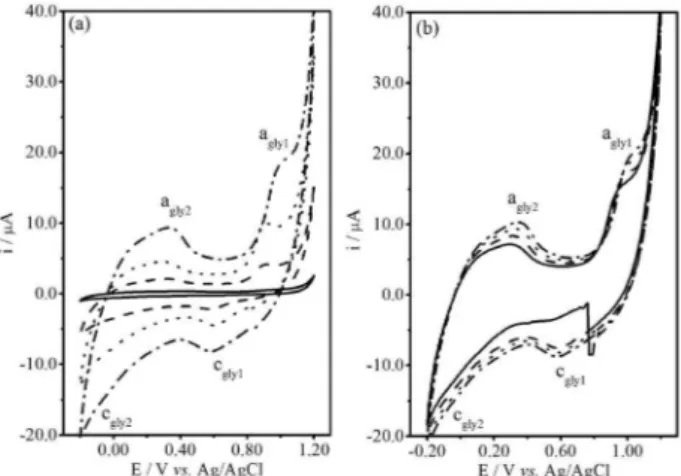
It must be stressed that glycerol could be oxidized,32,33 thus the voltammetric studies were performed with the CPE in 1.0 × 10⁻¹ mol L-1 NaCl solution containing various glycerol concentrations (Figure 3a). Figure 3b shows four successive cycles for the voltammetric curves obtained in 1.0 × 10⁻¹ mol L-1 glycerol. The voltammetric sweep begins at +0.800 V in direction to more negative potential, reversing the cathodic sweep at –0.200 V and the anodic sweep at +1.200 V. These voltammetric curves showed two cathodic (cgly1 and cgly2) and two anodic (agly1 and agly2) regions, which peak currents increased with increasing
glycerol concentration. Regions cgly2 and agly2 probably were due to the hydrogen evolution reaction (HER) and H2 oxidation, respectively. In addition, it can be seen that the HER at cgly2 was depolarized with increasing glycerol concentration. It must be stressed that the cathodic current at +0.600 V (Figure 3b) in the irst cycle (solid line, 3.16 µA) corresponded to about 36-42%, calculated without subtracting a baseline (17-19%, subtracting a baseline), of that in the second (dashed line, 7.52 µA), third (dotted line, 8.15 µA) and fourth (dashed-dotted line, 8.72 µA) cycles. This result indicated that cathodic process at cgly1 depends on the concentration of something that was not present in the irst cycle, that is, the products formed during glycerol oxidation in the region agly1.53,54 This result suggested that glycerol oxidation probably can occur in the anodic sweep in parallel to gold oxidation in solution containing HAuCl4 and glycerol.
Figures 4a and 4b show the voltammetric curves for the CPE in NaCl/HAuCl4 solution containing various glycerol concentrations. It was observed an increase of the cathodic peak current (icp) in function of the glycerol concentration (Figure 4a), showing a peak current at cAugly1 of 72.3 µA (solid line, without glycerol), 82.8 µA (dashed line, 1.0 × 10⁻³ mol L-1 glycerol), 88.2 µA (dotted line, 1.0 × 10⁻² mol L-1 glycerol), 90.6 µA (dashed-dotted line, 1.0 × 10⁻¹ mol L-1 glycerol). These peak currents increases more than the observed in solution containing only glycerol (Figure 3a), that showed peak current at cgly1 of 2.10 µA (dashed line, 1.0 × 10⁻³ mol L-1 glycerol), 4.51 µA (dotted line, 1.0 × 10⁻² mol L-1 glycerol), 8.05 µA (dashed-dotted line, 1.0 × 10⁻¹ mol L-1 glycerol). In addition, it can be seen in Figure 4b that the icp values in the irst (solid line,
Figure 2. Typical voltammetric curves (3rd cycle at 20 mV s-1) for the CPE in 1.0 × 10⁻¹ mol L-1 NaCl solution containing HAuCl
4: (—) 0.0 mol L-1 and (– – –) 1.0 × 10⁻³ mol L-1. Inset: voltammetric curve (1st cycle at 20 mV s-1) with cathodic sweep reversed at +0.45 V. Subscript Au in c
Au and aAu indicate solution containing HAuCl4.
Figure 3. Typical voltammetric curves (at 20 mV s-1) for the CPE in 1.0 × 10⁻¹ mol L-1 NaCl solution containing (a) various glycerol concentrations: (—) 0.0 mol L-1; (– – –) 1.0 × 10⁻³ mol L-1; (• • •) 1.0 × 10⁻² mol L-1 and (– • –) 1.0 × 10⁻¹ mol L-1, 3rd cycle; (b) 1.0 × 10⁻¹ mol L-1 glycerol with four cycle successive: (—) 1st, (– – –) 2nd, (• • •) 3rd and (– • –) 4th. Subscript gly in c
gly and agly indicate solution containing glycerol.
Figure 4. Typical voltammetric curves (at 20 mV s-1) for the CPE in 1.0 × 10⁻¹ mol L-1 NaCl + 1.0 × 10⁻³ mol L-1 HAuCl
4 solution containing: (a) various glycerol concentrations: (—) 0.0 mol L-1, (– – –) 1.0 × 10⁻³ mol L-1, (• • •) 1.0 × 10⁻² mol L-1 and (– • –) 1.0 × 10⁻¹ mol L-1, 3rd cycle; (b) 1.0 × 10⁻¹ mol L-1 glycerol with four cycle successive: (—) 1st; (– – –) 2nd; (• • •) 3rd and (– • –) 4th. Subscript Augly in c
87.1 µA), second (dashed line, 89.4 µA), third (dotted line,
90.6 µA) and fourth (dashed-dotted line, 90.5 µA) cycles were very similar (about 57.9-63.7 µA, obtained subtracting a baseline). This peak current analysis suggested that the icp increases in Figure 4a were not only due to the reduction of glycerol oxidation products (as discussed in Figure 3a) parallel to AuCl4– reduction, but suggested that glycerol affected the kinetic of AuCl4– reduction or modiied the gold deposit morphologies.
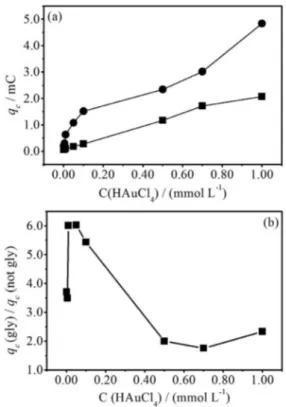
In order to obtain more information about glycerol effects on the gold electrodeposition, a set of voltammetric curves were realized in NaCl 1.0 × 10⁻¹ mol L-1 solution containing various HAuCl4 concentrations, without and with 1.0 × 10⁻³ mol L-1 glycerol (igure not showed here). Figures 5a and 5b show, respectively, the plots of the cathodic charge (qc) and the ratio of qc (solution with/without glycerol) in function of HAuCl4 concentration. The qc was measured subtracting a baseline since the cathodic charge could be inluenced by the hydrogen evolution reaction (HER) at cAugly2 region, which it was more effective in solution containing glycerol. It can be veriied in Figure 5a that qc increased in function of HAuCl4 concentration, showing an almost linear (square) and not linear (circle) relation in solution without and with glycerol, respectively. In other hand, the qc ratio of solution with/without glycerol (Figure 5b) was higher than 1.4, exhibiting a irst increase
(HAuCl4 concentration up to 1.0 × 10⁻⁵ mol L-1), followed by an almost exponential decreases for HAuCl4 concentration higher than 5.0 × 10⁻⁵ mol L-1. This result indicated that the glycerol affected the Au3+ kinetic of reduction and depends on HAuCl4 concentration.
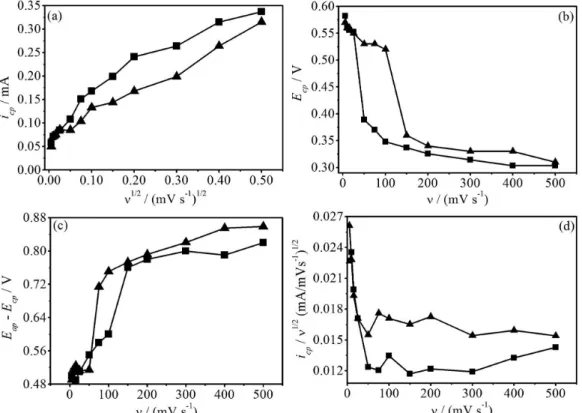
A set of voltammetric curves with various sweep rates (ν)
were obtained in 1.0 × 10⁻¹ mol L-1 NaCl/1.0 × 10-3 mol L-1 HAuCl4 solution, without and with 1.0 × 10⁻³ mol L-1 glycerol (igure not shown here). For these voltammetric curves, were veriied that: icp increased with n1/2, but not linearly (Figure 6a); cathodic peak potential (Ecp) shifted negatively with increasing ν (Figure 6b) and Eap − Ecp
decreased with increasing ν (Figure 6c). This result
suggested that the gold electrodeposition were mixed controlled by mass transport and charge transfer.30,33,34,55 Besides, Figure 6d show that icp/n1/2 decreased in function of
ν, indicating that a chemical reaction preceding the charge
transfer occurred, probably AuCl4− decomplexation.34,55
Scanning electron microscopy analysis of the electrodeposits
SEM images were taken to verify the features of the gold electrodeposit morphologies grown on the graphite lakes. It was investigated three electrodeposition parameters: HAuCl4 concentration (1.0 × 10⁻⁶ and 1.0 × 10⁻⁴ mol L-1), glycerol added (0 and 1.0 × 10⁻³ mol L-1) and deposition charge (1.0 × 10⁻⁶ and 1.0 × 10⁻⁴ C). Figure 7 showed a less magniied SEM image for the graphite powder covered by gold electrodeposits obtained at those conditions. The SEM images were taken at backscattered electrons (BSE) mode, then the white color indicated gold electrodeposits, conirmed by energy-dispersive X-ray spectroscopy (EDS) analysis. This SEM image showed well deined white and black regions, indicating that some graphite lakes were covered and not covered by gold electrodeposit, respectively. It can be supposed that the gold electrodeposition occurred on the graphite lake near the CPE surface/solution interface. The graphite lake not covered by gold is mainly that located into the CPE. Remember that the SEM analysis was made irst cutting off a little piece of the CPE, and after, washing this CP to remove the mineral oil.
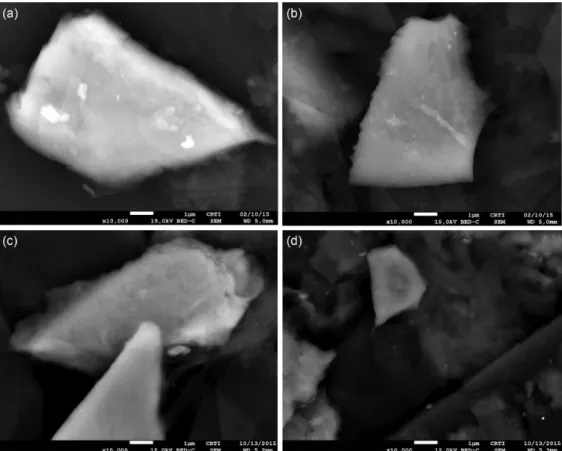
Figures 8a-d show typical SEM images (10,000 times magniication) of the gold electrodeposits obtained from 1.0 × 10⁻¹ mol L-1 NaCl solution containing two HAuCl4 concentration (1.0 × 10⁻⁶ and 1.0 × 10⁻⁴ mol L-1) at two deposition charges (1.0 × 10⁻⁶ and 1.0 × 10⁻⁴ C). It can be seen that the gold electrodeposit covered totally the graphite lake by a homogeneous morphology, regardless of the HAuCl4 concentration and the deposition charge. Similar results were obtained for the gold electrodeposits obtained in glycerol solutions (Figures 9a-d). In addition,
Figure 5. Plot of the (a) qc; (b) ratio of qc (solution with/without glycerol) in function of HAuCl4 concentration for the voltammetric curves obtained in 1.0 × 10⁻¹ mol L-1 NaCl solution containing various HAuCl
from SEM images were observed graphite lakes with diameter smaller than about 50 micrometer, and the thickness was estimated about less than 1 micrometer. As can be seen in Figure 8c, the thickness of the graphite lake covered by gold electrodeposit does not seem to be greater than 1 micrometer. Thus, it can be supposed that the gold electrodeposit was not very thick.
It must be stressed that the SEM analyses were very important to show that the gold electrodeposit covered some graphite lakes with a smoothing deposit, regardless of the chemical and electrochemical condition of electrodeposition. However, despite these similar morphological feature, the CPE performance in ferrocyanide
solution was dependent on the electrochemical deposition condition (conclusion obtained from the factorial design, discussed in Tables 1 and 2).
Gold electrodeposit as modifier on the CPE
In light of the chemical and electrochemical parameters of electrodeposition could affect the gold electrodeposit features and then probably its performance as modiier in the CPE, a voltammetric study was realized in a potassium ferrocyanide solution, analyzing the reversibility of the ferro/ferricyanide system.40-50 In this study was applied a full factorial planning (Table 1) containing two levels for each factors: HAuCl4 concentration, glycerol added, deposition potential and deposition charge. The response analyzed was the ratio of cathodic-anodic peak current (ipa/ipc) and the difference of cathodic-anodic peak potential (∆E) for the voltammetric curves obtained at
20 mV s-1.
Figure 10 shows two voltammetric curves obtained in potassium ferrocyanide solution for the CPE not covered and covered by gold electrodeposit obtained from: HAuCl4 1.0 × 10⁻⁶ mol L-1, glycerol 1.0 × 10⁻³ mol L-1, at +0.200 V and with 1.0 × 10⁻⁴ C (experiment 15, in Table 1). It can be veriied in this case that the gold electrodeposit enhance the ferro/ferricyanide reversibility system, decreasing ∆E (from 0.150 to 0.070 V) and ipa/ipc (from
Figure 6. Plots of (a) icp in function of n1/2; (b) Ecp; (c) Eap − Ecp; (d) icp/n1/2 in function of ν for the voltammetric curves obtained in 1.0 × 10⁻¹ mol L-1 NaCl/1.0 × 10-3 mol L-1 HAuCl
4 solution, () without and () with 1.0 × 10⁻³ mol L-1 glycerol.
Figure 8. SEM micrographs of the gold electrodeposits on the CPE obtained potentiostatically at +0.200 V from 1.0 × 10⁻¹ mol L-1 NaCl solution containing: (a)-(b) 1.0 × 10⁻⁶ mol L-1 HAuCl
4 and (c)-(d) 1.0 × 10⁻⁴ mol L-1 HAuCl4 with (a), (c) 1.0 × 10⁻⁶ C and (b), (d) 1.0 × 10⁻⁴ C.
Figure 9. SEM micrographs of the gold electrodeposits on the CPE obtained potentiostatically at +0.200 V from 1.0 × 10⁻¹ mol L-1 NaCl/1.0 × 10-3 mol L-1 glycerol solution containing: (a)-(b) 1.0 × 10⁻⁶ mol L-1 HAuCl
1.23 to 1.03) and increasing the anodic peak current (about 4.7 times higher).
Table 1 shows the 24 full factorial design and the voltammetric results for ∆E and ipa/ipc. It can be seen that the
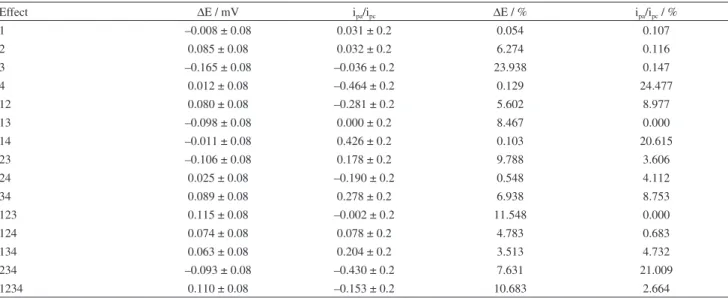
global average responses for ∆E (0.311 ± 0.344) and ipa/ipc (1.50 ± 0.95) showed higher standard deviations (with 95% of conidence in a normal distribution), which indicated that the electrodeposition conditions probably affected the CPE voltammetric response. Table 2 showed the main and interactions effects calculated and their percentage contribution, obtained by Pareto analysis,56 which indicated that for ipa/ipc the main factors were 4 (24.5%), 14 (20.6%) and 234 (21.0%) interactions. In other hand, for ∆E the
main factors were 3 (23.9%), 123 (11.548%) and 1234 (10.683%) interactions. It can be conclude that, in this electrochemical system studied, the deposition charge (factor 4) and deposition potential (factor 3) affected
the modiied CPE performance as main factor, while the solution composition (HAuCl4 and glycerol concentrations) affected only by interactions.
Moreover, it must be stressed that when employing a metallic electrodeposit as modiier, it is recommended to investigate how the chemical and electrochemical of metal
Table 1. 24 full factorial design and the voltammetric results for ∆E and ipa/ipc
Experiment number
Factor Response
1 2 3 4 ∆E / V ipa/ipc
1 –1 –1 –1 –1 0.310 1.92
2 +1 –1 –1 –1 0.470 2.24
3 –1 +1 –1 –1 0.380 2.05
4 +1 +1 –1 –1 0.550 1.35
5 –1 –1 +1 –1 0.230 1.36
6 +1 –1 +1 –1 0.060 0.97
7 –1 +1 +1 –1 0.270 2.40
8 +1 +1 +1 –1 0.120 1.59
9 –1 –1 –1 +1 0.250 0.95
10 +1 –1 –1 +1 0.240 1.25
11 –1 +1 –1 +1 0.530 1.09
12 +1 +1 –1 +1 0.480 1.30
13 –1 –1 +1 +1 0.530 1.09
14 +1 –1 +1 +1 0.100 2.11
15 –1 +1 +1 +1 0.070 1.03
16 +1 +1 +1 +1 0.390 1.34
Average response 0.311 ± 0.344 1.50 ± 0.95
Factor Level
–1 +1
1 2 3 4
[HAuCl4] / (mol L-1) [glycerol] / (mol L-1) deposition potential / V
deposition charge / C
1.0 × 10⁻⁶ 0 +0.600 1.0 × 10⁻⁶
1.0 × 10⁻⁴ 1.0 × 10⁻³ +0.200 1.0 × 10⁻⁴
Figure 10. Typical voltammetric curves of the CPE, covered (solid curve) and not covered (dashed curve) by gold electrodeposits in 1.0 × 10⁻³ mol L-1 K
4Fe(CN)6 + 0.10 mol L-1 NaCl.
Table 2. Main and interactions effects and their percentage contribution obtained by Pareto analysis56
Effect ∆E / mV ipa/ipc ∆E / % ipa/ipc / %
1 –0.008 ± 0.08 0.031 ± 0.2 0.054 0.107
2 0.085 ± 0.08 0.032 ± 0.2 6.274 0.116
3 –0.165 ± 0.08 –0.036 ± 0.2 23.938 0.147
4 0.012 ± 0.08 –0.464 ± 0.2 0.129 24.477
12 0.080 ± 0.08 –0.281 ± 0.2 5.602 8.977
13 –0.098 ± 0.08 0.000 ± 0.2 8.467 0.000
14 –0.011 ± 0.08 0.426 ± 0.2 0.103 20.615
23 –0.106 ± 0.08 0.178 ± 0.2 9.788 3.606
24 0.025 ± 0.08 –0.190 ± 0.2 0.548 4.112
34 0.089 ± 0.08 0.278 ± 0.2 6.938 8.753
123 0.115 ± 0.08 –0.002 ± 0.2 11.548 0.000
124 0.074 ± 0.08 0.078 ± 0.2 4.783 0.683
134 0.063 ± 0.08 0.204 ± 0.2 3.513 4.732
234 –0.093 ± 0.08 –0.430 ± 0.2 7.631 21.009
electrodeposition affect the electrochemical response of the interesting species, to identify if any electrodeposition parameters are main factor. In this case, a factorial planning is an important tool to ind a good compromise in variable selection to obtain the metal electrodeposit and the modiied CPE response to the speciic analyte.
Conclusions
UV-Vis spectrophotometric analysis and voltammetric study indicated that AuCl4− was reducedto Au0 since the initial potentials of reduction and, although glycerol did not complex Au3+, glycerol affected the kinetic of electrodeposition. In addition, the Au electrodeposition was mixed controlled by mass transport and electron transfer, preceded by a chemical reaction, probably AuCl4− decomplexation. SEM images analysis showed that the gold electrodeposit covered totally some of the graphite lake by a homogeneous morphology, regardless of the HAuCl4 concentration, deposition charge and glycerol added. Moreover, the modiied CPE performance in a potassium ferrocyanide solution was inluenced by the chemical and electrochemical parameters of electrodeposition. In this electrochemical system, deposition charge and potential were the main factors, while the solution composition (HAuCl4 and glycerol concentrations) affected only by interactions with the other factors.
Acknowledgments
We would like to thank the Coordenação de Aperfeiçoamento de Pessoal de Nível Superior (CAPES) for their fellowships.
References
1. Svancara, I.; Vytras, K.; Kalcher, K.; Walcarius, A.; Wang, J.;
Electroanalysis2009, 21, 7.
2. Vytras, K.; Svancara, I.; Metelka, R.; J. Serb. Chem. Soc. 2009,
74, 1021.
3. Valery, H. G.; Ngono, T. R.; Saâdane, H.; Ennachete, M.; Khouili, M.; Haid, A.; Benoit, L.; Chtaini, A.; Pharm. Anal. Acta2013, 4, 1.
4. Hu, C.; Wu, K.; Dai, X.; Hu, S.; Talanta2003, 60, 17. 5. Bonifácio, V. G.; Junior, L. H.; Teixeira, M. F. S.;
Fatibello-Filho, O.; Microchem. J.2004, 78, 55.
6. Teixeira, M. F. S.; Ramos, L. A.; Filho, O. F.; Cavalheiro, E. T. G.; Anal. Bioanal. Chem. 2003, 376, 214.
7. Forzani, E. S.; Rivas, G. A.; Solis, V. M.; J. Electroanal. Chem.
1995, 382, 33.
8. Stoces, M.; Kalcher, K.; Svancara, I.; Vytras, K.; Int. J. Electrochem. Sci.2011, 6, 1917.
9. Behpour, M.; Honarmand, E.; Ghoreishi, S. M.; Bull. Korean Chem. Soc.2010, 31, 845.
10. Parvin, M. H.; Golivand, M. B.; Najai, M.; Shariaty, S. M.; J. Electroanal. Chem.2012, 683, 31.
11. Tashkhourian, J.; Nezhad, M. R. H.; Khodavesi, J.; Javadi, S.;
J. Electroanal. Chem.2009, 633, 85.
12. Atta, N. F.; Galal, A.; Azab, S. M.; Analyst2011, 136, 4682. 13. Tsai, T. C.; Huang, F. H.; Chen, J. J. J.; Sens. Actuators, B2013,
181, 179.
14. Arvand, M.; Dehsaraei, M.; Mater. Sci. Eng., C2013, 33, 3474. 15. Gholivand, M. B.; Parvin, M. H.; J. Electroanal. Chem.2011,
660, 163.
16. Wang, C. Y.; Hu, X. Y.; Talanta2005, 67, 625.
17. Svancara, I.; Matousek, M.; Sikora, E.; Shachl, K.; Kalcher, K.; Vytras, K.; Electroanalysis 1997, 9, 827.
18. Atta, N. F.; Galal, A.; Abu-Attia, F. M.; Azab, S. M.; J. Electrochem. Soc.2010, 157, F116.
19. Atta, N. F.; Galal, A.; Azab, S. M.; Analyst2011, 136, 4682. 20. Atta, N. F.; Galal, A.; Azab, S. M.; Int. J. Electrochem. Sci.
2011, 6, 5066.
21. Afkhami, A.; Soltani-felehgari, F.; Madrakian, T.; Talanta2014,
128, 203.
22. Dey, M. K.; Satpatti, A. K.; Sahoo, S.; Kameswaran, R.; Reddy, A. V. R.; Mukherjee, T.; Anal. Methods2011, 3, 2540. 23. Luo, L.; Wang, X.; Ding, Y.; Li, Q.; Jia, J.; Deng, D.; Anal.
Methods 2010, 2, 1095.
24. Shaidarova, L. G.; Chelnokova, I. A.; Gedmina, A. V.; Budnikov, G. K.; Ziganshina, S. A.; Mozhanova, A. A.; Bulkharaev, A. A.;
J. Anal. Chem. 2006, 61, 375.
25. Safavi, A.; Maleki, N.; Tajabadi, F.; Farjami, E.; Electrochem. Commun.2007, 9, 1963.
26. Safavi, A.; Maleki, N.; Farjami, F.; Farjami, E.; J. Electroanal. Chem. 2009, 626, 75.
27. Tesarova, E.; Baldrianova, L.; Hocevar, S. B.; Svancara, I.; Vytras, K.; Ogorev, B.; Electrochim. Acta2009, 54, 1506. 28. Sopha, H.; Baldrianova, L.; Tesarova, E.; Hocevar, S. B.;
Svancara, I.; Ogorev, B.; Vytras, K.; Electrochim. Acta2010,
55, 7929.
29. Farahi, A.; Achak, M.; el Gaini, L.; el Mhammedi, M. A.; Bakasse, M.; J. Food Drug Anal. 2015, 23, 463.
30. Neto, B. B.; Scarminio, I. S.; Bruns, R. E.; Como Fazer Experimentos: Pesquisa e Desenvolvimento na Ciência e na
Indústria, 2a ed.; Campinas Press: Campinas, Brasil, 2002.
31. Brenner A.; Electrodeposition of Alloys: Principles and Practice, vol. I and II; Academic Press: New York, 1963.
32. Paunovic, M.; Schlesinger, M.; Fundamentals of Electrochemical Deposition; John Wiley & Sons: New York, 1998.
33. de Oliveira, G. M.; Silva, M. R.; Carlos, I. A.; J. Mater. Sci.
34. de Oliveira, G. M.; Barbosa, L. L.; Broggi, R. L.; Carlos, I. A.;
J. Electroanal. Chem. 2005, 578, 151.
35. Oliveira, E. M.; Finazzi, G. A.; Carlos, I. A.; Surf. Coat. Technol.
2006, 200, 5978.
36. Carlos, I. A.; Malaquias, M. A.; Oizumi, M. M.; Matsuo, T. T.;
J. Power Sources2001, 92, 56.
37. Fabio, G.; Carlos, I. A.; Met. Finish.1997, 95, 70.
38. de Almeida, M. R. H.; Carlos, I. A.; Barbosa, L. L.; Carlos, R. M.; Lima-Neto, B. S.; Pallone, E. M. J. A.; J. Appl. Electrochem.
2002, 32, 763.
39. Pedroza, G. A. G.; de Souza, C. A. C.; Carlos, I. A.; de Andrade, L. R. P.; Surf. Coat. Technol. 2012, 206, 2927.
40. Miranda-Hernández, M.; Rincón, M. E.; J. Solid State Electrochem.2005, 9, 646.
41. Curull, A.; Valentini, F.; Orlanducci, S.; Terranova, M. L.; Indian J. Chem. 2005, 44A, 956.
42. Zhu, L.; Tian, C.; Zhai, J.; Yang, R.; Sens. Actuators, B2007,
125, 254.
43. Galandova, J.; Trnkova, L.; Mikelova, R.; Labudaa, J.;
Electroanalysis2009, 21, 563.
44. Kalachar, H. C. B.; Arthoba Naik, Y.; Int. J. ChemTech Res.
2011, 3, 1237.
45. Ramalakshmi, N.; Muthukumar, S.; Marichamy, B.; Int. J. Chem. Phys. Sci.2013, 2, 16.
46. Arvand, M.; Dehsaraei, M.; Mater. Sci. Eng., C2013, C33, 3474.
47. Mazloum-Ardakani, M.; Rajabzadeh, N.; Benvidi, A.; Heidari, M. M.; Anal. Biochem.2013, 443, 132.
48. Buoro, R. M.; Bacil, R. P.; da Silva, R. P.; da Silva, L. C. C.; Lima, A. W. O.; Cosentino, I. C.; Serrano, S. H. P.; Electrochim. Acta2013, 96, 191.
49. Zaib, M.; Athar, M. M.; Int. J. Electrochem. Sci. 2015, 10, 6690. 50. Zhang, C.; Zhou, Y.; Tang, L.; Zeng, G.; Zhang, J.; Peng, B.; Xie, X.; Lai, C.; Long, B.; Zhu, J.; Nanomaterials2016, 6, 7. DOI: 10.3390/nano6010007.
51. Bard, A. J.; Faulkner, L. R.; Electrochemical Methods: Fundamentals and Applications, 2nd ed.; John Wiley & Sons:
New York, 2001.
52. Fletcher, S.; Halliday, C. S.; Gates, D.; Westcott, M.; Lwin, T.; Nelson, G.; J. Electroanal. Chem. Interfacial Electrochem.
1983, 159, 267.
53. Carrettin, S.; McMorn, P.; Johnston, P.; Grifin, K.; Kiely, C. J.; Attard, G. A.; Hutchings, G. J.; Top. Catal.2004, 27, 131. 54. Demirel, S.; Lehnert, K.; Lucas, M.; Claus, P.; Appl. Catal., B
2007, 70, 637.
55. Greef, R.; Peat, R.; Peter, L. M.; Pletcher, D.; Robinson, J.;
Instrumental Methods in Eletrochemistry; John Wiley: New
York, 1985.
56. Zaviska, F.; Drogui, P.; Blais, J. F.; Mercier, G.; Lafrance, P.;
J. Hazard. Mater. 2011, 185, 1499.
Submitted: March 22, 2016