Independence of egocentric and exocentric direction
processing in visual space
Elton H. Matsushima¹, Aline M. Vaz¹, Rafael A. Cazuza¹, and Nilton P. Ribeiro Filho²,*
1- Universidade Federal Fluminense, Rio de Janeiro, RJ, Brasil
2- Universidade Federal do Rio de Janeiro, Rio de Janeiro, RJ, Brasil
*In memorian
Abstract
One major issue concerning investigations of visual perception is determination of the geometrical properties of visual space. To address this issue, one must determine the relationships between geometrical features of visual space, distance, direction, angle, and size. Consistent evidence indicates that visual angle is a determinant of perceived exocentric distance. Previous evidence suggests that exocentric distance and direction are hierarchically processed, with distance preceding direction. The present study investigated the relationship between the perceptual processing of egocentric direction and exocentric direction using a task that independently provides both perceptual variables in a single judgment. The results indicated that egocentric directions were systematically overestimated, and this was not caused by either the global shape of the layout or leg length effects. Exocentric directions presented a discontinuous pattern of overestimation of smaller angles that were subtended by radial orientations and accuracy of right angles that were subtended by horizontal orientations. This could be explained by the anisotropy of visual space, a well-established phenomenon from visual space studies. The analysis of the association between the processing of these two variables revealed independence between them in which exocentric direction processing did not depend on the processing of egocentric direction processing, and vice versa. The present results and prior evidence converge on the notion of hierarchical processing in which the visual system processes the egocentric distance of objects followed by exocentric distance processing and subsequent processing. The precise positions of egocentric and exocentric directions in this chain of processing remain to be determined. Keywords: visual space perception, exocentric direction, egocentric direction, angle perception.
Received 10 January 2014; received in revised form 12 November 2014; accepted 12 November 2014. Available online 25 November 2014.
Elton H. Matsushima, Aline M. Vaz, and Rafael A. Cazuza, Department of Psychology, Institute of Psychology, Universidade Federal Fluminense. Nilton P. Ribeiro Filho, Institute of Psychology, Universidade Federal do Rio de Janeiro. Correspondence regarding this article should be directed to: Elton H. Matsushima, Laboratório de Estudos do Comportamento Humano e Animal, Department of Psychology, Institute of Psychology, Universidade Federal Fluminense, Campus do Gragoatá, Rua Professor Marcos Waldemar de Freitas Reis, Blocos O, Sala 230, São Domingos, Niterói, RJ, CEP 24210-201, Brasil. Phone: +55-21-2629-2827. Email: [email protected]
Introduction
One of the major issues in investigations of the visual
perception of space is speciication of the geometrical
properties of visual space (Wagner, 1985; Toye, 1986; Loomis & Philbeck, 1999; Cuijpers, Kappers, & Koenderink, 2002; Koenderink, Van Doorn, & Lappin, 2003; Foley, Ribeiro-Filho, & Da Silva, 2004; Kelly, Loomis, & Beall, 2004; Matsushima, Oliveira, Ribeiro-Filho, & Da Silva, 2005; Aznar-Casanova, Matsushima, Zapata, Ribeiro-Filho, & Da Silva, 2008a; Aznar-Casanova, Matsushima, Da Silva, & Ribeiro-Filho,
2008b). Speciication of the geometrical properties of
visual space implies determination of the relationships
between the geometrical features of visual space such as distance, direction, angle, and size. Studies on judgments of exocentric distance (i.e., the spatial interval subtended by two objects) have generally reported that observers underestimated these distances compared with their physical counterparts, especially when these distances were oriented in depth (e.g., Foley et al., 2004).
Matsushima et al. (2005) investigated verbal reports of exocentric distance and analyzed the role of the observation distance and visual angle subtended by
the exocentric interval. Both factors inluenced distance
judgments independently. A larger observation distance implied foreshortening of the perceived exocentric distance. The visual angle effect was not as straightforward. For visual angles between 0º and 70º, the authors reported that the overestimating of exocentric distances decreased as the visual angles increased. For visual angles between 70º and 90º, observers overestimated the exocentric distance. The authors showed that spatial orientation of
the exocentric interval inluenced the accuracy of the
Recent evidence supports these indings
(Aznar-Casanova et al., 2008a, b) in which relationships between the metric properties of egocentric distance (between observer and object) and exocentric distance
were evaluated, focusing on the potential inluence of
the former geometrical feature over the latter. Aznar-Casanova et al. (2008a) investigated how frames of reference of each geometrical property can provide spatial information for the processing of the other geometrical feature. They suggested that the processing of the spatial orientation of an exocentric interval depends on the prior processing of exocentric distance, which, in turn, depends on the prior processing of egocentric distance. In another study, Aznar-Casanova et al. (2008b) investigated the relationship between the mechanisms of exocentric distance and direction
perception. Their indings suggested that the processing
of exocentric direction depends on the processing of exocentric distance, but the converse was not true. The processing of exocentric distance did not depend on the processing of exocentric direction. They suggested that exocentric distance and direction are hierarchically processed, with distance preceding direction.
Another study utilized a pointing task and found other relationships between exocentric distance and direction (Kelly et al., 2004). The study investigated these relationships under full cue conditions in large-scale environments using a task in which the participants oriented their own bodies to point to
targets in collinearity judgments. More speciically, the
participants had to imagine a line that connected two
stimuli in an open ield. Then they had to turn their
bodies to align their heading to the orientation of that imaginary line. Their results indicated that the observers were accurate in this exocentric direction judgment as measured by an egocentric direction.
The present study sought to determine the relationship between judgments of ego- and exocentric directions in a layout located in near space. One may expect that observers would be accurate in exocentric direction judgments, as reported by Kelly et al. (2004). The judgments were accomplished using a compass with legs that were adjustable in length, which allowed independent judgments of exocentric direction and two egocentric directions. The egocentric directions were in fact an angle judgment, and one may expect that they would present a trend toward overestimation, as previously reported for acute angles such as those subtended by pairs of stimuli in our layout (Henriques, Flanders, & Soechting, 2005; for a brief review, see Nundy, Lotto, Coppola, Shimpi, & Purves, 2000).
Another expected result was independence between perceived egocentric and exocentric directions, in which the processing of exocentric direction depends on the coding of exocentric distance (Aznar-Casanova et al., 2008b). Additionally, one may suppose that exocentric direction is also independent of the processing of egocentric direction, in which the processing of exocentric direction depends on the processing of egocentric distance
but not egocentric direction. This statement was based on the model of perceived exocentric distance proposed by Foley, Ribeiro-Filho, and Da Silva (2001) and Foley et al. (2004). This model established that perceived exocentric distance was determined by the two egocentric distances and visual angle subtended by the exocentric distance.
Methods
Participants
Thirty undergraduate students, aged 18-51 years (mean age, 21.3 years; 12 females and 18 males), with normal or corrected-to-normal visual acuity, were naive to the experimental hypothesis and untrained in the measurement methods. The subjects were divided into two groups (n = 15 per group) for each visual modality: binocular and monocular. The participants provided informed consent before being enrolled in the study.
Experimental environment
The experiments were conducted in a visual alley (1.40 m width × 3.00 m depth) that was surrounded by black curtains and had a red and white checkered table (1.20 m width × 2.00 m depth). The table was located 0.57 m from the observation point, which was located
inside a dark observation cabin with a ixed chin rest and
response platform (0.50 m width × 0.35 m depth). The observation point was 0.10 m above the table surface.
Two central luorescent lamps were positioned just above
the visual alley to illuminate the experimental scene.
Stimuli and apparatus
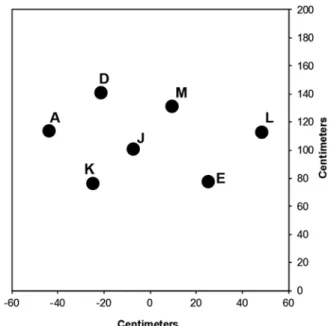
The stimuli were seven blue rubber spheres (5.5 cm diameter) with a white identifying letter (approximately 1.0 cm height × 1.0 cm width) and a red stripe (0.5 cm width) that ran through the fronto-medial meridian. The stimuli were placed on the table as depicted in Figure 1 with the following Cartesian coordinates: E (25.0 cm,
78.0 cm), L (48.2 cm, 113.0 cm), M (9.3 cm, 131.5 cm), J (-7.5 cm, 101.0 cm), K (-25.0 cm, 76.7 cm), A (-44.0 cm, 114.0 cm), and D (-21.5 cm, 141.2 cm).
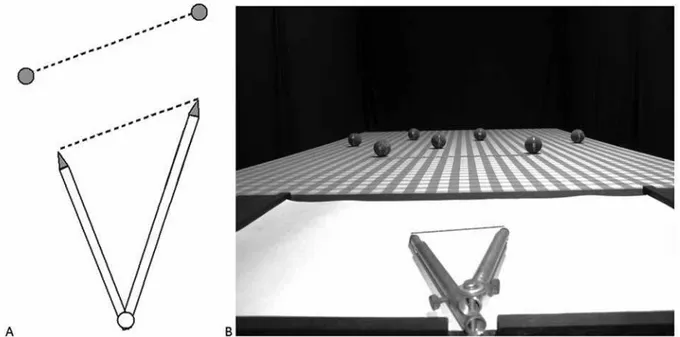
The observers’ responses were made with a compass with two legs that were adjustable in length (minimum length: 16.8 cm; maximum length: 35.0 cm; Figure 2). A
wooden chin rest kept a ixed observation point at a 1.20
m distance from the proximal part of the stimulus layout. A binocular mask occluded the observers’ vision during the measurements, and a monocular mask occluded the non-dominant eye in the monocular visual modality group. Binaural acoustic isolators minimized external noise while preserving the hearing of instructions.
Experimental design
The experiment had a mixed between-groups and within-subjects design, with one between-groups factor (visual modality: binocular and monocular) and one within-subjects factor (three types of spatial orientations of exocentric spatial intervals according to the criteria of Haber, 1985: eight radials that consisted of angles < 40º along the main visual line [median relative to the origin], seven horizontals that consisted of angles > 70º along the main visual line, and six others that consisted of angles between 40º and 70º along the main visual line). For each of these spatial orientations, three measurements were taken: the two produced egocentric directions and the angle of produced exocentric direction.
Procedures
As shown in Figure 2A, the participants were given objective instructions that asked them to adjust the opening of the legs of the compass until each leg pointed
directly to one of the stimuli of the pair indicated by the research assistant. These were the two produced egocentric directions.
Using the mobile part of each leg, the participants then had to adjust the length of the leg until the imaginary line that connected the endpoints of each leg reproduced the orientation of the spatial interval between the pair of stimuli, referred to as the standard exocentric direction (Figure 2A). In the second part of the task, the observers had to adjust the length of the compass legs so that the orientation of the spatial interval between the endpoints of the compass legs (comparison exocentric direction) was parallel to the standard exocentric distance. This psychophysical task can be conceived as the magnitude production of perceived directions.
The participants were comfortably seated in an
adjustable-height chair while keeping their heads ixed
on a chin rest, wearing a binaural acoustic isolator, and occluding their vision with binocular masks during the measurements. The participants in the monocular group additionally wore a monocular mask that occluded their non-dominant eye, determined by a prior dominance
visual ield test, during the entire experimental session.
The research assistant asked the observers to raise the binocular mask and adjust the opening of the compass so that each leg pointed to a stimulus of the indicated pair. The observers then adjusted the length of each leg to match the standard exocentric direction. The participants were free to make corrections in their responses. There was no time constraint on the responses, but the participants took less than 10 s to make their response. The participants made 21 judgments (one for each possible pair: AK, AD, AJ, AM, AE, AL, KD, KJ, KM, KE, KL, DJ, DM, DE, DL, JM, JE, JL, ME,
ML, and EL). Measurements were taken a posteriori using two points marked on a white card (50.4 cm width × 35.0 cm depth) that was placed just below the compass (Figure 2B). These points were perpendicular projections of the endpoints of the compass legs.
Data analysis
The dependent variables that were extracted from the judgments were the two angles of egocentric directions (α’ and β’) and the angle of exocentric direction (θ’), calculated from the Cartesian coordinates. The former was the angle subtended by each compass leg and the normal, and the latter was the smaller angle formed by the spatial interval and its median (Figure 3).
Angles could not be analyzed by traditional statistics (Sá, 2007). Directional data are in interval level of measurement, considering that the position of zero is arbitrary. For example, the arithmetic mean of 10º and 350º is not 180º but rather 0º. These types of analyses are known as Circular Statistics (Berens, 2009; Sá, 2007). The parameters for descriptive statistics are the angular mean and circular standard deviation or angular deviation, as central tendency and variability measures, and the length of mean vector, r, as a measure of the distribution of data, where zero indicates a uniform distribution of vectors through the circumference (Sá, 2007). Another parameter evaluates the distribution of angles through the circumference, the uniformity test of Rayleigh, in which the absence of statistical signiicance yields a uniform distribution of vectors through the circumference (Berens, 2009; Sá, 2007).
For statistical inference, when comparing two means, the Watson-Williams F test for independent samples compares means from two independent samples of angles, and the F test for related samples compares two means that originated from the same sample. For measuring the association between two angular variables, there is the circular correlation (raa). Descriptive and inferential statistics were calculated using BioEstat 5.0 software (Ayres, Ayres, Ayres, & dos Santos, 2007).
Results and discussion
Analysis of egocentric direction
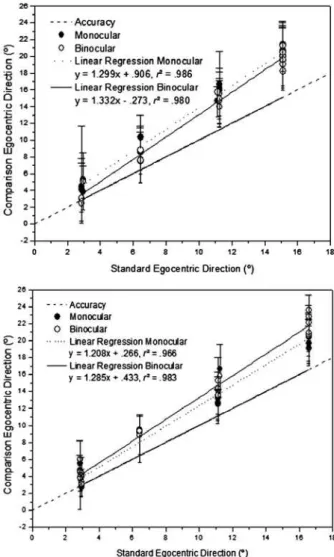
Figure 4 summarizes the comparison egocentric direction angles of each leg as a function of the standard egocentric angles for the binocular and monocular visual modalities. The analysis of angular variability produced
signiicant differences for every combination of main
factors (visual modality and type of spatial interval) and dependent variables (perceived egocentric directions and perceived exocentric directions) in the uniformity test of Rayleigh (p < .01), indicating a central tendency in conditions, thus ruling out the hypothesis of a uniform distribution of angles in our samples.
In both panels of Figure 4, one may observe an apparent pattern of overestimation of perceived
egocentric directions, conirmed by linear regression
Figure 3. Angles extracted from the judgments. Angles a’ andb’ represent the angles of the produced egocentric directions, and angle
q’ represents the angle of the comparison exocentric direction.
Figure 4. Mean angles of comparison egocentric directions as a function of standard egocentric direction, in degrees. The upper panel summarizes the left leg angles. The lower panel summarizes the right leg angles. Filled circles represent monocular group judgments, and empty circles represent binocular group judgments. Vertical bars represent angular deviations and are depicted in a single direction
for better presentation in the igure. Larger caps represent monocular
analyses. The slopes of linear functions that it the
comparison and standard egocentric directions were
reliably larger than the slope of a perfect it (slope = 1),
as produced by a one-sample t-test with 1 as the criterion, for the left leg (mean = 1.330; t29 = 8.209, p < .001) and right leg (mean = 1.238; t29 = 8.209, p < .001). Binocular information, such as binocular disparity and fusional vergence, did not appear to provide any advantage in angular processing. A two-factor ANOVA (two visual modalities and two legs) of the slopes did not reveal
any signiicant differences for either the visual modality
(F1,56 = 1.017, p > .31) or leg (F1,56 = 3.082, p > .08). The overestimation of angles of egocentric directions is related to a previously reported pattern that showed that acute angles (< 90º) are always overestimated and that obtuse angles are always underestimated (Henriques et al., 2005; Nundy et al., 2000). All of the angles of egocentric direction in the present study ranged from 2.86º to 16.57º, which explains the overestimation. This phenomenon is attributable to a statistical approach that is accomplished by the visual system to determine the relationship between a proximal stimulus and its environmental origin. This would be accomplished by the relative frequencies of origins that underlie the retinal projections experienced by the observers during their history of interactions with similar visual scenes. This probabilistic information about the geometrical projection was the basis for the pattern of overestimation of acute angles, underestimation of obtuse angles, and accuracy of right angles (0º, 90º, and 180º; Henriques et al., 2005; Nundy et al., 2000).
Alternative explanations for the pattern would come from two other variables that are known for their effects on angle perception: the global shape of the layout that contains the judged angle (Kennedy,
Orbach & Lofler, 2006, 2008) and the angle-arm
length (Wenderoth & Johnson, 1984). The former effect states that angles of the same magnitude in scalene triangles are perceived as less obtuse than in
isosceles triangles. The latter states that angles with longer arms are perceived as larger than angles of the same magnitude that are formed by smaller arms.
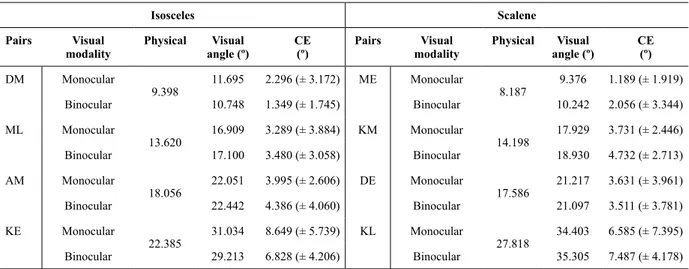
In order to verify whether the global shape of the layout containing the angle affected the angle perception, we compared visual angles of the spatial intervals with similar magnitudes and that formed isosceles and scalene layouts. Although the angle magnitudes were similar, they were not equal. Thus, constant errors were used in the analysis. Judgments in the monocular and binocular groups were collapsed because no reliable differences were found between them (F < 1.0). The pattern of constant errors of angle judgments from scalene layouts did not differ from those of isosceles layouts (F < 1.0; Table 1), mainly in the Constant Errors column (CE). One must conclude that the effect of the global shape of the layout should be restricted to angles in frontoparallel presentations (Kennedy et al., 2006, 2008) and does not affect the perception of angles aligned in depth.
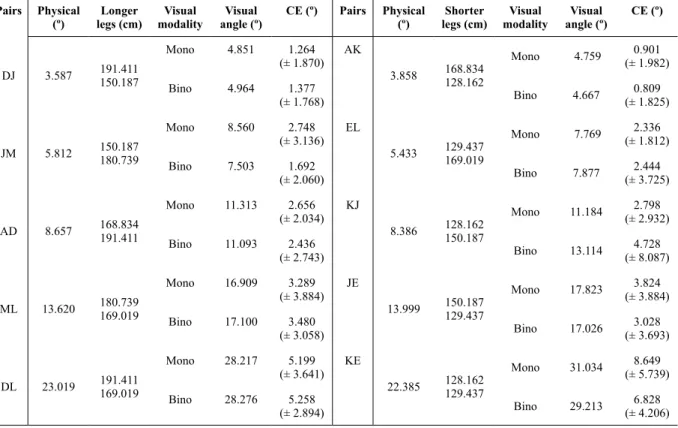
To further evaluate our data to verify the effect of leg length on angle perception (Wenderoth & Johnson, 1984), 10 pairs of stimuli could be matched in pairs according to their angle magnitude in the two groups: one with longer legs and one with shorter legs. The previous study reported that angles that are formed by longer legs are perceived as larger than angles of the same magnitude that are formed by shorter legs. Again, constant errors and judgments in the monocular and binocular groups were collapsed because no reliable differences were found between them (F <
1). Our analysis did not conirm the same effect in our
experimental setting in which the difference between angles that were formed by longer and shorter legs
was not signiicant (F1,150 = 2.317, p > .10). Minimal differences in constant errors demonstrated the absence of a leg-length effect (Table 2). The leg-length effect on angle perception appears to be restricted to angles that are presented in the frontoparallel plane.
Table 1. Mean visual angles of spatial intervals and their constant errors (CE) as a function of stimulus pairs with angles of similar magnitude relative to their physical angles and a classiication of their layouts as isosceles or scalene for both visual modalities.
Isosceles Scalene
Pairs Visual modality
Physical Visual angle (º)
CE (º)
Pairs Visual modality
Physical Visual angle (º)
CE (º)
DM Monocular
9.398
11.695 2.296 (± 3.172) ME Monocular
8.187
9.376 1.189 (± 1.919)
Binocular 10.748 1.349 (± 1.745) Binocular 10.242 2.056 (± 3.344)
ML Monocular
13.620
16.909 3.289 (± 3.884) KM Monocular
14.198
17.929 3.731 (± 2.446)
Binocular 17.100 3.480 (± 3.058) Binocular 18.930 4.732 (± 2.713)
AM Monocular
18.056
22.051 3.995 (± 2.606) DE Monocular
17.586
21.217 3.631 (± 3.961)
Binocular 22.442 4.386 (± 4.060) Binocular 21.097 3.511 (± 3.781)
KE Monocular
22.385
31.034 8.649 (± 5.739) KL Monocular
27.818
34.403 6.585 (± 7.395)
Binocular 29.213 6.828 (± 4.206) Binocular 35.305 7.487 (± 4.178)
One must conclude that the most adequate explanation for the pattern of perceived egocentric directions was the statistical approach of the visual system to determine the origin of visual projections, as stated for natural scene statistics (Howe & Purves, 2005).
Analysis of exocentric direction
Figure 5 summarizes the comparison exocentric direction angles as a function of standard egocentric direction angles for the binocular and monocular visual modalities. Rayleigh tests yielded a non-uniform distribution of angles in the circumference (p < .01). Figure 5 shows a trend from the overestimation of smaller exocentric direction angles toward accuracy for larger angles that were closer to a right angle. This pattern was further investigated by separating the exocentric direction angles as a function of the spatial orientation based on the criteria of Haber (1985).
Inferential statistics conirmed the pattern, with reliable
overestimation of comparison exocentric directions in radial intervals in both the binocular (F1,14 = 31.087, p = .001) and monocular (F1,14 = 9.475, p = .014) groups. Furthermore, accuracy was observed for comparison exocentric directions in horizontal intervals in both the binocular (F1,12 = 3.860, p = .095) and monocular (F1,12 = 5.276, p = .059) groups.
The overestimation of exocentric direction angles at radial intervals is consistent with the anisotropy of perceived visual space, a phenomenon associated with
Table 2. Mean visual angles of spatial intervals and their constant errors (CE) as a function of stimulus pairs with angles of similar magnitude relative to their physical angles and leg length (longer or shorter) for both visual modalities.
Pairs Physical (º)
Longer legs (cm)
Visual modality
Visual angle (º)
CE (º) Pairs Physical (º)
Shorter legs (cm)
Visual modality
Visual angle (º)
CE (º)
DJ 3.587 191.411 150.187
Mono 4.851 1.264 (± 1.870)
AK
3.858 168.834 128.162
Mono 4.759 (± 1.982)0.901
Bino 4.964 1.377
(± 1.768) Bino 4.667
0.809 (± 1.825)
JM 5.812 150.187 180.739
Mono 8.560 2.748 (± 3.136)
EL
5.433 129.437 169.019
Mono 7.769 2.336 (± 1.812)
Bino 7.503 1.692
(± 2.060) Bino 7.877
2.444 (± 3.725)
AD 8.657 168.834 191.411
Mono 11.313 2.656 (± 2.034)
KJ
8.386 128.162 150.187
Mono 11.184 2.798 (± 2.932)
Bino 11.093 2.436
(± 2.743) Bino 13.114
4.728 (± 8.087)
ML 13.620 180.739 169.019
Mono 16.909 3.289 (± 3.884)
JE
13.999 150.187 129.437
Mono 17.823 (± 3.884)3.824
Bino 17.100 3.480
(± 3.058) Bino 17.026
3.028 (± 3.693)
DL 23.019 191.411 169.019
Mono 28.217 5.199 (± 3.641)
KE
22.385 128.162 129.437
Mono 31.034 8.649 (± 5.739)
Bino 28.276 5.258
(± 2.894) Bino 29.213
6.828 (± 4.206)
Note: Values in parentheses represent angular deviations. Mono, monocular; Bino, binocular.
Figure 5. Mean angles of comparison exocentric directions as a function of standard exocentric directions. Filled circles represent binocular group judgments, and empty circles represent monocular group judgments. Vertical bars represent angular deviations and are
depicted in a single direction for better presentation in the igure.
Larger caps represent monocular group angular deviations. The dashed line represents accuracy. The continuous line represents the linear regression of the binocular group. The dotted line represents the linear regression of the monocular group.
Matsushima, De Souza, & Ribeiro-Filho, 1998; Toye, 1986; Wagner, 1985). The overestimation of radial exocentric directions and underestimation of radial exocentric distances could result from the systematic underestimation of egocentric distances of stimuli in a spatial layout and overestimation of visual angles subtended by a spatial interval. These two phenomena compress the spatial layout in its depth dimension and enlarge it in the horizontal dimension, generating effects on the perceived exocentric directions and distances.
Analysis of relationship between egocentric and exocentric direction processing
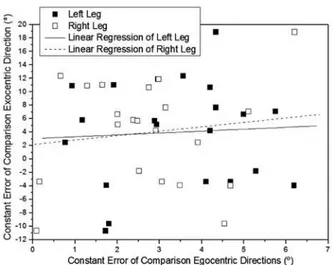
To evaluate the relationships between the perceptual processing of egocentric and exocentric directions, the association between constant errors in egocentric and exocentric directions was analyzed by circular correlation (raa). This analysis was performed using constant errors (comparison magnitude minus standard magnitude) because the magnitudes of the exocentric and egocentric angles were extremely dissimilar. This dissimilarity could lead to bias in correlation analysis. By analyzing the association between their constant errors, one may determine whether the pattern of errors in egocentric processing is tightly associated with the pattern of errors in exocentric processing. Circular correlation analysis did not provide any evidence of an association between these two chains of processing, neither between comparison exocentric directions and left leg comparison egocentric direction (raa19 = .065, p > .779) nor between comparison exocentric directions and right-leg comparison egocentric direction (raa19 = .187, p > .417). Figure 6 shows an almost random distribution of pairs of stimuli as a function of their constant errors of comparison egocentric and exocentric directions.
Coeficients of determination (r²) of linear regressions
of comparison exocentric and egocentric directions did not achieve acceptable values (r² > .750), neither for the left leg (r² < .060) nor for the right leg (r² < .134).
Concluding remarks
The present study investigated the relationship between the perceptual processing of egocentric directions and exocentric directions using a task that independently provided both perceptual variables in a single judgment. Our results indicated that egocentric direction angles were systematically overestimated, and this pattern was not caused by global shape of layout nor by leg length effects, both common perceptual phenomena found in experimental evidence. Exocentric directions presented a discontinuous pattern of the overestimation of smaller angles that were subtended by radial orientations and accuracy of right angles that were subtended by horizontal orientations. This pattern was explained by the anisotropy of visual space, a well-established phenomenon from visual space studies. The analysis of the association between the processing of these two variables revealed independence between them. Thus, exocentric direction processing did not depend on the processing of the egocentric direction, and egocentric direction processing also did not depend on the processing of exocentric direction. This evidence, together with other reports, indicates a hierarchy of processing spatial features in visual geometry. In this hierarchical processing, the visual system processes the egocentric distance of spatial objects followed by exocentric distances and subsequent processing. The precise position of both egocentric and exocentric directions in the processing chain remains to be determined, but both spatial variables are processed independently from each other.
Our results also provide evidence of the consistency of the oblique effect (Appele, 1972; Aznar-Casanova, Torrents & Torro-Alves, 2008), which states that the visual system has better resolution of angles that are aligned in the Cardinal axis (i.e., 0º, 90º, 180º) as opposed to oblique angles. This recurrent pattern would increase variability for oblique angles and decrease variability for right angles. Despite the fact that most evidence of an oblique effect was produced for angles that were presented in the frontoparallel plane, the judgments of exocentric direction angles that were aligned in depth showed an oblique effect pattern in which variability increased as the magnitude of the angles differed from 90º, with lower angular deviations for 90.0º and 88.5º.
References
Appelle, S. (1972). Perception and discrimination as a function of orientation: the “oblique effect” in man and animals. Psychological Bulletin, 78, 266-278.
Ayres, M., Ayres, M., Jr., Ayres, D. L., & dos Santos, A. A. S. (2007).
BioEstat, versão 5.0. Belém: Sociedade Civil Mamirauá, MCT - CNPq.
Aznar-Casanova, J. A., Matsushima, E. H., Zapata, L. P., Ribeiro-Filho, N. P., & Da Silva, J. A. (2008a). Interaction between egocentric and exocentric frames of reference assessed by perceptual constancy parameters. Cognitive Studies, 15, 22-37.
Aznar-Casanova, J. A., Matsushima, E. H., Da Silva, J. A., & Ribeiro-Filho, N. P. (2008b). Can exocentric direction be dissociated from its exocentric distance in virtual environments? Perception and Psychophysics, 70, 541-550.
Aznar-Casanova, J. A., Torrents, A., & Alves, N. T. (2008). The role of vertical disparities in the oblique effect. Psychology & Neuroscience, 1(2), 167-175.
Berens, P. (2009). CircStat: a MATLAB toolbox for circular statistics.
Journal of Statistical Software, 31(10), 1-21.
Beusmans, J. M. H. (1998). Optic low and the metric of visual ground
plane. Vision Research, 38(8), 1153-1170.
Cuijpers, R. H., Kappers, A. M. L., & Koenderink, J. J. (2002). Visual perception of collinearity. Perception and Psychophysics, 64, 392-404.
Foley, J. M. (1968). Depth, size and distance in stereoscopic vision.
Perception and Psychophysics, 3, 265-274.
Foley, J. M., Ribeiro-Filho, N. P., & Da Silva, J. A. (2001). Visual localization and the metric of visual space in multi-cue conditions.
Investigative Ophthalmology and Visual Science, 42(4 Suppl.), 5032. Foley, J. M., Ribeiro, N. P., & Da Silva, J. A. (2004). Visual perception of extent and the geometry of visual space. Vision Research, 44(2), 147-156.
Haber, R. N. (1985). Toward a theory of the perceived spatial layout of scenes. Computer Vision, Graphics, and Image Processing, 31(3), 282-321.
Henriques, D. Y. P., Flanders, M., & Soechting, J. F. (2005). Distortions in the visual perception of shape. Experimental Brain Research, 160, 384-393.
Kelly, J. W., Loomis, J. M., & Beall, A. C. (2004). Judgments of exocentric direction in a large-scale space. Perception, 33, 443-454.
Kennedy, G. J., Orbach, H. S., & Lofler, G. (2006). Effects of global
shape on angle discrimination. Vision Research, 46, 1530-1539.
Kennedy, G. J., Orbach, H. S., & Lofler, G. (2008). Global shape versus
local feature: an angle illusion. Vision Research, 48,1281-1289. Koenderink, J. J., van Doorn, A. J., & Lappin, J. S. (2003). Exocentric
pointing to opposite targets. Acta Psychologica, 112, 71-87. Levin, C. A., & Haber, R. N. (1993). Visual angle as a determinant
of perceived interobject distance. Perception and Psychophysics,
54(2), 250-259.
Loomis, J. M., da Silva, J. A., Fujita, N., & Fukusima, S. S. (1992). Visual space perception and visually directed action. Journal of
Experimental Psychology: Human Perception and Performance,
18, 906-921.
Loomis, J. M., & Philbeck, J. W. (1999). Is the anisotropy of perceived 3-D shape invariant across scale? Perception and Psychophysics,
61, 397-402.
Matsushima, E. H. (2003). Anisotropia do espaço percebido e
paralaxe de movimento: uma análise da orientação espacial.
Tese de Doutorado, Faculdade de Filosoia, Ciências e Letras de
Ribeirão Preto, Universidade de São Paulo. Ribeirão Preto, SP, Brasil.
Matsushima, E. H., de Oliveira, A. P., Ribeiro-Filho, N. P., & Da Silva, J. A. (2005) Visual angle as determinant factor for relative distance perception. Psicológica, 26, 97-104.
Norman, J. F., Todd, J. T., Perotti, V. J., & Tittle, J. S. (1996). The visual perception of three-dimensional length. Journal of Experimental
Psychology: Human Perception and Performance, 22, 173-186.
Nundy, S., Lotto, B., Coppola, D., Shimpi, A., & Purves, D. (2000). Why are angles misperceived? Proceedings of the National
Academy of Sciences of the United States of America, 97(10),
5592-5597.
Howe, C. Q., & Purves, D. (2005). Perceiving geometry: geometrical illusions explained by natural scene statistics. New York: Springer. Ribeiro-Filho, N. P. (1993). Percepção de conigurações espaciais
de estímulos em grande campo aberto. Tese de doutorado não
publicada, Faculdade de Filosoia Ciências e Letras de Ribeirão
Preto, Universidade de São Paulo, Brasil.
Roure, A. G., Matsushima, E. H., De Souza, C. A. A., & Ribeiro-Filho, N. P. (1998). Há um espaço real dentro do espaço visual?
Arquivos Brasileiros de Psicologia, 50(1/2), 52-62.
Sá, J. P. M. (2007). Applied statistics: using SPSS, STATISTICA,
MATLAB, and R. New York: Springer-Verlag.
Toye, R. C. (1986). The effect of viewing position on the perceived layout of space. Perception and Psychophysics, 40, 85-92. Wagner, M. (1985). The metric of visual space. Perception and
Psychophysics, 38, 483-495.
Wenderoth, P., & Johnson, M. (1984). The effects of angle-arm length on judgments of angle magnitude and orientation contrast.