Printed in Brazil - ©2003 Sociedade Brasileira de Química 0103 - 5053 $6.00+0.00
A
r
ti
c
le
* e-mail: [email protected]
Vermicompost as a Natural Adsorbent Material: Characterization and Potentialities for
Cadmium Adsorption
Madson G. Pereira and Marco A. Z. Arruda*
Instituto de Química, Universidade Estadual de Campinas, CP 6154, 13084-971 Campinas - SP, Brazil
Amostras de vermicomposto (material húmico) foram submetidas à caracterização por espectroscopia de infravermelho, difractometria de raios-X, termogravimetria, microscopia eletrônica, entre outras; adicionalmente, foi determinada a capacidade de troca catiônica (CTC). Empregou-se planejamento fatorial para estudar os mecanismos de interação da espécie Cd2+ com os sítios adsortivos
do vermicomposto e, posteriormente, foi avaliada a máxima capacidade adsortiva de cádmio empregando isoterma de Langmuir. A caracterização revelou que o vermicomposto exibe CTC tão elevada quanto 72,9 meq por 100 g, grande área superficial (substância porosa), grupos quelantes e máxima capacidade adsortiva para Cd (38,6 mg g-1) em pH 5,0. Esta potencialidade foi explorada em
análises de amostras sintéticas e reais (água mineral) apresentando concentrações de cádmio próximas a 5 µg L-1 e requerendo etapas de pré-concentração. Um fator de enriquecimento de 100 foi obtido.
Vermicompost (humic material) samples were submitted to characterization by infrared spectroscopy, X-ray diffractometry, thermogravimetric analysis, electron microscopy etc. In addition, its cation exchange capacity (CEC) was determined. Factorial experiments were designed in order to elucidate the interaction mechanisms between Cd2+ and the adsorptive sites of vermicompost. The maximum
adsorptive capacity for cadmium was evaluated by a Langmuir isotherm. The characterization revealed that vermicompost exhibits high CEC values (ca. 72.9 meq per 100 g), high surface area (porous material), chelating groups and a maximum adsorptive capacity for Cd (38.6 mg g-1) at pH 5.0. This
potential application was exploited in the analysis of synthetic and real (mineral water) samples with Cd concentrations of ca 5 µg L-1, requiring a preconcentration step. An enrichment factor of 100 was
attained.
Keywords: vermicompost, characterization, cadmium adsorption
Introduction
Humic substances comprise a number of organic compounds with complex molecular structure (aromatic rings, carbonyl groups, phenolic and alcoholic hydroxyl, among others). These substances are formed by chemical and microbial decomposition of animal and plant
materials.1 The humification process occurs naturally in
different environments such as soils, sediments, aquatic ecosystems (oceans, rivers and lakes) as well as in the upper
plants.2 It should be noted that humification depends on
several parameters, such as acidity, microbial population, nutrient concentrations, aeration and temperature.3
Due to its structural complexity, it is difficult to establish a classification of the humic substances and acceptable classification criteria are usually based on
solubility properties. Thus, humic acids precipitate in acidic medium, humines are insoluble under both acidic and alkaline conditions and fulvic acids are soluble under both these conditions.4
Degradation of organic residues is usually a slow process, however other humification mechanisms may speed up it. Composting is frequently exploited, when conversion of fresh organic matter to substrates with a high degree of degradation is accomplished in a relatively short (usually a few months) period of time.1 During composting,
the organic substrates are decomposed by microorganisms
and the main products are CO2, H2O, mineral ions and
stabilized organic matter.3
organic species (proteins, nucleic acids, fats, carbo-hydrates) into a more stable product (vermicompost). This product presents a high CEC, high humidity content, wide particle size distribution, high concentration of nutrients (Ca, Mg, Na, K, P, S, N) and a characteristic black colour
due to the presence of humic substances.1,2
Despite the high CEC values, there are only a few studies about the characterization of vermicompost and about its application as a metal adsorbent. Thus, a characterization was performed to elucidate the interaction mechanisms between cadmium and vermicompost. After the characterization, the potentiality of cadmium adsorption was confirmed by carrying out analyses of Cd requiring a preconcentration step.
Experimental
Instruments and apparatus
For vermicompost characterization, a Shimadzu XRD 6000 X-ray diffractometer (Kyoto, Japan), a Perkin-Elmer FT-IR 1605 infrared spectrometer (Überlingen, Germany), a Perkin-Elmer PE 2400 elemental analyzer (Norwalk, USA), a TA Instruments TGA 2950 thermogravimetric analyzer (New Castle, USA) and a JEOL JMT-300 electron microscope (Tokyo, Japan) were used.
In order to establish the total cadmium concentration, as well as the extractable calcium and magnesium in the vermicompost, a Perkin-Elmer AAnalyst 300 flame atomic absorption spectrometer (Norwalk, USA), equipped with a deuterium lamp background correction system, was used. This instrument was also used for Cd determinations in the experiments involving factorial design and Langmuir isotherm. In addition, the instrument was used in the emission mode for the determination of extractable sodium and potassium in vermicompost, as well as potassium in mineral water samples.
In the preconcentration experiments, a Perkin-Elmer Analyst 600 graphite furnace atomic absorption spectrometer (Überlingen, Germany), equipped with a Zeeman-effect background correction system, was used to determine the cadmium content in synthetic aqueous solutions and in mineral water samples (after the enrichment process). The operating conditions were those recommended by the manufacturer for maximum sensitivity.
Hollow cathode lamps were employed as the radiation
source for calcium (λ = 422.7 nm) and magnesium (λ =
285.2 nm) determinations, whereas an electrodeless
discharge lamp was used for cadmium (λ = 228.8 nm).
Decomposition of the vermicompost was carried out using a QCI QW-3000 microwave oven (Mississauga,
Canada), equipped with temperature and pressure sensors and with a magnetron of 2450 ± 13 MHz.
For pH measurements, a Digimed DM20 pH-meter (São Paulo, Brazil) was used.
Ultra-pure nitric acid employed in preconcentration procedures was obtained using a quartz sub-boiling still (Marconi, Piracicaba, Brazil).
A 3.4 x 25 cm glass column was employed in the preconcentration experiments.
Standards, reagents and samples
All solutions were prepared with analytical reagent-grade chemicals (Merck, Darmstadt, Germany) and distilled/deionised water (Millipore, Mosheim, France).
For adsorption experiments, a 1000 mg L-1 Cd reference
stock solution (in 1.6 mol L-1 HNO
3) based on CdCl2.H2O
was prepared. Working reference solutions (for FAAS
calibrating purposes) with 0.5 – 2.0 mg L-1 Cd were
prepared daily by serial dilutions of the reference solution
with 0.014 mol L-1 HNO
3.
Calcium, magnesium, sodium and potassium
single-analyte stock reference solutions (1000 mg L-1) were
prepared using Ca(NO3)2.4H2O, Mg(NO3)2.6H2O, NaCl and KNO3, respectively. Working reference solutions with 1.0 – 5.0 mg L-1 Ca, 0.1 – 0.5 mg L-1 Mg and 1.0 – 10.0 mg L-1
Na or K were prepared daily by serial dilutions with 0.014 mol L-1 HNO
3.
Vermicompost samples were obtained from different regions of Minas Gerais and São Paulo States (Brazil). Two samples were collected in Tabuleiro do Pomba (MH) and Coimbra (SM), Minas Gerais. Sample XA was collected in Campinas, São Paulo.
For all experiments, except for those involving humidity evaluation, the vermicompost samples were dried in an oven (60 °C) for 24 h and the analyses were performed using particle sizes ranging from 75 to 150 µm.
For extractable calcium and magnesium determina-tions, a 10% (w/v) La2O3 solution was used as releasing agent.
Procedure
Thereafter, the XA sample was chosen for the experiments focusing on adsorption studies for Cd (factorial design, Langmuir isotherm and preconcentration). All experiments were made in triplicate, except those involving thermo-gravimetric analysis.
Humidity
The water content was determined by difference of vermicompost masses before and after submitting 10.0 g of fresh sample to 60 °C for 24 h.
Ash and total organic matter content
The ash and total organic matter content were obtained by heating the vermicompost samples from 20 to 980 °C (10 °C min-1 heating rate), respectively.
Infrared spectroscopy, X-ray diffraction, elemental composition and electron microscopy
The functional groups present in the vermicompost were characterized by Fourier-transform IR spectroscopy, using KBr discs to prepare the vermicompost samples. The spectral range varied from 4000 to 400 cm-1.
For ray diffraction, the samples were exposed to X-rays (λ = 1.54060 Å) with the 2θ angle varying within 5 and 50°. The applied voltage and current were 40 kV and 30 mA, respectively.
Carbon, nitrogen and hydrogen determinations used an elemental analyzer while for electron microscopy, vermicompost samples were covered with a thin layer of gold and an electron acceleration voltage of 20 kV was applied.
pH measurement
The procedures described in this section as well as those indicated in several subsequent sections were adopted or modified from Pace et al.5
For pH determination, 10.0 g of the vermicompost were shaken with 25 mL of a 1.0 mol L-1 KCl solution for 1 min.
The samples were then allowed to rest for 1.0 h. Afterthat, the samples were shaken during 1.0 min and the pH of the resulting suspension was potentiometrically determined.
Exchangeable Ca, Mg, Na and K5
The vermicompost (3.0 g) was shaken for 1.0 h with 75 mL of a 1.0 mol L-1 KCl solution for Ca and Mg extraction
or with 75 mL of 0.05 mol L-1 HCl for Na and K extraction.
After shaking, a period of 16 h for sedimentation was
needed to complete both extractions. Ca and Mg concentrations in the liquid phase were then determined by FAAS. For exchangeable Na and K, the FAAS spectrometer was operated in the emission mode.
Exchangeable or potential acidity5
The species related to exchangeable or potential acidity were extracted by shaking 3.0 g of vermicompost
with 75 mL of either a 1.0 mol L-1 KCl solution (for
exchangeable acidity studies), or an acetate buffer solution, pH 7 (potential acidity studies), for 1 h. Thereafter, a period of 16 h for sedimentation was needed. In the experiments related to exchangeable acidity, 25 mL of the supernatant
were selected and titrated with a 0.025 mol L-1 NaOH
solution; bromothymol blue was used as indicator. For potential acidity evaluation, with the same titrant, the end point was determined using phenolphthalein.
Effective and potential CEC5
The effective CEC value (CECeff) was calculated as
the sum of the exchangeable acidity plus the exchangeable Ca, Mg, K, and Na contents. In addition, the potential
CEC value (CECpot) was calculated as the sum of the
exchangeable Ca, Mg, K, and Na contents plus the results obtained for potential acidity.
Total Cd content
In this experiment 600 mg of vermicompost samples were decomposed through an acidic microwave-assisted
decomposition procedure6 using concentrated HCl, HNO
3
and HF acids (3:1:2 volumetric ratio, 15 mL total volume). After that, the digests were dried almost to dryness and the
volume made up to 25 mL with 0.014 mol L-1 HNO
3. For HF
elimination, ca. 300 mg H3BO3 were added to the samples. After sample decomposition, cadmium concentrations were determined by FAAS.
Factorial design for cadmium adsorption
These experiments were carried out for optimizing the pH and the shaking time interval for cadmium adsorption
by the vermicompost. A factorial design7 was chosen
For factorial design, a 60 mg L-1 cadmium solution was
prepared from the 1000 mg L-1 stock reference cadmium
solution. The pH of these solutions were adjusted at 2.0, 4.0 or 6.0 by adding 0.1 mol L-1 HNO
3 or NaOH whenever
necessary. The shaking times (5.0, 32.5 or 60 min) were tested for each pH condition. According to the factorial
design employed (32), nine combinations were made (Table
1). Twenty-seven assays were carried out (3 replicates for each combination). According to adaptations from Slavek
et al.,8for each assay, 20 mg of vermicompost were shaken
by a magnetic stirrer with 40 mL of 60 mg L-1 cadmium
solution. After this step, the samples were centrifuged at 3000 rpm for 20 min. Suitable liquid phase volumes (according to the required dilution) were transferred to 25 mL volumetric flasks and the volume was completed
with 0.014 mol L-1 HNO
3 solution. The cadmium
concentrations were determined by FAAS.
Langmuir isotherm for cadmium
Cadmium saturation in the vermicompost was established by a Langmuir isotherm. To this end, 40 mg of vermicompost were mixed with 40 mL of different cadmium
solutions (10, 50, 200, 600, 800, and 1000 mg L-1). The
acidity and shaking time were defined as pH 5.0 and 5.0 min, respectively, from experiments performed in the Factorial design section. After shaking, samples were centrifuged at 3000 rpm for 20 min and suitable supernatant volumes were transferred to 50 mL volumetric flasks and
diluted with 0.014 mol L-1 HNO
3 solution. Cadmium
concentrations were determined for these solutions.
Cadmium preconcentration in vermicompost columns
This experiment was made by passing 1000 mL of synthetic or real samples (10 mL min-1) at pH 5.0 through the
vermicompost columns. For the synthetic aqueous sample (5.0 µg Cd L-1), 60 mg vermicompost were used whereas for
the real sample (mineral water spiked with cadmium up to 5.0
µg L-1), 120 mg of vermicompost were needed. The mineral
water employed in this experiment (Genuína brand, Lindóia SP, Brazil) was obtained at a local market.
After preconcentration, the cadmium retained was
desorbed by adding 10 mL of a 1.0 mol L-1 HNO
3 solution.
In the elution step, the flow-rate was maintained at 10 mL
min-1. Cadmium in the eluent solutions was determined
by FAAS.
After preparing synthetic samples and enriched mineral water, the cadmium concentration in these samples was also measured by graphite furnace atomic absorption spectrometry (GFAAS).
Results and Discussion
The X-ray diffractograms (Figures 1a-c) revealed the
presence of SiO2 in the vermicomposts. This mineral was
predominant in this material, whereas other minerals occurred only at trace levels, thus making identification difficult. It should be emphasized that other peaks were also associated to SiO2 but with different inter-planar distances. The material in Figure 1b presents an amorphous charac-teristic. The main peak of SiO2 is shown in Figures 1 a-c.
The initial thermal decompositions of organic matter (see thermogravimetric curves, Figures 2a-c) were similar for the different samples: 245 °C (MH), 239 °C (SM) and 243 °C (XA). Otherwise, the final decomposition temperature of organic matter, presented a pronounced difference between XA and the other vermicomposts: 500 °C (MH), 479 °C (SM) and 645 °C (XA), indicating a possible differentiation in the structure of the organic matter in these samples.
The results for total organic matter (TOM) were established by considering the differences of the masses at the initial and final decomposition temperatures. The
results obtained matched the literature information.9,10
According to these literature, samples collected in Juiz de Fora and São Carlos, presented results of TOM as 47.7 and
31.5 % m/m,respectively. Results for humidity, ash, total
organic matter and elemental composition of vermicompost samples are presented in Table 2.
According to the literature,9 similar values for ash
contents were observed for bovine manure vermicompost. The ash content for the sample collected in Juiz de Fora was 47.3 % m/m. This value reveals the complexity of the raw material employed in vermicompost production.
Products obtained by the vermicomposting process present high humidity levels.1 In this way, results obtained
in the humidity tests (from 56.2 to 59.8 %) are in agreement with this affirmation.
Table 1. Combinations used in the factorial design (32) for Cd
adsorption studies in vermicomposta
Combination pH Shaking time
1 - 1 - 1
2 0 - 1
3 1 - 1
4 - 1 0
5 0 0
6 1 0
7 - 1 1
8 0 1
9 1 1
aNumbers –1, 0 and 1 correspond to pH levels of 2, 4, 6 and
Figure 1. X-ray diffractograms of (a) MH, (b) SM and (c) XA vermicompost samples. For details, see text.
Figure 2. Thermogravimetric graphics of (a) MH, (b) SM and (c) XA vermicompost samples.
Table 2. Humidity, ash, total organic matter (TOM) and elemental composition (C, N and H); n = 3. For sample identification, see text
Sample Humidity (%) Asha (%) TOMa (%) C (%) N (%) H (%)
MH 59.8 ± 0.3 53.7 41.2 17.1 ± 0.1 2.0 ± 0.1 3.0 ± 0.1
SM 56.2 ± 0.1 41.1 53.5 33.2 ± 1.0 2.3 ± 0.1 5.0 ± 0.2
XA 57.9 ± 1.3 68.8 27.0 10.4 ± 0.2 0.7 ± 0.1 1.8 ± 0.1
For all vermicompost samples, the potential acidity results were higher than those related to exchangeable acidity (Table 3). This can be explained in view of the organic matter present in vermicompost, whereas at pH 7 (the best pH for potential acidity), several acidic groups of organic matter are dissociated and the titrated acidity
comprises the sum of exchangeable acidity (due to Al3+
hydrolysis) plus the hydrogen concentration originating from organic matter dissociation. This is an interesting behavior related to the adsorption phenomena of metallic species at higher pH values.
The exchangeable cation values (Table 4) reveal the differences among the three investigated vermicompost samples, which are probably due to the origin of these samples.
The vermicompost samples presented CEC values higher than those related to soil materials (Table 5). This can be confirmed comparing CEC results (from 45.6 to 72.9 meq per 100 g) with those already obtained (24.1 meq per 100 g) from Philippine agricultural soils.11 It is
important to stress that higher CEC values of vermicompost correspond to a higher capacity to retain metals by adsorption processes. In this way, the XA vermicompost was selected for the adsorption experiments due to the highest CEC values obtained (Table 5).
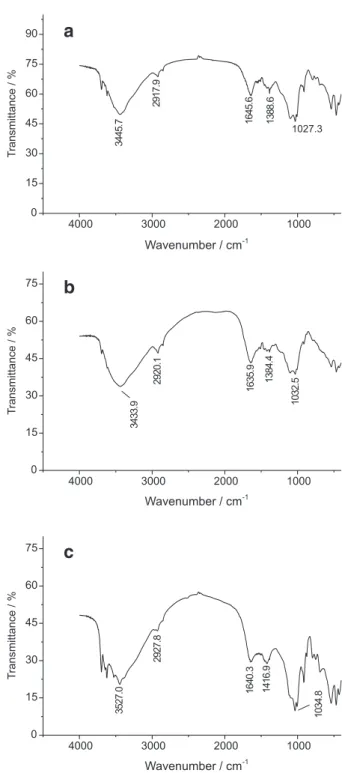
The infrared spectra (Figures 3a-c) reveal the presence of groups associated with organic matter, which can be considered as potential sites for binding with metallic
species. The bands observed between 3500 to 3000 cm-1
indicate the occurrence of the characteristic absorption of N-H from amines and amides as well as alcoholic and phenolic hydroxyls and carboxylic acids (Figure 3a: 3445.7 cm-1; Figure 3b: 3433.9 cm-1; Figure 3c: 3527.0 cm-1). In the
3000 to 2800 cm-1 region, the absorption was mainly
Table 5. Effective cationic exchange capacity (CECeff) and potential cationic exchange capacity (CECpot). Values expressed in meq per 100 g. For sample identification, see text
Sample CECeff CECpot
MH 45.6 ± 2.1 49.1 ± 2.1
SM 50.4 ± 1.2 54.5 ± 1.2
XA 70.8 ± 3.3 72.9 ± 3.3
Table 4. Ca, Mg, K and Na exchangeable concentrations (n = 3), expressed in meq per 100 g. For sample identification, see text
Sample Ca M g K Na
MH 32.4 ± 2.0 9.2 ± 0.7 1.5 ± 0.1 1.6 ± 0.1 SM 20.9 ± 1.0 18.4 ± 0.6 4.7 ± 0.2 6.4 ± 0.1 XA 52.2 ± 3.3 1.5 ± 0.1 6.7 ± 0.4 9.3 ± 0.3 Table 3. Exchangeable acidity (EA), potential acidity (PA) and pH values (n=3). For sample identification, see text
Sample PAa EAa pH
MH 4.4 ± 0.2 0.9 ± 0.1 5.8 ± 0.2 SM 4.1 ± 0.1 0.0 ± 0.1 7.8 ± 0.3 XA 3.2 ± 0.1 1.1 ± 0.1 5.7 ± 0.1
aValues expressed in meq per 100 g
assigned to the C-H bond from aliphatic groups (Figure 3a: 2917.9 cm-1; Figure 3b: 2920.1 cm-1; Figure 3c: 2927.8 cm-1).
Between 2000 to 1000 cm-1, the absorption can be attributed
to the presence of C-O and C=O bands12 (Figure 3a: 1027.3,
1388.6, 1645.6 cm-1; Figure 3b: 1032.5, 1384.4, 1635.9
cm-1; Figure 3c: 1034.8, 1416.9, 1640.3 cm-1).
The importance of total cadmium determinations in vermicompost is related to the natural concentration of this element in the material. After microwave-assisted decomposition of three vermicompost samples, measurements revealed that total Cd concentrations were lower than the detection limit of FAAS (0.08 mg L-1). These
results indicated the low concentration of naturally occurring cadmium present in the vermicompost.
Results of the factorial design are indicated in Table 6 and, according to the mathematical treatment given by Matthias,7 a response surface (Figure 4a) was obtained from
these data. The surface reveals optimized values near to 0.5 on the pH axis for the cadmium adsorption process. It is important to note that this value is normalized, therefore it is necessary to find the corresponding value on the true pH scale (it is near 5); this conversion is possible using literature procedures.7 The equation obtained from the data shown in
Table 6 [% Cd adsorption = 36.97 + 12.25 pH – 15.00 pH2]
was taken into consideration in order to achieve the response surface (Figure 4a). The parameter agitation time is not shown in this equation because the error associated to this variable was higher than the coefficient related to it. This Figure also indicates that Cd adsorption was independent of the shaking time. These results can be explained in terms of the predominance of cationic exchange that may indicate that equilibrium between the Cd(II) content in the liquid and in the solid phases is rapidly attained. Another response surface representation comprises contour graphics (Figure
4b) that are obtained when constant values are attributed to dependent variables. In this specific situation, the parallel lines indicate that any variation of agitation time (within the studied interval) does not modify the cadmium adsorption, but the pH value strongly influences the analytical response. From this contour graphic, it is also possible to verify that the best pH for cadmium adsorption is attained near to 0.5 (normalized scale) or 5.0 (pH scale). Electron micrographies of vermicompost are shown in Figures 5a-c. These figures show a surface area with an irregular morphology as well as a high number of pores. This morphology can corroborate to high CEC values, such as those obtained, due to the high number of sites for metal adsorption.
The isotherm in Figure 6 shows a tendency towards saturation. This kind of isotherm is classified as Langmuir because it follows the mathematical model indicated by equation 1:13
qM = a . b . CeqM . (1 + a . CeqM)-1 (1)
where qM = quantity of adsorbed metal in vermicompost
Table 6. Data from factorial design
pHa Shaking timea Cd adsorption (%)b
- 1 - 1 7.30 ± 0.58
0 - 1 38.68 ± 0.39
1 - 1 34.01 ± 2.38
- 1 0 11.61 ± 1.10
0 0 34.84 ± 1.05
1 0 34.64 ± 1.39
- 1 1 9.06 ± 0.27
0 1 34.48 ± 2.07
1 1 32.22 ± 1.29
a The values –1, 0 and 1 as in Table 1; bMean of 3 replicates ±
standard deviation.
(mg g-1); a = constant, related to adsorption energy, and
expressed by equation:
b
o exp ( - ∆H/RT) (2)
Here, bo = constant, including the entropy term, R =
universal gas constant, T = absolute temperature. This constant (a) can be expressed as L mg-1; b = highest metal
adsorption capacity in the vermicompost (mg g-1); C
eqM =
equilibrium metal concentration (mg L-1).
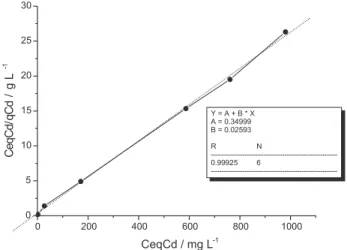
According to the literature,14 equation 1 can be
linearized, yielding equation 3:
CeqM/qM = (a . b)-1 + (b)-1 . C
eqM (3)
From the inverse of the angular coefficient indicated in Figure 7 (linearization of the results from Figure 6), it is possible to calculate the maximum adsorption capacity
for cadmium in the vermicompost (38.6 mg g-1). When
compared to different adsorbent materials,15 vermicompost
presents an expressive cadmium adsorption capacity. In the pre-concentration experiments, it was possible to confirm the cadmium adsorption potential of
vermi-compost, because this material exhibited both high
enrichment factor (EF) and pronounced recovery for
synthetic and real samples. According to the literature,16
EF values can be calculated from the ratio of sample and the elution volume. In the present work, an EF of 100 was
obtained. Based on this same reference,16 cadmium
Figure 6. Langmuir isotherm for cadmium, where qCd is the quan-tity of cadmium adsorbed in vermicompost and CeqCd is the equi-librium cadmium concentration.
Figure 7. Linearization of Langmuir isotherm for cadmium, where CeqCd/qCd is the ratio between the equilibrium concentration and the quantity of cadmium adsorbed in vermicompost.
recoveries were calculated from the ratio between the cadmium concentration found by FAAS (pre-concentrated samples) and that concentrations seen in the synthetic or real samples after their preparation or enrichment with
5 µg L-1 Cd respectively. The cadmium concentration
determined by GFAAS in the synthetic solution after its preparation was 4.76 ± 0.06 µg L-1, whereas the
concen-tration of this metal in the eluent solutions (10 mL of 1.0 mol L-1 HNO
3) was 456 ± 23 µg L
-1 (determination by
FAAS). Thus, a recovery of ca. 96% was observed. For real samples (mineral waters enriched with Cd), the eluent solutions presented Cd concentrations of 479 ± 31 µg L-1,
while in directly determined samples, the Cd concentration value was 4.84 ± 0.04 µg L-1. Therefore, a recovery of 99%
was calculated. As additional information, the natural concentration of Cd in mineral water was always below the detection limit of the GFAAS technique (< 0.17 µg L-1).
It was necessary to use a vermicompost mass of at least 120 mg in order to compensate the competition effects
between Cd2+ and the main constituents of mineral waters
[Ca, Mg, K at 13.4, 5.0, 1.9 mg L-1 (determined by FAAS/
FAES) and Na at 10.2 mg L-1, as indicated in the label].
When 60 mg of vermicompost were used for real samples, recoveries between 50 and 60% were verified. In the synthetic sample (without concomitants ions) a vermicompost mass of 60 mg was sufficient for quantitative recovery of cadmium.
Conclusions
This work presents data to support the applicability of vermicompost in adsorptive processes. The results highlight vermicompost as a potential material for cadmium adsorption. For cadmium preconcentration procedures, this potential was confirmed, as high pre-concentration factors and recoveries were obtained. This characteristic is of high analytical interest, as vermicompost is easily available at low cost (ca. US$ 100 per ton).
Related to adsorption behavior, it is possible to predict that vermicompost may adsorb other metallic species as efficiently as Cd2+. This affirmative is based on the structural
properties of vermicompost, as this material demonstrates desirable characteristics (e.g., high CEC values), which can be applicable to different metals. In this way, studies should be carried out to investigate the use of this material in relation to the adsorption of other metals.
According to all these characteristics, use of vermicompost for determination of environmental contaminants is feasible; mainly those related to determining the results of treatments of effluents heavy high initial metal concentrations.
For environmental purposes, when complex matrices are considered, an increase in the vermicompost mass could be made to compensate possible differences in the adsorption properties due to the presence of concomitants.
Acknowledgements
Partial support and grants from the Conselho Nacional de Desenvolvimento Científico e Tecnológico (CNPq, Brasília, Brazil) and Fundação de Amparo à Pesquisa do Estado de São Paulo (FAPESP, São Paulo, Brazil – grant number 99/12124-7) are greatly appreciated. The authors are grateful to Prof. Elias A. G. Zagatto and Prof. Carol H. Collins for language improvement, and to E. R. Pereira-Filho for computational support.
References
1. Landgraf, M. D.; da Silva, S. C.; Rezende, M. O. O.; Anal. Chim. Acta 1998, 368, 155.
2. Rashid, M. A.; Geochemistry of Marine Humic Compounds, 1st
ed.; Springer-Verlag: Berlin, 1985.
3. Ro, K. S.; Preston, K. T.; Seiden, S.; Bergs, M. A.; Crit. Rev. Environ. Sci. Technol.1998, 28, 253.
4. Stanley, E. M.; Environmental Chemistry, 6th ed.; Lewis
Pub-lishers: London, 1994.
5. Pace, A. L.; Miller, R. H.; Keeney, D. R.; Methods of Soil
Analysis, Part 2 - Chemical and Microbiological Properties, 2nd ed.; Soil Science Society of America, Inc. Publisher:
Madi-son, 1982.
6. Magalhães, C. E. C.; Pasquini, C.; Arruda, M. A. Z.; Lab. Rob. Autom. 2000, 12, 46.
7. Matthias, O.; Chemometrics - Statistics and Computer
Appli-cation in Analytical Chemistry, Wiley-VCH: Weinheim, 1999. 8. Slavek J.; Wold, J.; Pickering, W. F.; Talanta 1982, 29, 743. 9. Lamim, S. S. M.; Jordão, C. P.; Brune, W.; Pereira, J. L.;
Bellato, C. R.; Quim. Nova 1996, 19, 457.
10. Rocha, J. C.; Rosa, A. H.; Furlan, M.; J. Braz. Chem. Soc. 1998, 9, 51.
11. Wershaw, R. L.; Pinckney, D. J.; Anal. Chim. Acta 1990, 232, 31. 12. Pavia, D. L.; Lampman, G. M.; Kriz, G. S.; Introduction to Spectroscopy, 2nd ed., Harcourt Brace College Publishers:
Phila-delphia, 1996.
13. Sag, Y.; Kutsal, T.; Biochem. Eng. J. 2000, 6, 145. 14. Hseih, C. T.; Teng, H.; Carbon 2000, 38, 863. 15. Kaewsam, P.; Yu, Q.; Environ. Pollut. 2001, 112, 209. 16. Bag, H.; Lale M.; Türker, A. R.; Talanta1998, 47, 689.
Received: December 14, 2001
Published on the web: November 29, 2002