The molecular structure of the vanadate mineral mottramite
[PbCu(VO
4
)(OH)] from Tsumeb, Namibia – A vibrational spectroscopic
study
Ray L. Frost
a,⇑, Yunfei Xi
a, Andrés López
a, Lívia Corrêa
b, Ricardo Scholz
ba
School of Chemistry, Physics and Mechanical Engineering, Science and Engineering Faculty, Queensland University of Technology, GPO Box 2434, Brisbane, Queensland 4001, Australia
b
Geology Department, School of Mines, Federal University of Ouro Preto, Campus Morro do Cruzeiro, Ouro Preto, MG, 35, 400-00, Brazil
h i g h l i g h t s
We have studied a mineral sample of mottramite PbCu(VO4)(OH) from Tsumeb, Namibia.
Chemical analysis using scanning electron microscopy with EDX shows complexity.
Raman and infrared spectra were obtained.
The complexity of the spectra is attributed to the chemical composition of the Tsumeb mottramite.
Complexity of the spectra is attributed to symmetry reduction of the vanadate unit fromTdtoCs.
g r a p h i c a l
a b s t r a c t
a r t i c l e
i n f o
Article history:
Received 22 August 2013
Received in revised form 11 November 2013 Accepted 13 November 2013
Available online 21 November 2013
Keywords:
Mottramite Descloizite Infrared spectroscopy Raman microscopy Pyromorphite Apatite
a b s t r a c t
We have studied a mineral sample of mottramite PbCu(VO4)(OH) from Tsumeb, Namibia using a combi-nation of scanning electron microscopy with EDX, Raman and infrared spectroscopy. Chemical analysis shows principally the elements V, Pb and Cu. Ca occurs as partial substitution of Pb as well as P and As in substitution to V. Minor amounts of Si and Cr were also observed. The Raman band of mottramite at 829 cm 1, is assigned to the
m1symmetric (VO4) stretching mode. The complexity of the spectra is
attributed to the chemical composition of the Tsumeb mottramite. Them3antisymmetric vibrational mode of mottramite is observed as very low intensity bands at 716 and 747 cm 1. The series of Raman bands at 411, 439, 451 cm 1and probably also the band at 500 cm 1are assigned to the (VO
4)m2bending mode. The series of Raman bands at 293, 333 and 366 cm 1are attributed to the (VO
4)m4bending modes. Them3,m3andm4regions are complex for both minerals and this is attributed to symmetry reduction of the vanadate unit fromTdtoCs.
Ó2013 Elsevier B.V. All rights reserved.
Introduction
Mottramite is a member of the descloizite group of minerals which are basic vanadates and are made up of minerals of the gen-eral formula PbM(VO4)(OH) where M may be Cu (mottramite), Zn
(descloizite), Mn (pyrobelonite) or (Fe,Mn) (cechite)[1]. The min-erals are of orthorhombic symmetry withpoint group mmm[1]. The minerals are built up of MO4(OH)2tetragonal bipyramids of Cisite symmetry combined in chains along [0 0 1] connected to a framework of distorted vanadate tetrahedra of Cssymmetry and distorted PbO8square antiprisms[2,3]. The free vanadate ion has tetrahedral Td symmetry [4]. Ross [5] reports the free aqueous vanadate ion as having a
m
1(A1) mode at 874 cm 1, them
2mode1386-1425/$ - see front matterÓ2013 Elsevier B.V. All rights reserved.
http://dx.doi.org/10.1016/j.saa.2013.11.086
⇑Corresponding author. Tel.: +61 7 3138 2407; fax: +61 7 3138 1804.
E-mail address:[email protected](R.L. Frost).
Contents lists available atScienceDirect
Spectrochimica Acta Part A: Molecular and
Biomolecular Spectroscopy
of E symmetry at 345 cm 1, the
m
3 mode of F2 symmetry at 855 cm 1and them
4mode also of F2symmetry at 345 cm 1. For perfect Tdsymmetry, the first two modes are Raman active/infra-red inactive and the last two modes both Raman and infraactive/infra-red active. The presence of a cation in the aqueous vanadate solution as an ion pair reduces this symmetry.Some information on the spectroscopy of the VO4 unit for the descloizite group is available [5,6]. Ross reported the infrared absorption spectra of descloizite with bands at 860, 750 and 453 cm 1 and attributed these bands to the
m
1,m
3andm
4 vibra-tional modes. The Raman spectrum of mottramite was not re-ported. The infrared spectra of vanadate minerals have been reported and the variation ascribed to the VO distances in the structure[7]. Griffiths[6]reported bands for the infrared spectra of descloizite at 865, 820, 777, 777, 760, 400, 384, 377, 356, 301 and 200 cm 1. Mottramite had infrared absorption bands at 834, 802, 795, 358, 348, 331, 295, 288 and 188 cm 1. No Raman spectra were reported in the work of Griffith[6]. Considerable differences in the infrared spectra of the two minerals were observed even though the two minerals had the same structure and symmetry. Such differences may be attributed to the vanadium–oxygen stretching and vanadium–oxygen bond–bond interaction force constants of the VO4 unit in the structure of minerals.Raman spectroscopy has proven very useful for the study of minerals [8–11]. Indeed, Raman spectroscopy has proven most useful for the study of diagenetically related minerals as often oc-curs with minerals containing vanadate groups such as mottra-mite, descloizite, pyrobelonite and cechite. The objective of this research is to report the vibrational spectra of mottramite and to relate the spectra to the molecular structure of the mineral mottramite.
Experimental
Samples description and preparation
The mottramite sample studied in this work forms part of the collection of the Geology Department of the Federal University of Ouro Preto, Minas Gerais, Brazil, with sample code SAC-099.
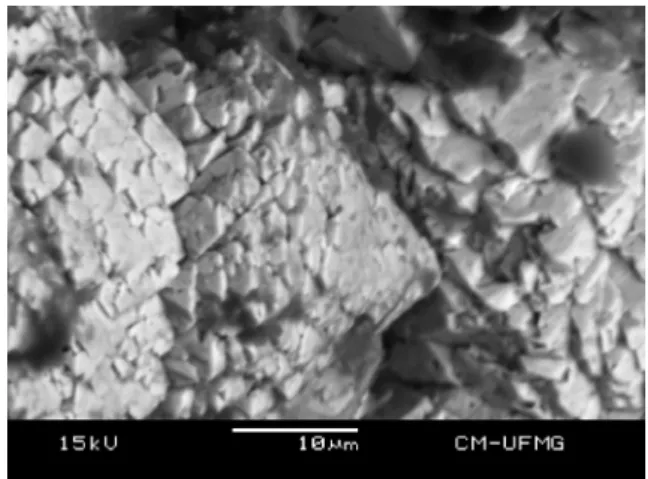
The sample was gently crushed and the associated minerals were removed under a stereomicroscope Leica MZ4. Scanning elec-tron microscopy (SEM) in the EDS mode was applied to support the mineral characterization. The XRD pattern shows the mineral is a single phase with no impurities.
Scanning electron microscopy (SEM)
Experiments and analyses involving electron microscopy were performed in the Center of Microscopy of the Universidade Federal de Minas Gerais, Belo Horizonte, Minas Gerais, Brazil (http:// www.microscopia.ufmg.br).
Mottramite crystals were coated with a 5 nm layer of evapo-rated carbon. Secondary Electron and Backscattering Electron images were obtained using a JEOL JSM-6360LV equipment. Qual-itative and semi-quantQual-itative chemical analyses in the EDS mode were performed with a ThermoNORAN spectrometer model Quest and were applied to support the mineral characterization.
Raman spectroscopy
The crystals of mottramite were placed and oriented on the stage of an Olympus BHSM microscope, equipped with 10and 50 objectives and part of a Renishaw 1000 Raman microscope system, which also includes a monochromator, a filter system and a Charge Coupled Device (CCD). Raman spectra were excited
by a HeNe laser (633 nm) at a nominal resolution of 2 cm 1 in the range between 100 and 4000 cm 1. Details of the experimental procedure have been published. The spatial resolution of the instrument is 1
lm. Thus, if crystals are less than this value, a
mix-ture of crystals will be measured. However, the crystals of mottra-mite used in this experiment were >1.1lm.
Infrared spectroscopy
Infrared spectra were obtained using a Nicolet Nexus 870 FTIR spectrometer with a smart endurance single bounce diamond ATR cell. Spectra over the 4000–525 cm 1 range were obtained by the co-addition of 128 scans with a resolution of 4 cm 1and a mirror velocity of 0.6329 cm/s. Spectra were co-added to improve the signal to noise ratio.
Spectral manipulation such as baseline adjustment, smoothing and normalization were performed using the Spectracalc software package GRAMS (Galactic Industries Corporation, NH, USA). Band component analysis was undertaken using the Jandel ‘Peakfit’ soft-ware package which enabled the type of fitting function to be se-lected and allows specific parameters to be fixed or varied accordingly. Band fitting was done using a Lorentz-Gauss cross-product function with the minimum number of component bands used for the fitting process. The Gauss-Lorentz ratio was main-tained at values greater than 0.7 and fitting was undertaken until reproducible results were obtained with squared correlations of
r2greater than 0.995.
Results and discussion
Chemical characterization
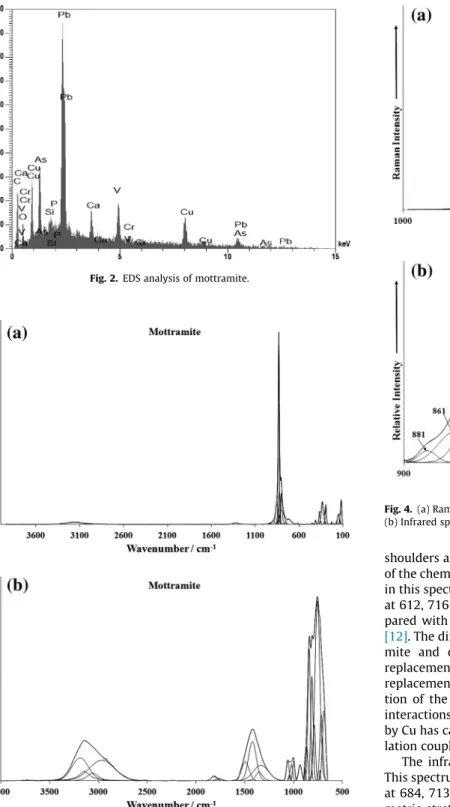
The SEM/BSI image of the mottramite crystal aggregate studied in this work is shown inFig. 1. The sample shows a complex chem-ical composition. The major elements are V, Pb and Cu. Ca occurs as partial substitution of Pb as well as P and As in substitution to V. Minor amounts of Si and Cr were also observed (Fig. 2).
Vibrational spectroscopy of mottramite
The Raman spectrum of mottramite over the 4000–100 cm 1 spectral range is reported inFig. 3a. This figure displays the posi-tion and relative intensities of the Raman bands. It is noted that there is very little intensity in the OH stretching region. Hence, the Raman spectrum is subdivided into sections for more detail
based upon the type of vibration being studied. The infrared spec-trum of mottramite over the 4000–500 cm 1spectral range is re-ported inFig. 3b. This spectrum shows the position and relative intensities of the infrared bands. In a similar fashion to the Raman spectrum, the infrared spectrum is subdivided into sections for a more detailed study.
The Raman spectrum of mottramite over the 600–1000 cm 1 spectral range is shown inFig. 4a. The spectrum is dominated by a very intense band at 829 cm 1which is assigned to the symmet-ric stretching mode (m1) of VO4of mottramite. Some low intensity
shoulders are observed at 802, 821 and 849 cm 1. The complexity of the chemical analysis is reflected in the multiple bands observed in this spectral region. Other low intensity Raman bands are found at 612, 716 and 747 cm 1. The position of this band may be com-pared with the Raman band of descloizite observed at 844 cm 1 [12]. The differences in the symmetric stretching region of mottra-mite and descloizite are attributed to the differences in the replacement of the Pb for Zn in the descloizite example and the replacement of Pb with Cu and Ca in the mottramite case. Sustitu-tion of the Zn by Cu has caused an increase in the interatomic interactions on the vanadate units[12]. Replacement of the Zn by Cu has caused the internal modes of the vanadate unit to corre-lation couple with the same modes of another vanadate unit[12]. The infrared spectrum of mottramite is illustrated in Fig. 4b. This spectrum is broad and may be resolved into component bands at 684, 713, 726, 752, 898, 836, 861 and 881 cm 1. The antisym-metric stretching mode (m3) of VO4 of mottramite is readily ob-served in the infrared spectrum as the infrared bands at 726, 752 and 785 cm 1. This observation is unusual as three bands are found when six bands are expected.The intense Raman band at 829 cm 1 is reflected in the infrared band at 836 cm 1. It is probable that the very low intensity Raman bands at 716 and 747 cm 1are due to the antisymmetric stretching mode (m3) of VO4 of mottramite. Comparing the Raman spectrum of descloizite and mottramite, all vanadate units are crystallographically equivalent. This suggests that both the Zn and Cu cations exist in the mottramite sample and according to their relative proportions and local distributions, the vibrational selection rules may be modified or relaxed. I.e. there are two sets of overlapping bands 829/821 cm 1 and 802/ 796 cm 1. Such a result may arise from the separate detection of vanadate in association with either the Cu or the Zn.
Fig. 2.EDS analysis of mottramite.
Fig. 3.(a) Raman spectrum of mottramite over the 4000–100 cm1spectral range.
(b) Infrared spectrum of mottramite over the 4000–500 cm 1spectral range.
Fig. 4.(a) Raman spectrum of mottramite over the 1000–600 cm 1spectral range.
The Raman spectra of mottramite over the 550–100 cm 1 spec-tral range are reported inFig. 5. This spectral region includes the bending modes of the vanadate unit (m2) and the
m
4 vibrational modes. Ross[5]reports the bending mode of the vanadate ion as an infrared band at 460 cm 1. The equivalent band in the Raman is observed at 411 cm 1. The most intense band in the Raman spec-trum of mottramite is observed at 333 cm 1 with other intense bands at 293 and 366 cm 1. The series of Raman bands of mottra-mite at 411, 439, 451 and 500 cm 1are assigned to them
2bending mode. Hence, the other bands observed in this region at 366, 333 and 293 cm 1 are attributable to them
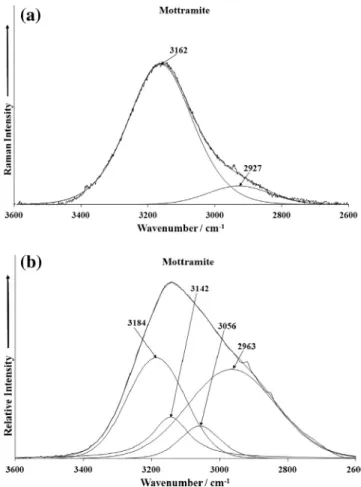
4 vibration. The Raman bands between 100 and 250 cm 1are simply described as external lattice modes.The Raman spectrum of mottramite over the 3600–2600 cm 1 spectral range is provided inFig. 6a. This figure shows a broad Ra-man band at 3162 cm 1with a shoulder at 2927 cm 1. The infrared spectrum of mottramite shows a broad spectral profile with re-solved infrared bands at 2963, 3056, 3142 and 3184 cm 1. These bands are attributed to the stretching vibrations of the OH units. These bands are associated with the substituting metal in the van-adate structure. The hydroxyl deformation modes (Zn–OH and Cu–OH) are not observed in the Raman spectra but may be ob-served in the infrared spectrum. In a previous study infrared bands were observed in the 506–508 cm 1region and these bands were assigned to CuO stretching vibrations. However, a more likely assignment is to the M–OH deformation modes. No infrared or Ra-man bands were observed in the 1600–1700 cm 1spectral region; thus, indicating that no water was present in the sample.
The results of the Raman spectra of the Tsumeb mottramite show that the wavenumbers of the stretching and bending vibra-tions of mottramite are influenced by the forces exerted on the vanadate unit in the crystal structure. Substitution of Cu2+ and Ca2+for Zn2+in the structure affects the internal force field of the vanadate unit. This results in the complexity of the Raman and infrared spectra of the Tsumeb mottramite. The crystal structure of the mottramite-descloizite series has the Pb2+ cation coordi-nated by seven anions between 2.45 and 2.80 Å with a further two anions distant at 3.195 Å. The Zn2+or Cu2+cation is coordi-nated by six anions in a distorted octahedral arrangement with a CuO distance of 2.112 Å. X-ray diffraction shows that the mottra-mite and descloizite form an isomorphous series.
Careful single crystal X-ray structural analyses of both mottra-mite and descloizite have been reported. These have included bond valence calculations and attention has been drawn explicitly to differences in the VO3
4 geometries in these and a variety of other vanadates. Subtle differences in the two structures are associated
with the Jahn–Teller distortion of the M site as Cu2+is substituted for Zn2+and these affect, in turn, the geometrical details of the van-adate unit and in turn results in the complexity of the vibrational spectra. Furthermore because of the changing bond order of vana-date and Cu2+versus Zn2+, the force constants for the V–O bonds must alter. Thus, just as the OH modes are different in the two min-erals, and two are detected apparently as the result of the presence of both Pb2+and Cu2+in the mottramite sample, additional bands associated with the VO3
4 unit may be attributed to local perturba-tions in the structure associated in turn with localized Cu2+–VO3
4 and Zn2+–VO3
4 interactions.
Conclusions
We have used a combination of Raman and infrared spectros-copy to explore the structure of the vanadate mineral mottramite. The Raman spectrum is dominated by a very intense band at 829 cm 1assigned to the symmetric stretching mode (m
1) of VO4 of mottramite. Some low intensity Raman bands are observed at 802, 821 and 849 cm 1. The complexity of the chemical analysis is reflected in the multiple bands observed in this spectral region. Other low intensity Raman bands are found at 612, 716 and 747 cm 1. These bands are attributed to the antisymmetric stretching mode (m3) of VO4 of mottramite. The observation of multiple low intensity bands suggests that both the Zn and Cu cations exist in the mottramite sample and according to their relative proportions and local distributions, the vibrational selec-tion rules may be modified or relaxed.
Fig. 5.Raman spectrum of mottramite over the 550–100 cm1spectral range.
Fig. 6.(a) Raman spectrum of mottramite over the 3600–2600 cm 1spectral range.
Acknowledgements
The financial and infra-structure support of the Discipline of Nanotechnology and Molecular Science, Science and Engineering Faculty of the Queensland University of Technology, is gratefully acknowledged. The Australian Research Council (ARC) is thanked for funding the instrumentation. The authors would like to acknowledge the Center of Microscopy at the Universidade Federal de Minas Gerais (http://www.microscopia.ufmg.br) for providing the equipment and technical support for experiments involving electron microscopy. The authors are also grateful to CNPq Project 402852/2012-5. Lívia Corrêa is gratfull to CAPES – Programa Jovens Talentos.
Appendix A. Supplementary material
Supplementary data associated with this article can be found, in the online version, athttp://dx.doi.org/10.1016/j.saa.2013.11.086.
References
[1]J.W. Anthony, R.A. Bideaux, K.W. Bladh, M.C. Nichols, Handbook of Mineralogy, Arsenates, Phosphates, Vanadates, vol. IV, Mineralogical Data Publishing, Tucson, Arizona, USA, 2000.
[2]M.F. Grigor’eva, V.M. Zakharenko, I.A. Tserkovnitskaya, T.S. Lunina, Fizika, Khimiya (1980) 106–108.
[3]A. Grzechnik, Neues Jahrbuch fur Mineralogie, Monatsh. 2 (1991) 87. [4]W.P. Griffith, P.J.B. Lesniak, J. Chem. Soc. (1969) 1066–1071.
[5]S.D. Ross, Phosphates and the Other Oxyanions of Group V, Mineralogical Society London, 1974.
[6]W.P. Griffiths, Advances in the Raman and Infrared Spectroscopy of Minerals, John Wiley and Sons, London, 1987.
[7]A.S. Povarennykh, Konstit. Sv. Min. 13 (1979) 78–87.
[8]R.L. Frost, Y. Xi, R. Scholz, A. Lopez, F.M. Belotti, J. Mol. Struct. 1042 (2013) 1–7. [9]R.L. Frost, Y. Xi, Spectrochim. Acta 95 (2012) 263–269.
[10]R.L. Frost, Y. Xi, Spectrochim. Acta A91 (2012) 324–328. [11]R.L. Frost, Y. Xi, J. Mol. Struct. 1028 (2012) 200–207.