GROWTH RATE OF MIXED RUMINAL BACTERIA AS A FUNCTION
OF ENERGETIC SUBSTRATE CONCENTRATION IN BATH CULTURE
1Tadeu Silva de Oliveira2, Rogério de Paula Lana2,
José Carlos Pereira2, Geicimara Guimarães3, José Alípio Faleiro Neto4
INTRODUCTION
Ruminal fermentation is an exergonic process that turns feedstuffs into microbial cells, microbial protein, short-chain fatty acids, methane and ammonia. Ruminants use the organic acids and microbial protein as sources of energy and amino acids, respectively (Russell 1984).
ABSTRACT
RESUMO
Most feedstuffs are composed of large relatively insoluble and sometimes complex polymers. These polymers must be degraded to low-molecular-weight substances by microbial extra cellular enzymes before they can be used. Extra cellular enzymes can be secreted out into cell-free rumen fluid, but much of the activity remains cell-associated (Pettipher & Latham 1979, Forsberg et al. 1981).
1. Trabalho recebido em jul./2009 e aceito para publicação em dez./2010 (n° registro: PAT 6672/ DOI 10.5216/pat.v41i1.6672). 2. Universidade Federal de Viçosa, Centro de Ciências Agrárias, Departamento de Zootecnia, Viçosa, MG, Brasil.
E-mails: [email protected], [email protected], [email protected].
3. Universidade Federal de Viçosa, Centro de Ciências Agrárias, Departamento de Economia Rural, Viçosa, MG, Brasil. E-mail: [email protected].
4. Universidade Federal de Minas Gerais, Escola de Veterinária, Departamento de Zootecnia, Belo Horizonte, MG, Brasil. The objective of this study was to evaluate levels of sucrose on microbial growth. Roll tubes were filled with 15.6 mL of buffer Chen, 1 mL of inocula (rumen fluid from fistulated steer at pasture), 1 mL of Trypticase or hydrolyzed casein (1 g L-1 as final concentration) and 2.4 mL of sucrose solutions
(0.00 g L-1, 0.37 g L-1, 0.75 g L-1, 1.5 g L-1, 3.0 g L-1, 6.0 g L-1,
12.0 g L-1, and 24.0 g L-1), in triplicate. The pH was 5.56 at 0 h
and 4.6 after 6 h, and 5.83 in 0 g L-1 and 4.18 above 1.5 g L-1
of sucrose. The optical density (OD-600 nm) and microbial protein (MP-595 nm) tended to stabilize after 12 h and 6 g L-1
of sucrose, with no interaction between them. The OD (6 h to 24 h mean values) was curvilinear (hyperbolic), as a function of sucrose concentration, followed the saturation kinetics of Michaelis-Menten, which is typical of enzymes systems, and was described by the following Lineweaver-Burk equation: 1/OD = 0.508*(1/sucrose) + 1.15, R² = 0.99. The theoretical maximum microbial growth (1/a = kmax) was 0.87 OD and the concentration of sucrose to reach half of kmax (b/a = Ks) was 0.44 g L-1 of sucrose. The microbial growth was affected by
incubation time, substrate concentration, and culture medium acidification.
KEY-WORDS: Lineweaver-Burk; Michaelis-Menten; pH; saturation kinetics; sucrose.
CRESCIMENTO DE BACTÉRIAS RUMINAIS EM FUNÇÃO DA CONCENTRAÇÃO DE SUBSTRATO
ENERGÉTICO EM MEIO DE CULTURA
O objetivo deste estudo foi avaliar os níveis de sacarose no crescimento microbiano. Tubos de ensaio foram preenchidos com 16,5 mL de tampão (meio Chen), 1 mL de inóculo (líquido de rúmen de bovino em pasto), 1 mL de Tripticase ou caseína hidrolisada (1 g L-1 como concentração final) e 2,4 mL de solução
de sacarose (0,00 g L-1; 0,37 g L-1; 0,75 g L-1; 1,5 g L-1; 3,0 g L-1;
6,0 g L-1; 12,0 g L-1; e 24,0 g L-1), em triplicata. O pH foi de 5,56
à 0 hora (h) e 4,6 às 6 h, 5,83 em 0 g L-1 e 4,18 acima de 1,5g L-1
de sacarose. A densidade óptica (DO-600 nm) e de proteína microbiana (MP-595 nm) tenderam a se estabilizar após 12 h e 6 g L-1 de sacarose, sem ocorrência de interação. A DO (valores
médios entre 6 h e 24 h) foi curvilínea (hipérbole), em função da concentração de sacarose, seguiu o modelo de saturação cinética de Michaelis-Menten, típico do sistema enzimático, e foi descrita pela seguinte equação de Lineweaver-Burk: 1/DO = 0.508*(1/ sacarose) + 1.15, R² = 0,99. O crescimento microbiano máximo teórico (1/a = kmax) foi de 0,87 DO e a concentração de sacarose para atingir a metade kmax (b/a = Ks) foi de 0,44 g L-1 de sacarose.
O crescimento microbiano foi afetado pelo tempo de incubação, concentração de substrato e acidificação do meio de cultura.
The maximum growth rates of ruminal bacteria depend on the energy source that is evaluated, such as glucose, maltose, sucrose, cellobiose, xylose, and lactate. The affinity to these substrates can vary among different ruminal bacteria species (Russell & Baldwin 1978).
Bacterial growth rate depends on substrate concentration, similarly to the saturation kinetics typical of enzyme systems (Monod 1949). The bacterial growth rate can be described according to the modification of the Michaelis-Menten model, as it follows: k = (kmax x S)/(Ks + S), where k is the specific growth rate, kmax is the maximum growth rate, S is the substrate concentration, and Ks is the substrate concentration that allows the half maximum growth rate.
Increase in optical density over time is an easy measurement of bacterial growth rate, although insoluble components interfere with such determination (Russell 1984). Therefore, the optical density measurement is recommended for purified and soluble substrates (sucrose, for example), but not for feedstuffs. In this case, the microbial protein measurement is the most adequate one (Oliveira et al. 2004).
Michaelis-Menten constants for enzyme activities are obtained by measuring initial velocities, at a series of substrate concentrations, and the dates are then plotted by a Lineweaver-Burk transformation of the Michaelis-Menten equation (Russell 1984).
The objective of this study was to evaluate the ruminal bacteria growth rate as a function of incubation time, substrate concentration, and final products accumulation.
MATERIAL AND METHODS
The experiment was carried out in the Laboratory of Animal Nutrition of the Universidade Federal de Viçosa, in Viçosa, Minas Gerais State, Brazil, from January 19 to May 3, 2009.
Ruminal fluid (500 mL) from fistulated steers at pasture was collected once a day, at 9 a.m., and anaerobically transported to the laboratory. The ruminal fluid was allowed to incubate for 30 minutes, at 39oC, and then the central part of the fluid was
used as inocula.
The incubations were performed anaerobically (under CO2 environment) in roll tubes placed in water bath, at 39oC, in triplicates, by adding 15.6 mL
of Chen buffer (Lana & Russell 1996), 1 mL of
inocula, 1 mL of Trypticase to reach 1 g L-1, and
2.4 mL of sucrose solutions (0.48 g of sucrose in 2.4 mL for the higher concentration and serial dilution 1:1 to achieve lower concentrations), to reach final concentrations of 0.00 g L-1, 0.37 g L-1, 0.75 g L-1,
1.5 g L-1, 3.0 g L-1, 6.0 g L-1, 12.0 g L-1, and 24.0 g L-1
(eight treatments in triplicate, totalizing 24 tubes). Samples were taken at 0, 6, 12, 18, and 24 hours of fermentation for measurements of pH and optical density (OD - 600 nm) (24 tubes x five sampling times = 120 observations).
The pH and OD were measured immediately, with a glass electrode and a spectrophotometer, respectively. A fraction of the samples was centrifuged (10000 x g, 5 min.), to remove bacteria, and frozen for posterior analyses of microbial protein (MP - 595 nm) and ammonia (NH3 - 630 nm). Ammonia in cell-free samples was determined by the Chaney & Marbach method (1962) and microbial protein by the Lowry et al. method (1951).
The experiment was analyzed in a completely randomized design for sampling time effect, regardless of sucrose concentration (Figure 1), and for sucrose concentration, regardless of sampling time (Figure 2), since there was no interaction between sampling time and sucrose concentration. In the first case, each point in the figure consisted of an average of 24 observations (eight sucrose concentrations by three replicates = 24 tubes of culture). In the second case, each point in the figure consisted of an average of 12 observations (four sampling times: 6, 12, 18, and 24 hours, by three replicates).
Linear regression of the microbial growth rate, as a function of the nutrient supply, was developed by using the Lineweaver-Burk equation (Champe & Harvey 1994, Lana et al. 2005), according to the model 1/Y = a + b x (1/X), where Y = growth rate (OD or microbial protein), a = intercept, b = coefficient of linear regression, and X = amount of nutrient (sucrose, g L-1).
The theoretical maximum growth rate was obtained by the reciprocal of the intercept (kmax = 1/a), and the amount of nutrient needed to reach half theoretical maximum response (Ks) was obtained by dividing the coefficient of the linear regression by the intercept (b/a), according to Lana et al. (2005).
RESULTS AND DISCUSSION
tended to stabilize after 12 hours and 6 g L-1 of sucrose,
both by measuring optical density (Figures 1a and 1b) and microbial protein (Figures 2a and 2b).
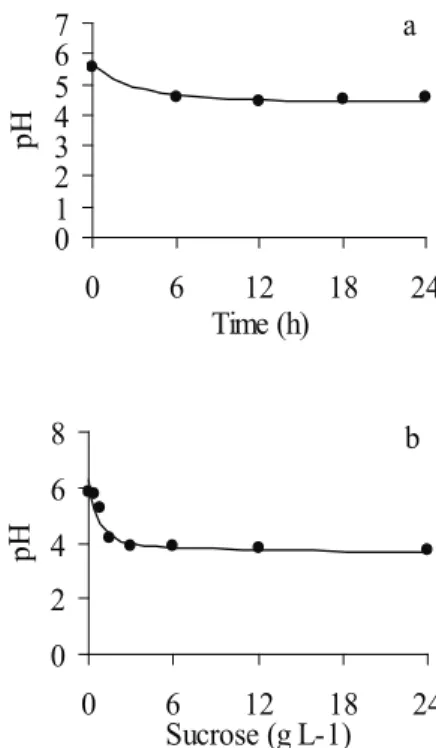
This effect was probably due to decreases in pH rates, that affect microbial growth (Russell et al. 1992), since the pH was 5.56 at time zero and stabilized in 4.6 after six hours (Figure 3a), and was 5.83 in 0 g L-1 and stabilized in 4.18 above 1.5 g L-1
of sucrose (Figure 3b).
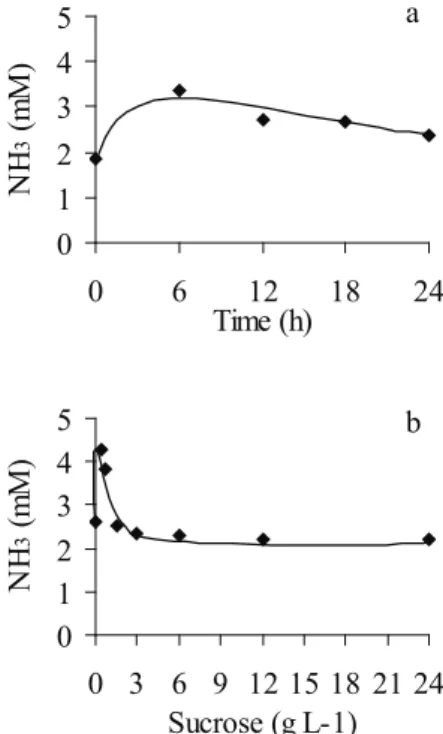
Ammonia reached its maximum concentration at six hours, decreasing slowly after this time (Figure 4a), and reached high concentration only on low sucrose levels (Figure 4b). In both cases, the inhibition of ammonia production was caused by decreases in pH, as also verified by Lana et al. (1998).
The microbial growth (optical density - OD) was curvilinear or hyperbolic, as a function of sucrose concentration (Figure 1b), and followed the saturation kinetics of Michaelis-Menten, which is typical of enzymes systems. The OD was described following the Lineweaver-Burk equation
0.0 0.2 0.4 0.6 0.8 1.0
0 6 12 18 24
Sucrose (g L-1)
O
D
600 n
m
b 0.0
0.2 0.4 0.6 0.8
0 6 12 18 24
Time (h)
O
D
600 n
m
a
Figure 1. Growth (optical density, OD) rate of mixed ruminal bacteria on sucrose over time (a), and growth as a function of different sucrose concentrations (b). Each point in panel a shows an average of 24 data (eight sucrose levels by three replicates) and each point in panel b shows an average of 12 data (four times by three replicates; the time zero was not considered because growth was evident after six hours of incubation - see Figure 1a) (Viçosa, MG, 2009).
1000 1050 1100 1150 1200
0 3 6 9 12 15 18 21 24 Sucrose (g L-1)
M
P
(
m
g L
-1
) b
1000 1050 1100 1150 1200
0 6 12 18 24
Time (h)
M
P
(
m
g L
-1
) a
Figure 2. Growth (microbial protein, MP) rate of mixed ruminal bacteria on sucrose over time (a), and growth as a function of different sucrose concentrations (b). Each point represents the average of 24 and 12 data, respectively (Viçosa, MG, 2009).
0 2 4 6 8
0 6 12 18 24
Sucrose (g L-1)
pH
b 0
1 2 3 4 5 6 7
0 6 12 18 24
Time (h)
pH
a
(Figure 5): 1/OD = 1.15 + 0.508*(1/sucrose), R² = 0.99. The theoretical maximum microbial growth (1/a = kmax) was 0.87 OD and the concentration of sucrose to reach half of the theoretical maximum microbial growth (b/a = Ks) was 0.44 g L-1 of
sucrose.
The growth rate of mixed ruminal bacteria in culture media containing sucrose was curvilinear, as a function of sucrose concentration (Figures 1b and 2b). This result is in accordance with Monod (1949), who verified that microbial growth rate was dependent on substrate concentration, being both related to the saturation kinetics typical of enzymatic systems. Figure 5 shows clearly that the data of microbial growth fits well the saturation kinetics model proposed by Lineweaver & Burk (1934).
According to Russell (1984), the constants in bacteria affinity are often low and it is difficult to measure initial growth rates in bath culture at substrate concentrations near to Ks (Russell 1984). However, Figure 1b and Figure 5 presented good data adjustment, probable due to the high number of measurements (12 data per point). Therefore, the adopted methodology is adequate for microbial growth kinetics measurements.
Recently, Lana et al. (2005) verified that the curvilinear responses on animal and plant growth rates, as a function of substrate supply (concentrate ration or fertilizer, respectively), are similar to those described by Michaelis & Menten (1913), for enzymatic systems, and by Monod (1949) and Russell (1984), for microbial growth rate.
The enzyme saturation, or the limit of substrate utilization per unit of time, is influenced by factors such as amount and source of substrates, affinity by substrate, and accumulation of final fermentation products (volatile fatty acids), that cause culture medium acidification. In this study, it can be verified that the lack of response in growth (optical density and microbial protein), above a specific concentration of sucrose, was probably due to affinity to the substrate and/or media acidification.
Low ruminal pH is a potent inhibitor of microbial growth, as observed in this study, in which ruminal bacteria ceased to grow (Figures 1 and 2) when the average pH reached its minimum (Figure 3). Cellulolytic bacteria are strongly inhibited when the pH level reaches less than 6.0, but some ruminal bacteria, such as amilolytic, can tolerate pH lower than 6.0 (Van Soest 1994).
As ruminal pH decreases by feeding cereal grain in replacement of forage, not only microbial growth goes down, but also there is inhibition of nutrient metabolism, such as protein and carbohydrate fermentation, and, consequently, ammonia and methane production (Lana et al. 1998).
In nature, all living organisms are subjected to substrates limitations and accumulation of metabolism products, in which this last is accelerated by excessive use of substrates. These features are 0
1 2 3 4 5
0 6 12 18 24
Time (h)
NH
3
(
m
M
)
a
0 1 2 3 4 5
0 3 6 9 12 15 18 21 24 Sucrose (g L-1)
NH
3
(
m
M
)
b
Figure 4. Ammonia concentration over time (a) and as a function of different sucrose levels (b). Each point represents the average of 24 and 12 data, respectively (Viçosa, MG, 2009).
y = 1.15 + 0.508x
r2 = 0.99
0 1 2 3
0 1 2 3
1/sucrose (g L-1)
1
/O
D
potential inhibitors or act as controllers of excessive population growth.
Interpretation of nutritional responses as a saturation phenomenon, by using kinetics models, has great application in the future for all living organisms, even for the human population (Morgan et al. 1975). Then, saturation kinetics models have to be adopted for a more rational use of the nonrenewable natural resources and to reduce environmental pollution.
CONCLUSION
The microbial growth was affected by incubation time, substrate concentration, and culture medium acidification, and became stabilized when it reached a fermentation time of 6 hours and a concentration of sucrose of 6 g L-1.
REFERENCES
CHAMPE, P. C.; HARVEY, R. A. Biochemistry. 2. ed. Philadelphia: JB Lippincott Company, 1994.
CHANEY, A. L.; MARBACH, E. P. Modified reagents for determination of urea and ammonia. Clinical Chemical, Washington, DC, v. 8, n. 2, p. 130-132, 1962.
FORSBERG, C. W.; BEVERIDGE, T. J.; HELLSTROM, A. Cellulase and zylanase release from Bacteroides
succinogenes and its importance in the rumen environment.
Applied Environmental Microbiology, Washington, DC,
v. 42, n. 5, p. 886-896, 1981.
LANA, R. P.; RUSSELL, J. B. Use of potassium depletion to assess adaptation of ruminal bacteria to ionophores.
Applied Environmental Microbiology,Washington, DC,
v. 62, n. 12, p. 4499-4503, 1996.
LANA, R. P.; RUSSELL, J. B.; VAN AMBURGH, M. E. The role of pH in regulating ruminal methane and ammonia production. Journal of Animal Science, Champaign, v. 76, n. 8, p. 2190-2196, 1998.
LANA, R. P. et al. Application of Lineweaver-Burk data transformation to explain animal and plant performance as a function of nutrient supply. Livestock Production
Science, Washington, DC, v. 98, n. 3, p. 219-224, 2005.
LINEWEAVER, H.; BURK, D. The determination of enzyme dissociation constants. Journal of the American
Chemical Society, Washington, DC, v.56, n. 3, p. 658,
1934.
LOWRY, O. H. et al. Protein measurement with the folin phenol reagent. Journal of Biological Chemistry, Bethesda, v. 193, n. 1, p. 265-275, 1951.
MICHAELIS, L.; MENTEN, M. L. Kinetics of invertase action. Biochemical Z, Zeitschrift, n.49, p. 333-369, 1913.
MONOD, J. The growth of bacterial cultures. Annual
Review of Microbiology, Palo alto, v. 3, n. 1, p. 371-394,
1949.
MORGAN, H. P.; MERCER, L. P.; FLODIN, N. W. General model for nutritional responses of higher organisms. Proceedings of the National Academy Science, Mortimore,v. 72, n. 11, p. 4327-4331, 1975.
OLIVEIRA, J. S. et al. Efeito da monensina e extrato de própolis sobre a produção de amônia e degradabilidade in
vitro da proteína bruta de diferentes fontes de nitrogênio.
Revista Brasileira de Zootecnia, Viçosa, v. 33, n. 2, p.
504-510, 2004.
PETTIPHER, G. L.; LATHAM, M. J. Characteristics of enzymes produced by Ruminococcus flavefaciens which degrade plant cell walls. Journal of General Microbiology, Shinfield, v. 110, n. 1, p. 21-27, 1979.
RUSSELL, J. B. Factors influencing competition and composition of the ruminal bacterial flora. In: GILCHRIST, F. M. C.; MACKIE, R. I. (Eds.). The herbivore nutrition
in the subtropics and tropics. Craighall: Science Press,
1984. p. 313-345.
RUSSELL, J. B.; BALDWIN, R. L. Substrate preferences in rumen bacteria: evidence of catabolite regulatory mechanism. Applied Environmental Microbiology, Washington, DC,v. 36, n. 2, p. 531-536, 1978.
RUSSELL, J. B. et al. A net carbohydrate and protein system for evaluating cattle diets: I. Ruminal fermentation.
Journal of Animal Science, Ithaca, v. 70, n. 11, p.
3551-3561, 1992.