Single and two-Phase Flows on Chemical and Biomedical Engineering
. Changes resulting from
the publishing process, such as peer review, editing, corrections, structural formatting, and other
quality control mechanisms may not be reflected in this document. A definitive version will be
subsequently published in the eBook
Single and two-Phase Flows on Chemical and Biomedical
Engineering, Ricardo Dias, Antonio A. Martins, Rui Lima and Teresa M. Mata (Eds), Bentham
Science, 600-612, 2012
”
CHAPTER 23
*Correspondence Author: Rui Lima, Department of Mechanical Technology, ESTiG, Braganca Polytechnic, C. Sta. Apolonia, 5301-857 Bragança, Portugal; E-mail: [email protected]
MICRO-FLOW VISUALIZATION OF MAGNETIC NANOPARTICLES
FOR BIOMEDICAL APPLICATIONS
R. Lima
1, 2, *, R. J. Joseyphus
3, ‡, T. Ishikawa
4, Y. Imai
4, and T. Yamaguchi
51. Department of Mechanical Technology, ESTiG, Braganca Polytechnic, C. Sta. Apolonia, 5301-857 Bragança, Portugal
2. CEFT, Engineering Faculty, Porto University, Rua Dr. Roberto Frias, 4200-465 Porto, Portugal
3. Department of Physics, National Institute of Technology, Tiruchirappalli 620 015, India. ‡E-mail: rjustinj(at)nitt.edu
4. Department ofBioengineering & Robotics, Grad. Sch. Eng., Tohoku University, 6-6-01 Aoba, 980-8579 Sendai, Japan
5. Department of Biomedical Eng., Grad. Biomedical Sch. Eng., Tohoku University, 6-6-01 Aoba, 980-8579 Sendai, Japan
Abstract: An investigation to measure the flow behavior of magnetic nanoparticles through a 100µm microchannel is conducted. The magnetic field is applied externally by a permanent magnet and by using a micro-PTV system it was possible to measure the flow behavior of magnetic nanoparticles at different flow rates and magnetic fields through a 100µm glass capillary. A strong dependence on both magnetic and hydrodynamic force is observed on the nanoparticles fluidic paths. Based on these in vitro studies, important parameters and issues that require further understanding and investigation are point out.
Keywords: Micro/nano flow, magnetic nanoparticles, superparamagnetism, Fe-oxide layer, hyperthermia, microchannel, micro-PIV/PTV.
INTRODUCTION
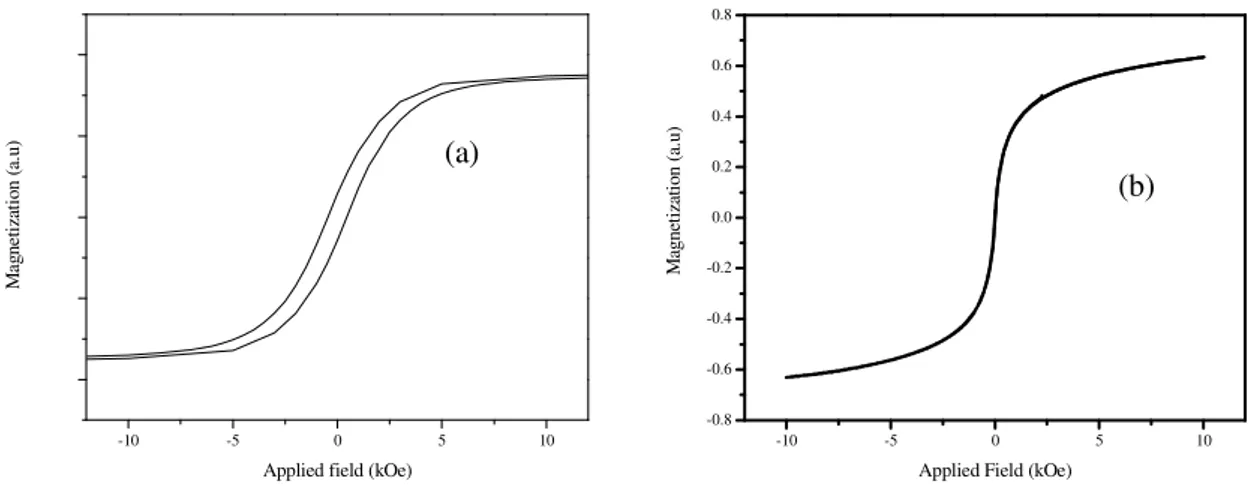
nanoparticles are hard to saturate and hence it requires sufficiently larger field. Thus it would be advantageous
to use magnetic materials which show larger saturation magnetization even at low magnetic field. Fig.1 (a)
shows the typical hysteresis loop at room temperature for magnetic materials with high K and (b) shows the
hysteresis loop for a superparamagnetic material. The difference in magnetic parameters such as coercivity
and saturation magnetization is obvious from the fig. 1.
-10 -5 0 5 10
(a)
M ag n et iz at io n ( a. u )Applied field (kOe)
-10 -5 0 5 10 -0.8 -0.6 -0.4 -0.2 0.0 0.2 0.4 0.6 0.8
(b)
M ag n et iz at io n ( a. u )Applied Field (kOe)
Figure 1: (a) Typical hysteresis loop at room temperature for a high K magnetic material and (b) hysteresis loop for a superaparamagnetic material. The superaparamagnetic material shows negligible coercivity.
Although smaller magnetic particles are preferable for biomedical applications, for applications such as drug delivery, the particles should be able to respond to an external magnetic field even at a larger separation. This requires that the magnetic nanoparticles should exhibit very large saturation magnetization. FeCo and Fe are the magnetic materials with very large saturation magnetization of 240 and 218 emu/g respectively [6]. Although FeCo has higher saturation magnetization, the biocompatibility and surface modification are difficult to achieve. On the other hand Fe particles of very high magnetization could be easily synthesized through chemical methods [7]. The biocompatibility could be achieved by a Fe-oxide layer over the Fe particles [8] as the biocompatibility of Fe-oxides is well known. However when the particle size becomes smaller, the Fe particles naturally undergoes oxidation and the large surface area of smaller particles with
Fe-oxide layer would reduce the saturation magnetization. This is illustrated in Fig.2 where larger Fe particles
would show higher magnetization.
(a) (b)
Figure 2:(a) Fe nanoparticles of smaller size have lower magnetization due to the larger fraction of Fe-oxide layer and (b) larger Fe particles show higher magnetization due to negligible Fe-oxide layer.
Fe
Fe-oxide
Magnetization
Few tens of nm
Fe
Fe-oxide
Magnetization
chemical methods such as polyol process is highly advantageous since the Fe particles could be free from contamination and surface modification is also possible. The surface modified nanoparticles could be then dispersed in a biocompatible fluid and injected into the blood stream and targeted to specific sites using an external magnetic field [11]. The drug delivery efficiency for the magnetic nanoparticles to reach specific target is influenced by various factors such as diameter of the circulatory path, force due to blood flow and the magnetic field. Magnetic particles of larger size could be delivered through the venule and arteriole whose radius ranges from 8 um to 0.07 mm whereas particle size should be less than 100 nm to pass through capilaries [12]. Generally magnetic nanoparticles synthesized will have a distribution in sizes and thus the magnetization and flow characteristics in a fluid will vary with size. For a single particle, the forces acting on the particle in a fluid can be obtained from Newton’s law
(1)
where mp and vp are the mass and velocity of the particle. Fm is the magnetic force given by
H
F
m=
(
µ
p.
∇
)
µ
f where µp is the effective magnetic dipole moment, µf is the permeability of the fluidand H is the external magnetic field. The drag force on the particle, Ff is given by
F
f=
−
6
πη
R
p(
v
p−
v
f)
where η is the viscosity of the fluid, Rp and vp are the radius and velocity of the particle and vf is the velocity
of the fluid. Fg is the sedimentation force due to density difference between the particles and fluid. Fg is given
by
F
g=
∆
ρ
Vg
, where ∆ρ is the density difference, V is the volume of a particle, and g is the gravitationalacceleration.
Most research in microcirculation has involved experimental studies using optical techniques mainly because they are less invasive for measuring the flow field. However, the fact that measurements of blood flow in microcirculation need to be performed at very small scales, have limited the number of flow measurements techniques suitable for this purpose. For instance, MRI and ultrasonography are not suitable to obtain quantitative flow information in microvessels mainly due to their poor spatial resolution. The majority of the
works performed in the past to measure velocity profiles of blood flow in vivo and in vitro are the double-slit
photometry, video microscopy and image analysis, and laser-Doppler anemometry. Recently, the considerable progress in computers, optics and digital image processing techniques made possible to successfully combine the conventional PIV system with an inverted microscope [13]. This combination, known as micro-PIV, has greatly increased the resolution of conventional PIV; as a result, this technique was been recently used to investigate biological flow behavior in microchannels [14-19]. However, to our knowledge micro-PIV/PTV measurements of physiological fluids containing magnetic nanoparticles was not performed in glass capillaries. The present study aims to measure and evaluate the flow behavior of magnetic nanoparticles at
different flow rates and magnetic fields through a 100µm glass capillary by means of a micro-PTV system.
MATERIALS AND METHODS
Working fluids, microchannel and magnetic field
The working fluid used in this study was Dextran 40 (Dx40) seeded with magnetic nanoparticles with
diameters of 25 nm (Fe25). The microchannel used in this study was a 100-µm circular borosilicate glass
microchannel fabricated by Vitrocom (Mountain Lakes, NJ, USA). The microchannel was mounted on a slide
glass (~120 µm thick) where it was immersed in a fluid (glycerol) in order to minimize some possible
refraction from the walls of the microchannel. (see Figure 3).
g f m p
p
F
F
F
dt
dv
Figure 3: Diagram showing the components of the microchannel device.
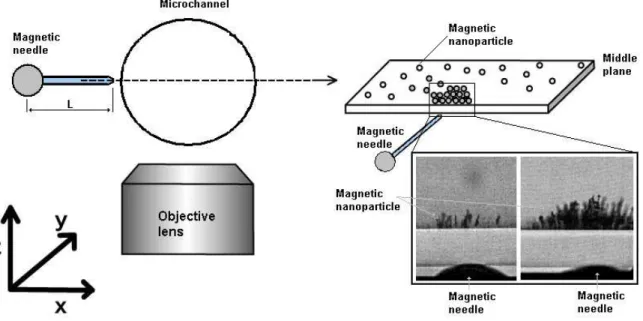
Figure 4 shows a schematic illustrating the effect of static magnetic field on the magnetic nanoparticles.
Briefly, a permanent magnet was attached into a needle and the strength of the magnetic field was varied by changing the position (L) of the magnet. By placing the needle around the middle plane of the microchannel we were able to create a magnetic field of 0.25mT and 0.4mT. The magnetic field was measured by using a Gauss meter (GM-301, Denshijiki).
Figure 4: Diagram showing the effect of the magnetic field on the magnetic nanoparticles.
Experimental set-up
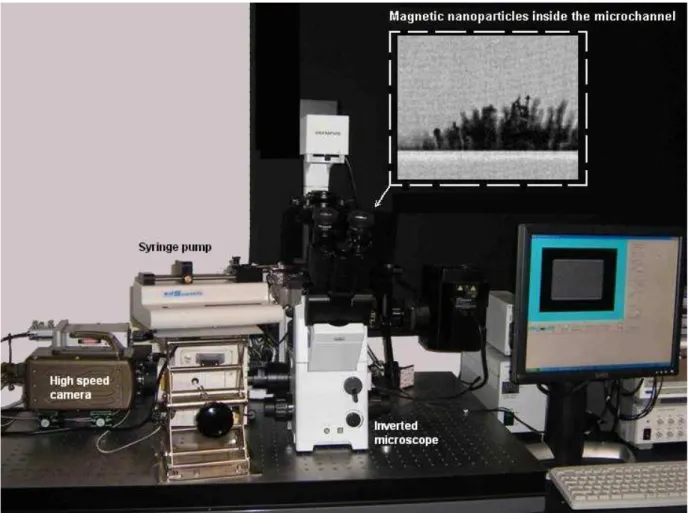
The microvisualization system used in this study is shown in Figure 5. The system consists of an inverted
microscope (IX71; Olympus, Japan) combined with a high-speed camera (Phantom v7.1; Vision Research, USA). The circular microchannel was placed on the stage of the inverted microscope and by using a syringe
pump (KD Scientific, USA) a pressure-driven flow was kept constant at 0.25 µl/min which corresponds to a
Reynolds of ~ 0.01. All the images were captured around the middle of the microchannels with an air
immersion 60× objective lens with a numerical aperture (NA) equal to 0.9. The flow images were first
recorded with a resolution of 640×480 pixels, at a rate of 200 frames/s (time interval of 5 ms) and then
Figure 5: Experimental set-up to investigate the effect of an external magnetic field on the fluidic paths of the magnetic nanoparticles.
RESULTS AND DISCUSSION
Flow visualization
Figures 6-10 show the effect of a local electromagnetic force on the flow behavior of magnetic nanoparticles
with a diameter of 25nm and a flow rate of 0.25µl/min and 35µl/min. Additionally by changing the position of
the permanent magnet we were also able to vary the strength of an external magnetic field. As a result it was possible to investigate the migration behavior of magnetic nanoparticles in an applied magnetic field, i. e., 0.25mT and 0.4mT.
Magnetic field of 0.4mT
First we investigated the effect of a magnetic field of 0.4mT on the nanoparticles flow behavior through a 100
µm circular microchannel. Figure 6 shows clearly that for a flow rate of 0.25 µl/min the magnetic
Figure 6: Effect of the local electromagnetic force on the nanoparticles flow behavior in a circular microchannel for a flow rate of 0.25 µl/min. Magnetic field of 0.4mT.
Figure 7: Effect of the local electromagnetic force on the nanoparticles flow behavior in a circular microchannel for a flow rate of 35 µl/min. Magnetic field of 0.4mT.
We also carried out qualitative measurements to investigate the effect of the flow rate for a magnetic field of
0.4mT. Figure 7 shows that for a flow rate of 35 µl/min there is no visible aggregation of nanoparticles on
We also investigated the effect of a weaker magnetic field of 0.25mT on the nanoparticles flow for a flow rate
of 0.25 µl/min. The results from Figure 8 show smaller amount of magnetic nanoparticles when compared
with Figure 6. This phenomenon is due to the decrease of external magnetic field.
Figure 8: Effect of the local electromagnetic force on the nanoparticles flow behavior in a circular microchannel for a flow rate of 0.25 µl/min. Magnetic field of 0.25mT.
Tracking clusters
By using an high speed camera the flow images were recorded at a rate of 200 frames/s (time interval of 5 ms) and then by using a manual tracking MTrackJ plugin from Image J (NIH) it was possible to track clusters of
nanoparticles flowing within the microchannel, as shown in Figures 9 and 10.
Magnetic field of 0.25mT and flow rate of 0.25 µµµµl/min
Figure 9 shows the trajectories of nanoparticles flowing in middle (Tk2) and near the wall of the microchannel
(Tk1). For the case of the middle nanoparticles the applied magnetic field (0.25mT) seems not to interfere in its trajectory. A possible explanation is the higher hydrodynamic force acting on the nanoparticles when compared with the magnetic force generated by the external magnet. In contrast the nanoparticles flowing
near the wall the trajectories tend to change their trajectories due the magnetic field strength. Figure 10 clearly
Figure 9: The effect of the local electromagnetic force on the displacement of cluster 1 (Tk 1) and 2 (Tk 2) flowing through a 100 µm glass capillary. Magnetic field of 0.25mT.
Figure 10: The effect of the local electromagnetic force on the instantaneous velocities of cluster 1 (Tk 1) and 2 (Tk 2) flowing through a 100 µm glass capillary. Magnetic field of 0.25mT.
CONCLUSIONS AND FUTURE DIRECTIONS
The present study corresponds to the first attempt to measure the flow behavior of magnetic nanoparticles
through a 100µm microchannel by using a micro-PTV system. Although it was not possible to track
individual nanoparticles, the results demonstrated the ability of our system to measure clusters of magnetic nanoparticles generated by an external magnetic field. The preliminary results show that the nanoparticles fluidic paths are strongly dependent not only by the magnetic field strength but also by the hydrodynamic
force. For instance, for a magnetic field of 0.4mT and flow rate of 0.25 µl/min the nanoparticles tend to
change their fluidic path and attach onto the wall whereas for the same magnetic field and higher flow rate of
35 µl/min the magnetic effects are negligible. Further studies are needed to clarify the effect of the static
field. By using an alternating field the magnetic nanoparticles can generate heat and can be used as novel treatment technique to destroy tumours.
ACKNOWLEDGEMENTS
This study was supported in part by the following grants: Grant-in-Aid for Science and Technology (PTDC/SAU-BEB/108728/2008, PTDC/SAU-BEB/105650/2008 and PTDC/EME-MFE/099109/2008) from the Science and Technology Foundation (FCT) and COMPETE, Portugal and Grant-in-Aid for Scientific Research (S) from the Japan Society for the Promotion of Science (JSPS; No.19100008). We also acknowledge the support from the 2007 Global COE Program “Global Nano-Biomedical Engineering Education and Research Network”.
REFERENCES
[1] Pankhurst QA, Connolly J, Jones SK, Dobson J. Applications of magnetic nanoparticles in biomedicine. J Phys. D: Appl Phys 2003; 36: R167-81.
[2] Tartaj P, Morales MP, Verdaguer SV, Carreno TG, Serna CJ. The preparation of magnetic nanoparticles for applications in biomedicine. J Phys D: Appl Phys 2003; 36: R182-97.
[3] Berry CC, Curtis ASG. Functionalisation of magnetic nanoparticles for applications in biomedicine. J Phys D: Appl Phys 2003; 36: R198–206.
[4] Sachdeva MS. Drug targeting systems for cancer therapy. Expert Opin Invest Drugs 1998; 7: 1849–64.
[5] Gupta AK, Gupta M. Synthesis and surface engineering of iron oxide nanoparticles for biomedical applications. Biomaterials 2005; 26: 3995-4021.
[6] Cullity BD, Graham CD. Introduction to magnetic materials. Wiley, NJ, 2009.
[7] Joseyphus RJ, Matsumoto T, Sato Y, Jeyadevan B, Tohji K. Role of Polyol on the formation of Fe particles. J Magn Magn Mater 2007; 310: 2393.
[8] Peng S, Wang C, Xie J, Sun S. Synthesis and stabilization of monodisperse Fe nanoparticles. J Am Chem Soc. 2006; 128: 10676-7.
[9] Hyeon T. Chemical synthesis of magnetic nanoparticles. Chem Comm 2003; 927-34.
[10] Cushing BL, Kolesnichenko VL, O'Conoor CJ. Recent advances in the liquid-phase syntheses of inorganic nanoparticles. Chem Rev 2004; 104: 3893-946.
[11] Jeong U, Teng X, Wang Y, Yang H, Xia Y. Superparamagnetic colloids: controlled synthesis and niche applications. Adv Mater 2007; 19: 33-60.
[12] Arruebo M, Pacheco RF, Ibara MR, Santamaria J. Magnetic nanoparticles for drug delivery. Nanotoday 2007; 2: 22. [13] Meinhart C, Wereley S, Santiago J. PIV measurements of a microchannel flow. Exp Fluids 1999; 27: 414-9.
[14] Lima R, Wada S, Tsubota K, Yamaguchi T. Confocal micro-PIV measurements of three dimensional profiles of cell suspension flow in a square microchannel. Meas Sci Technol 2006; 17: 797-808.
[15] Lima R. Analysis of the blood flow behavior through microchannels by a confocal micro-PIV/PTV system. PhD(Eng.), Bioengineering and Robotics Department, Tohoku University, Japan, 2007.
[16] Lima R, Ishikawa T, Imai Y, Takeda M, Wada S, Yamaguchi T. Radial dispersion of red blood cells in blood flowing through glass capillaries: role of heamatocrit and geometry. J Biomech 2008; 41: 2188-96.
[17] Lima R, Wada S, Tanaka S, et al. In vitro blood flow in a rectangular PDMS microchannel: experimental observations using a confocal micro-PIV system. Biomed Microdevices, 2008; 10, 2: 153-67.
[18] Fujiwara H, Ishikawa T, Lima R, et al. Red blood cell motions in a high hematocrit blood flowing through a stenosed micro-channel. J Biomech 2009; 42: 838-43.