Contents lists available atScienceDirect
Talanta
journal homepage:www.elsevier.com/locate/talanta
Polished silver solid amalgam electrode and cationic surfactant as tool in
electroanalytical determination of methomyl pesticide
Caio César Gonçalves Silva, Djenaine De Souza
⁎Laboratório de Eletroanalítica Aplicada a Biotecnologia e a Engenharia de Alimentos - LEABE, Campus de Patos de Minas, Instituto de Química, Universidade Federal de Uberlândia, Av. Getúlio Vargas, 230, Centro 38700−128, Patos de Minas, MG, Brazil
A R T I C L E I N F O
Keywords:
Polished silver solid amalgam electrode Cationic surfactant
Methomyl Endocrine disrupter Square wave voltammetry Natural water samples
A B S T R A C T
The polished silver solid amalgam electrode (p-AgSAE) combined with square wave voltammetry (SWV) was used in the development of an analytical procedure to Methomyl determination in natural water samples. The experimental and voltammetric parameters were optimized and the use of cationic surfactant cetyltrimethyl ammonium bromide promoted a considerable change in the kinetic and mechanism of the Methomyl reaction. Was observed the presence one-single reduction peak, related to a totally irreversible two-electrons transfer, followed by chemical reaction involving two protons. Analytical parameters (linearity range, analytical curve equations, correlation coefficient, detection and quantification limits, recovery efficiency, and relative standard deviation for intraday and interday experiments) were evaluated indicating that the proposed voltammetric procedure is suitable for determination of Methomyl. The application of the proposed procedure in natural water analysis indicated high robustness with only simplefiltration, without pre-concentration steps, good stability and suitable sensitivity to determination of Methomyl in natural water samples.
1. Introduction
Carbamate pesticides represent one of the chemical classes that have attracted most interest in the development of analytical methods for the monitoring their residues and their metabolites in surface and groundwater samples, soil and food[1,2]. The contamination by bamates promote a disrupt of thyroid functions by interaction of car-bamates with thyroid hormone receptor or thyroid binding proteins [3,4]. Some carbamates pesticides present anti-estrogenic activity in-terfering in reproductivity capacity, and other some carbamates can participate in the development of some types of cancer[5,6].
Among them, the Methomyl {S-methyl-N-[(methylcarbamoyl)oxy] thioacetimidate}, called here as MT, is used in agricultural practices as insecticide and nematicide, and chemically belongs to the family of carbamic acids compounds. Furthermore, MT is a principal metabolite in degradation process of other carbamates, including Thiodicarb, Alanicarb and Aldicarb[7]. MT is an endocrine disrupt compound due to modify the estrogen production, interfering in reproductive capacity, for this, is highly toxic to animals and humans[8]. So, its quantification in drinking water has a high scientific importance.
According to Environmental Protection Agency (EPA)[9], the se-paration and measurement of the MT in natural water can be realized by high-performance liquid chromatography coupled to ultraviolet
detector (HPLC/UV–Vis), producing a limited sensitivity due con-siderable interference from complex samples and low wavelengths used in carbamates detection. For this, the use of HPLC coupled to mass spectrometry has (HPLC-MS) become a suitable tool in environmental analysis of MT and other carbamates pesticides[10,11]. Gas chroma-tography coupled to mass spectrometry (GC-MS) has been reported as highly sensitivity MT analysis in water samples promoting additional selectivity and sensitivity[12,13].
However, the use of chromatographic requires the solid phase ex-traction (SPE) to reach limits of detection sufficient low for trace ana-lysis [14–16]. Nevertheless, SPE presents long time to analysis, are expensive due to consumption of organic solvents, and considerable volume of samples are necessary and mainly, only a small portion is injected onto the chromatographic column. For this, some non-chro-matographic techniques, such asfluorescence spectroscopy[17]and electrochemical [18,19] techniques also have been used in MT de-termination.
The use of biosensor based on acetylcholinesterase enzyme has been reported to MT analysis, however, the sensitivity is usually lower than obtained with the traditional chromatographic techniques, due to the reversible behavior of inhibition reaction of the acetylcholinesterase to acetylcholine promoted by MT[20,21].
Zappand co-workers[22]proposed the use of montmorillonite, a
https://doi.org/10.1016/j.talanta.2018.07.029
Received 14 May 2018; Received in revised form 9 July 2018; Accepted 11 July 2018 ⁎
Corresponding author.
E-mail address:djenaine@ufu.br(D. De Souza).
0039-9140/ © 2018 Elsevier B.V. All rights reserved.
clay mineral, modified by platinum nanoparticles and ionic liquid, as a support to Lacasse immobilization. This biosensor was used in MT de-termination in carrot and tomato samples, but was not used in natural water samples.Fernandesand co-workers[23]shown a sol-gel derived carbon ceramic biosensor for the determination of MT in vegetable extracts samples. The substrate used was the esculetin, that resulted in a decrease in enzymatic activity when fresh vegetable samples containing MT were added to the reaction medium. In this research, natural water samples also were not analyzed.
In these works, the analytical results were dandified by Lacasse immobilization method and by pH of the samples, by ionic strength and by content of the samples employed. It's occurred due to biocatalytic processes are complex and some components in the samples also may inhibit the enzymatic activity. So,Costaand co-workers[24]employed a boron doped diamond electrode to determination of MT in river water, tap water, and commercial formulations. However, the oxidation potential of MT presented value greater than 1.5 V, promoting inter-ference of other redox processes in complex samples.
According to our knowledge, until this moment, no work showing the use of others solid electrodes has been reported to electroanalytical determination of the MT. For this, the goal of this work was the de-velopment of reliable, fast, inexpensive and environmental friendly analytical procedure to MT determination in natural water using p-AgSAE allied to square wave voltammetry (SWV), an electroanalytical technique extremely sensitive in the pesticides detection[25,26]. 2. Experimental
2.1. Reagents and equipments
In this work, all chemicals employed presented high analytical purity and the solutions employed were prepared with water purified by a Gehaka model OS20 LX system (18.2 MΩcm−1 at 25 °C). MT
(99.50%) has obtained from Ouro Fino Agricultural Company, from Minas Gerais, Brazil, and used without purifications steps. The MT stock solutions were prepared by dissolving a suitable quantity of it in pure acetonitrile to obtain concentrations of 1.00 × 10⁻³
mol L−1
and 1.00 × 10⁻⁴mol L−1. To prevent degradation process, these solutions
were then stored in a darkflask and kept in a refrigerator.
H3PO4, H3BO3 and CH3COOH, in a concentration of the
0.04 mol L−1plus 0.1 mol L−1NaClO4were used to prepare the
Britton-Robinson (BR) buffer, which had the desired pH values adjusted by addition of the amounts of 1.0 mol L−1NaOH solution. The surfactant
cetyltrimethyl ammonium bromide (CTAB) was used in the con-centration from 1.00 × 10⁻⁵mol L−1to 1.00 × 10⁻³mol L−1, which
corresponds to critical micellar concentration (c.m.c.)[27].
A potentiostat (µAutolab, from Metrohm-Eco Chemie) coupled to NOVA software version 2.1.2 was used in voltammetric experiments. The pH values of the solutions were measured using a pH meter (mPA 210, from Tecnopon) equipped with a 3.00 mol L−1Ag/AgCl/KCl-glass combined electrode.
2.2. Electrochemical cell and working electrode
An electrochemical cell containing 10 mL of the BR buffer as sup-porting electrolyte, was used. A platinum wire and an Ag/AgCl 3.0 mol L−1electrode were used as auxiliary and as reference electrode, respectively, and a home-made p-AgSAE was used as working electrode. The p-AgSAE was constructed using a natural amalgamation pro-cess, according description presented in a previous works[28,29]. For this, 0.35 g analytical grade liquid mercury and 0.15 g of fine silver powder (particle size: 5–9 µm, purity: 99.90%, Sigma-Aldrich) were vigorously blended. The paste resulting was compacted inside a Pyrex® glass capillary tube with an inner diameter of about 0.30 mm. After 24 h, an electric contact was inserted by use a copper wire and silver adhesive. The resulting disks were polished with an emery paper (up to
2000 grit sandpaper, 3 M).
Subsequently, p-AgSAE was inserted in electrochemical cell con-taining 0.20 mol L−1KCl and the potential of the
−2.20 V was applied for 600 s under a stream of purified N2(White Martins). This procedure,
called as electrochemical activation, allowed a considerable reduction in the resistance to charge transfer and a consequent increase in the analytical responses, and ever is necessary before each day of experi-ments or after every delay of longer than one hour without use of the electrode [30]. Besides, between each voltammetric scan is applied −2.2 V for 30 s to removal of the adsorbed product reaction from the p-AgSAE[31,32].
2.3. Voltammetric experiments
Preliminary experiments were performed using 10 mL of the BR buffer in pH values from 2.0 to 12.0, plus 3.00 × 10⁻⁵mol L−1of MT
standard solutions in the electrochemical cell. Prior to each one, the solution was deaerated by bubbling in N2for 10 min. SWV experiments
were realized using scan potential from 0.00 V to −1.50 V at 26 ± 1 °C, with the pulse potential frequency (f) of 100 s−1, amplitude
of the pulse (a) of 50 mV and the height of the potential step (ΔEs) of 2 mV. These experiments were done with and without the use of CTAB surfactant to observe the effects of its addition in concentrations bellow, near and above its c.m.c[27].
The voltammetric parameters related do SWV (f,aandΔEs) were individually evaluated in relation to the maximum value of peak cur-rent (sensitivity) and the minimum half-peak width (selectivity) [25,26]. Besides, these parameters were used to evaluate the redox reaction mechanism of MT at p-AgSAE.
In this work, the experimental and voltammetric parameters were individually evaluated by analysis of resultant peak currents (Ip), the
peak potentials (Ep) and the variation in the half-peak width (ΔEp/2),
responsible by sensitivity and selectivity suitable in the voltammetric procedures.
After the experimental and voltammetric optimization, the analy-tical curves were constructed by the standard addition method. The detection and quantification limits (LOD and LOQ, respectively) were calculated according to guidelines recommended by IUPAC[33], using of the standard deviation of the mean current measured at the reduction potential of MT for 10 voltammograms of the blank solution in purified electrolyte (Sb) together with the slope of the straight line of the
ana-lytical curves (s).
The recovery experiments were done to attest the efficiency of the methodology. For this, a known amount of MT was added to the sup-porting electrolyte followed by the standard additions from the MT stock solution and plotting the resulting analytical curves. The recovery efficiencies (%R) were calculated considering the value of the percep-tual of the relationships between [MT]added and [MT]recovered, which
refer to the concentration of MT intentionally added in the electro-chemical cell, and the concentration obtained by extrapolating the analytical curves, respectively[34]. All measurements were performed in triplicate.
The precision of the proposed procedure was evaluated based on the reproducibility of experiments carried out usingfive different standard solutions of MT on five different days (interday). The accuracy was evaluated based on repeatability experiments that included ten re-plicated determinations in the same solution of MT (intraday). The relative standard deviations (RSD) were calculated for the reproduci-bility and repeatareproduci-bility measures, using the relationships between the standard deviation and the mean of the obtained peak current values [34].
2.4. Application of methodology
from complex samples, which were collected in the Paranaíba River, a local river located at Patos de Minas city, Minas Gerais state, Brazil. The samples used were:
a) Sample 1: collected in a local before the city limits (−18.6554°;−46.5128°) where the river is relatively free of the urban or industrial pollution and is located near agricultural areas that produce corn, soy, bean and coffee;
b) Sample 2: collected along the stream length (−18.6024°;−46.5405°), located around the urban area where the degree of pollution is high;
c) Sample 3: collected after the river crossing the city (−18.4983°; −46.5603°), thus containing a high degree of organic matter in-cluding agricultural, domestic and industrial residues, received throughout the city.
These samples werefiltrated in a 0.5 µm paperfilter to remove all particulate. After this, these samples were used to prepare the BR buffer solution in pH 9.0, by dissolution of the BR buffer components. The resultant solution was maintained in a refrigerator even its use. So, the evaluation of the robustness of the proposed procedure was realized using 100% of the samples in preparation of the supporting electrolyte, without any clean up or treatment steps, exception of the pre-liminaryfiltration to remove particulate in the samples.
10 mL of each sample was artificially contaminated with 3.00 × 10⁻⁷mol L−1of MT and the SWV experiments were performed.
The peak current values obtained were inserted in calibration curve equation, and the resultant concentrations were calculated and used to evaluate the effects of interferences present in these samples in the SWV responses from differences between the MT calculated values and MT added concentration in the electrochemical cell.
Recovery experiments were performed to attest the efficiency in the proposed procedure in natural water samples. For this, 10 mL of BR buffer prepared with each sample, was artificially contaminated by 3.00 × 10⁻⁷ mol L−1of MT and the standard addition method was
employed to performed recovery curves. All recovery calculations were realized similar to described early to pure BR buffer.
3. Results and discussion
3.1. Experimental parameters
Preliminarily, the electrochemical reduction of MT on the p-AgSAE was investigated in BR buffer with pH values adjusted from 2.0 to 12.0, and the SWV responses indicated that the increase in pH provoked an increase in Ip values until pH 4.0, after this value, the Ip had
con-siderable decrease. As the maximum value of Ipwas observed at BR
buffer adjusted for pH 4.0, which is lower than the pKareported in the
literature (pKa13.27)[35], is possible to affirm that, in this case, the
MT reduction occurs without participation of protonation equilibrium preceding the electrons transfer reaction. Additionally, in pH above 4.0, the responses were accompanied by an expressive change in the vol-tammetric profile, characterized by a higher variation inΔEp/2.
Besides, can be observed that in pH bellow 9.0 the Epdo not
how-ever seem to be affected by pH of medium, Ep remains practically
constant, confirming the absence of any protonation step in the electron transfer reaction. However, in pH above 9.0 the Epshifted to less
ne-gative values with increasing pH, which indicated that a transfer of protons was coupled to the reduction process[36]. The relationships between Epversus pH, presents two linear portions which can be
re-presented by equations:
= − −
Ep 0.963 0.007pH(First inclination) (1)
= − +
Ep 1.520 0.058pH(Second inclination) (2) where values of potential are given in volt. The intersection between
the inclinations occurred in pH values lower than the reported pKa
value of MT. Besides, the slope in second inclination is around 0.0592 V, typical values expected to redox reactions involving one electron and one proton transfer[36].
Further experiments were successively performed indicating a considerable Ip decrease, probably related to a strong products
ad-sorption of the redox process on the electrode surface. According to a previous work, the p-AgSAE is previously polarized applying−2.20 V and the use of CTAB, a non-electroactive surfactant with positive charge, can produce a thin layer at p-AgSAE surface promoting the stabilization of the voltammetric signal[28]. So, 1.00 × 10⁻⁵mol L−1
CTAB, below c.m.c (~ 9.2 × 10⁻⁴
mol L−1
) [27], was added in elec-trochemical cell and SWV experiments were performed in BR buffer with pH 4.0, 6.0 and 9.0.
The comparison between the voltammetric responses without (Fig. 1a) and with (Fig. 1b) CTAB addition indicated that the voltam-metric behavior of MT was considerably altered in CTAB medium, and the intensities in these alterations were related to the pH of BR buffer, confirming that considerable effects occurred on the mechanisms and kinetics of electron transfer occurred. In addition, the use of CTAB promoted a considerable dislodgment in Ep to less negative values,
which is related to a lower energy to redox process and more favorable redox potential, despite the decrease in Ipvalues.
New experiments were performed using BR buffer in pH values from 2.0 to 12.0 with 1.00 × 10⁻⁴
mol L−1
of CTAB and 3.00 × 10⁻⁵
mol L−1 of MT, presented in Fig. 2a, where can be observed a
sig-nificant increase in Ipvalues when pH was increased, with a maximum
Ipin pH 9.0, above this value the Ipdecreased. Besides, the Epshifts Fig. 1.Square wave voltammograms for reduction of the 3.00 × 10⁻⁵mol L−1 of MT at p-AgSAE using 0.04 mol L−1of BR bu
towards more negative values as the pH increases until pH 9.0, char-acteristic of the reactions involving protons during electrons transfer reaction. After pH 9.0, the Epwas independent of pH values, indicating
that the MT reduction occurs only by electrons transfer, without
protons involving. These behaviors confirmed the change in redox mechanisms after the CTAB addition.
The relationship between Epand pH values,Fig. 2b, shown a linear
dependence, represented by two straight lines described by following equations:
= − −
Ep 0.291 0.0336pH(First inclination) (3)
= − +
Ep 0.729 0.007pH(Second inclination) (4) where values of potential are given in volts.
The almost vertical line observed in pH values bellow 9.0 (Eq.(3)) indicated that occurs a redox equilibrium involving both protons and electrons. Additionally, comparison between the theoretical value predict to Nernst Equation, Eq.(5), thefirst inclination of the 0.0336 V by pH unit can be related to a redox reaction involving one protons and two electrons, in determining step of the redox mechanism, as initially proposed in Eq.(6).
= − ⎛
⎝ ⎞⎠ +
E E 0 0592 H
n pH
.
p 0
(5) where H+is number of the protons involved in the reaction and the n is electrons number[37].
+ −+ +→ +x
MTOX 2e 1H MTRED H O2 (6)
Eq.(4)is represented by a horizontal line, with inclination only 0.007 V by pH unit, probably related to the electrons transfers without involvement of protons. Besides the values of pH where occurs the in-terception of two straight lines represent equilibrium between the MT protonated and MT non-protonated and is lower than the value of pKa
reported in literature[35]. On the base of these results, the pH 9.0 was chosen for further analysis.
By analysis of MT structure, MT present 1 group donor of protons and four group acceptors of protons. This way is probable that in pH < pKaoccurs the liberation of one proton (Eq.(7)), a chemical step,
and in pH > pKaoccurs the reception of protons (Eq.(8)), both
fol-lowed by electrons transfer[38]. ⇄ −+H+
MT MT (7)
+H+⇄ +
MT MTH (8)
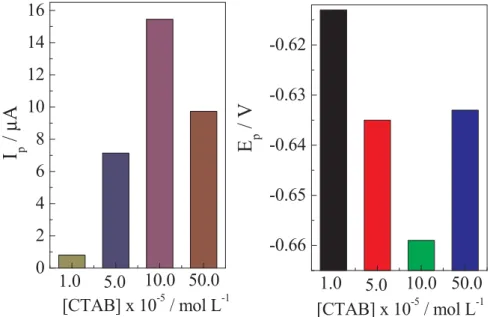
The effects of CTAB addition was evaluated using concentrations from 1.00 × 10⁻⁵ to 5.00 × 10⁻⁴ mol L−1 of CTBA, and I
p and Ep
values obtained were shown inFig. 3. The differences observed in Ip Fig. 2.(a) Square wave voltammograms for reduction of the 3.00 × 10⁻⁵
mol L−1
of MT at p-AgSAE in 0.04 mol L−1
of BR buffer pH 9.0 and 1.00 × 10⁻⁴mol L−1of CTAB, witha= 50 mV,∆E
s= 2 mV andƒ= 100 s−1. (b) Relationships between peak current and peak potential versus pH obtained from square wave voltammograms presented in (a).
were related to dependence of the amount CTAB adsorbed onto the p-AgSAE. Probably, the CTAB was adsorbed due to the electrostatic at-traction between the charged head group of the surfactant and the opposite charge of the p-AgSAE previously polarized. In CTAB con-centrations bellow c.m.c. there is no interaction between the CTAB molecules either solution on solid surface.
Additionally, the CTAB concentrations near the c.m.c. can form full coverage aggregates in electrode surface, increasing the electrons transfers resistance and reducing the analytical sensitivity[27]. So, in this work, the increase in CTAB concentration initially promotes the CTAB adsorption and a little interaction of between each CTAB mole-cule. The increase in CTAB concentration, adsorption also increases, and aggregates begin to form in p-AgSAE surface, which decrease the Ip
e increase Epvalues. So, 1.00 × 10⁻⁴mol L−1of CTBA was chosen to
subsequently experiments.
CTAB effects can be demonstrated byGraphical Abstract. In absence of CTAB, the p-AgSAE presents a negative charge from polarization at −2.2 V, and in pH < pKa the MT deprotonated presented similar
charge of the p-AgSAE, occurring an electrostatic repulsion and pro-ducing higher Ep values. However, after the CTAB addition, in low
concentration, thefirst stage of the adsorption from solution is thought to result from neutralization of the surface of the p-AgSAE minimizing the electrostatic repulsion between MT and p-AgSAE and for this, de-creasing the Epto reactions.
3.2. Voltammetric parameters and electrochemical behavior
Using BR buffer (pH 9.0), 1.00 × 10⁻⁴mol L−1of CTAB solution and 5.00 × 10⁻⁷mol L−1of MT in electrochemical cell, SWV
experi-ments were conducted for the determination of voltammetric para-metersf,aandΔEsthat promote the acquisition of best analytical signal
in terms of Ip, EpandΔE1/2. So, theΔEs, was variated from 2 to 10 mV
and SWV responses shown that the increase in ΔEspromoted an
in-crease in the Ipsignal without linear dependence between IpandΔEs, which, according to SWV theory[25,26], is typical of the voltammetric responses in reactions involving reactants and/or products adsorbed on the electrode surface. Additionally, this Ipincrease was accompanied by
a widening of the peak diminishing the selectivity of the analysis, so 2 mV was used in subsequent experiments.
Theavalues was considered from 5 to 50 mV and SWV responses demonstrated that an increase inapromoted a linear increase in the Ip
values, without considerable shift in Epor in theΔE1/2, typical behavior
of totally irreversible redox process. Also, it was concluded that the best value ofawhich MT can be detected is 50 mV.
Thefvalue was changed from 10 to 250 s−1, which is in the near the
maximum values permitted by equipment used in this work. The var-iations in the fpromoted proportional increases of the Ipand a fast
displacement of the Epto more negative values. Thus, the relationships
between Ipandfvalues were directly proportional tof, indicating a
redox process involving reagent adsorption and/or product adsorption as the rate determining step[25]. Besides, it was possible to observe that the Ipincreased linearly withfvalues until 100 s−1without signal
distortions. Thus, in further experiments the value employed to assure the maximum sensitivity was 100 s−1.
The analysis of forward (If), backward (Ib) and resultant (Ir)
com-ponents of currents in SWV were used to obtain mechanistic informa-tion of electrochemical process. These components of current were evaluated in differentfbecause their values change the time scale and the apparent reversibility electrode kinetic. So, by SWV responses, can be observed a single sharp Irand the presence of If and Ib current
components, with the Ifpresenting values higher than obtained for Ib
component. The precise shape and location of components currents is function offvalues employed.
As occur a decrease in the ratio Ib/Ifand decreased in the separation
between forward and backward peaks by the increase in fvalues, is possible to consider that the kinetic of MT reduction is very slow.
Besides, the considerable asymmetry between If and Ib was an
in-dicative that occurs an irreversible or quasi-reversible redox process. As the theoretical models of SWV[25]were used to confirm the nature of redox process, which a quasi-reversible electron transfer, the ratio of the Ipand the correspondingfplotted as the function of thefpresent a
parabolically profile, and occurs a maximum called as“quasi-reversible maximum”, thus, this relationship was evaluated to MT. However, the responses obtained shown never maximum present, confirming that reaction is irreversible, under voltammetric conditions employed. This irreversible nature of MT redox process also was confirmed by cyclic voltammetry experiments, which are characterized by absence of anodic voltammetric peak in opposite scan potential, data not shown.
To MT reaction on the p-AgSAE, the Ifcomponent corresponds to
the reduction of reactant and the Ib component corresponds to the
oxidation of product. The oxidation process was restricted by a deep diffusion layer of the product that is developed during the scan from 0.0 to−1.2 V, and the backward responses correspond to a reduction re-action. So, the electrochemical behavior of MT corresponds to a totally irreversible reduction and the backward component, in this potential range, is also the reduction current, from a slow diffusion process and a slow electron transfer[25].
The MT reaction also was evaluated using the analysis of the re-lationship between Epandfvalues, where was observed that the Ep
values shift towards more negative values by increase inf, typical of totally irreversible redox process. Additionally, the Ep values are
varying linearly with the logarithmic value of thefaccording to: =−
∆E
∆ f
RT αnF
log( ) 2.3 p
(9) where R is the gas constant; T is the temperature; αis the electron transfer coefficient; n is the number of electrons; and F is the Faraday constant. From Eq.(9), a plot ofΔEpvsΔlog (f) gives a straight-line
curve, with a slope of the 106.1, which correspond toαn values. Con-sideringα= 0.5, and substituting the known values ofR,F, andT, the room temperature, into the right-hand side of Eq.(9), and the known value of the slope, n was determined to be equal to 1, in the de-termining step of the reduction process, called as slow step.
Based on the above-mentioned results, in conjunction with in-formation in literature reports[28,39]allied to structure of MT mole-cule, we believe that probably, in the experimental and voltammetric conditions employed in this work, the electro-reduction of imide group is the most favorable that carbonyl group reduction. So, the possible mechanism for the reduction of MT involves a slow one-electron re-duction of imide group producing a radical anion. The heteroatom N contributes to the stability of the electrochemically generated radical, which immediately abstract protons from the solution, as demonstrated inFig. 4. So, the reaction occurred in two irreversible steps, one elec-trochemical involving two-electron transfer, followed by a chemical step involving two-protons.
3.3. Analytical curves
Using the optimized parameters described early, analytical curves was constructed for the range of concentration values from 1.00 × 10⁻⁷
mol L−1
to 1.00 × 10⁻⁶
mol L−1
. For this, aliquots from the MT stock solutions were consecutively added into the electro-chemical cell containing 10 mL of the BR buffer and CTAB, and SWV experiments were performed.
The SWV results showed a proportional increase in Ipwith the
in-crease of the concentration of MT, without displacement in Ep,
con-firming that not occur adsorption of the products reaction. In this step, three analytical curves were constructed, and the results were used in the calculus of analytical parameters, which represent a medium of the all obtained analytical curves.
validate the proposed methodology to analysis of MT. The concentra-tion range, which demonstrate the concentraconcentra-tions values where the Ip
increase proportionally by concentration added and correlation coeffi-cient (r), which determines the degree of linearity between the con-centration of MT and analytical responses, were initially evaluated. Besides, the standard deviation of the arithmetic means of ten blank solutions for SWV experiments (Sb), the slope of the analytical curve (s),
the detection limit (LOD), and the quantification limit (LOQ), repeat-ability, reproducibility and recovery values in supporting electrolyte were calculated and are presented inTable 1, which will be discussed below.
The relationships between Ipand MT concentrations added can be
represented by:
= − ∓ − + ∓ −
I Ap( ) 8.01 10 ( 3.20 10 )x 7 x 7 16.28( 0.60)[MT](molL1) (10) which presented a correlation coefficient of 0.9958. The linearity in-formation was evaluated by analysis of the correlation coefficient (r), presented a value of the 0.9958, which is considered evidence of ac-ceptablefit of the data to the regression line (r > 0.99)[34].
The sensitivity of the proposed procedure was evaluated by analysis of the LOD and LOQ values, which were calculated as described in the Section 2. So, ten replicate blanks were analyzed to calculate the mean value of the Iprelated to the Epvalue to reduce the MT and the standard
deviation of its values. The LOD and LOQ were individually calculated and the obtained values were 3.09 × 10⁻⁸mol L−1(5.01 µg L−1, ppb)
and 1.03 × 10⁻⁷mol L−1(16.7 µg L−1, ppb), respectively.
These LOD and LOQ values are lower than those obtained by other works that employed Laccase enzyme inhibition responses[22,23]and boron doped diamond electrode[24]. Besides, the sensitivity presented in this work was very close to those obtained by use of traditional chromatographic techniques allied to solid phase extraction [9–16]. This way, the proposed procedure using p-AgSAE allied to CTAB
addition and SWV as analytical technique is an adequate, fast, and sensitivity methodology and can be used to analysis of ultra-trace of MT in complex samples.
All results in this work shown that p-AgSAE presents the great ad-vantages of minimizing adsorptive problems related to the use of solid surfaces and the inactivation of immobilized enzymes related to the biosensor uses. Additionally, the LOD and LOQ values calculated in the present work are satisfactory as they are lower than the maximum values allowed by CONAMA (the National Counsel for the Environment
–Brazil) for wastewaters, i.e., 10μg L−1(10.0 ppb)[40].
The precision was evaluated from data of the reproducibility and repeatability using multiple SWV experiments with 5.00 × 10⁻⁷
mol L−1MT and previously optimized parameter. The reproducibility
calculus includedfive different measurements in different solutions at various days (interday precision) and the RSD was 5.60%. The repeat-ability experiments included ten subsequent experiments performed in the same solution and at the same time (intradayprecision) and the RSD calculate was 2.20%. Both RSD were calculated as described in the Section 2and obtained values are indicative of the good precision of the proposed methodology.
Recovery curve was used to evaluate the accuracy of proposed procedure and were constructed by spiking a known concentration of the MT (3.00 × 10⁻⁷mol L−1, [MT]
added), either supporting electrolyte
and evaluating the voltammetric responses by the standard addition method [41]. The recovery percentages were used to evaluate and quantify the MT that was added. In this way, the recovery concentra-tion ([MT]recovered) was identified graphically, with the abscissa axis
denoting the concentration of Methomyl in the electrochemical cell. Extrapolating the curve along this axis yields the spiked concentration, allowing for the calculation of the recovery values (%R), as shown in Eq.(12):
Fig. 4.Mechanism proposed to MT reduction process at p-AgSAE.
Table 1
Analytical parameters for the determination of MT in BR buffer on p-AgSAE, where r: correlation coefficient; Sb: standard deviations of the arithmetic mean of ten blank solutions; s: slope of the analytical curves; LOD: detection limits and LOQ: quantification limits.
Parameter This work Lacasse biosensor[23] DDB[25]
Concentration range (mol L−1) 1.00 × 10⁻⁷to 1.00 × 10⁻⁶ 9.80 × 10⁻⁷to 9.00 × 10⁻⁶ 6.60 × 10⁻⁶to 4.10 × 10⁻⁴
r 0.9958 0.9993 0.9934
s (A / mol L−1) 16.3 NR 0.20
Sb(A) 1.68 × 10⁻⁷ NR NR
LOD (mol L−1) 3.09 × 10⁻⁸(5.01 µg L−1) 2.35 × 10⁻⁷(38.1 µg L−1) 1.90 × 10⁻⁵(3.10 mg L−1)
LOQ (mol L−1) 1.03 × 10⁻⁷(16.7 µg L−1) 7.80 × 10⁻⁷(126 µg L−1) 6.30 × 10⁻⁵(10.2 mg L−1)
Repeatability (%) 1.49 2.10 2.50
Reproducibility (%) 5.62 4.40 3.40
Recovery (%) 100.2 (electrolyte) 105.9 (tomato) 79.2 (tap water)
= %R [MT]
[MT] x100 recovered
added (12)
Recovery curve also was evaluated in triplicate, using three dif-ferent solutions of BR buffer. The average concentration recovered was 3.01 × 10⁻⁷mol L−1and the %R calculated was 100.2%. These results
shown that the proposed procedure to be in a suitable range for ana-lytical applications, which are acceptable values from 70% to 130% for recovery percentages[41], indicating that the present methodology can be successfully applied to the analytical detection of MT in complex samples, such as, natural waters.
3.4. Analytical applications
This proposed procedure was applied in natural water samples collected in three different points in a river located at Patos de Minas, Minas Gerais state, as described in theSection 2. The collecting points were selected based on the different levels of organic matter, including industrial and domestic pollution. The water samples were used, as received, with only onefiltration step having been previously carried out to prepare 0.04 mol L−1BR buffer, which was the pH adjusted to
9.0.
Preliminarily each sample was contaminated by 3.00 × 10⁻⁷
mol L−1of MT and SWV experiments were performed. In each sample,
the Ipobtained was added in Eq.(10)and resultant MT concentration
calculated, called were as [MT]found. The difference observed between
MT concentrations measured and MT concentration intentionally spiked, could be used to evaluate the level of contamination of the samples by MT residues.
However, as the samples were employed without pretreatment or purification steps, these responses also can be related to other organic and inorganic compound presents in these samples, which could be reduced at around the Epof MT, and this way, to interfere in analytical
responses. To confirm this suspicion, recovery curves were constructed in these samples, similar to effectuated in electrolyte support. The re-covery values calculated are shown inTable 2.
The quantity of MT in each natural water sample ([MT]found) was
calculated from difference between the spiked intentionally (3.00 × 10⁻⁷mol L−1) and the values obtained from the use of cali-bration and recovery curves. The dates showed inTable 2, indicate that the [MT]found from calibration curves presented values higher than
obtained by recovery curves, either the components of the natural water contributed to the analytical responses. The use of recovery curves promotes the interference elimination, by use of addition stan-dard method, which, the only effects due to MT addition is measured. Thus, the [MT]foundfrom recovery curves, probably, are related to a real
contamination of the natural water by MT which is employed in agri-cultural practices around the local of the collect of the samples.
So, by analysis of recovery values calculated, it is possible to con-firm that the proposed procedure has therefore proven to be applicable for use in complex samples, such as natural water. The values [MT]found
calculated indicated that the proposed procedure presented a high ro-bustness, with suitable recovery in 100% of the interference, since these samples no were previously clean up or pre-concentrates.
4. Conclusions
The square wave voltammetric responses of MT pesticide on the p-AgSAE showed the presence of one well-defined voltammetric peak towards the negative sweep direction, which the Ep values were
strongly dependent of pH of the medium. The use of CTAB promoted a considerable change in the kinetic and mechanism of the redox reac-tion, for this the CTAB concentration was previously optimized.
The best voltammetric responses were obtained in 0.04 mol L−1BR
buffer pH 9.0 solution on the p-AgSAE, with 1.00 × 10⁻⁴
mol L−1
of CTAB,f= 100 s−1,a= 50 mV,ΔEs= 2 mV. Analysis of a purified la-boratory electrolyte using the p-AgSAE allowed for a very low detection limit of 5.008μg L−1associated with a high level of repeatability and
reproducibility. The analytical sensitivity is comparable to results pre-viously published using high performance liquid chromatographic coupled to ultraviolet/visible detector, with a previously solid phase extraction step, and lowers than electroanalytical data obtained using biosensor.
After the optimization of the experimental and voltammetric para-meters was observed that the redox process is related to an irreversible redox reaction, controlled by adsorption, involving two-electron transfer of imide group, producing a radical anion, which immediately abstract protons from the solution.
The application of the proposed procedure in MT analysis in natural water samples, using the calibration and recovery curves, to determine MT concentration led to very coherent results, indicating that the proposed electroanalytical procedure is an important tool to detect MT residues in small concentrations, without pre-treatment of the samples and/or pre-concentration steps. This method provides information about the redox mechanism, which is of considerable importance since it allows for a better understanding of the MT behavior in the en-vironment and of the possible interferences in the application of this procedure in others complex samples.
Finally, this work demonstrated that the p-AgSAE can be considered an environmentally friendly tool and a very interesting alternative for mechanistic studies and the analytical determination of MT and could be applied to other carbamates analysis in natural waters.
Acknowledgements
The authors acknowledge the financial support from FAPEMIG (proc. APQ 02052-12 and APQ 02528-14) and PROPP-UFU. C. C. G. Silva also wishes to thank FAPEMIG for the scholarship. This work is a collaboration research project of members of the Rede Mineira de Química (RQ-MG) supported by FAPEMIG (Project: REDE-113/10; Project: CEX - RED-00010-14)
References
[1] N.S. Pano-Farias, S.G. Ceballos-Magaña, R. Muñiz-Valencia, J.M. Jurado, A. Alcázar, Direct immersion single drop micro-extraction method for multi-class pesticides analysis in mango using GC-MS, Food Chem. 237 (2017) 30–38. [2] Q. Lu, T. Zhou, Y. Wang, L. Gong, J. Liu, Transformation from gold nanoclusters to
plasmonic nanoparticles: a general strategy towards selective detection of organo-phosphorothioate pesticides, Biosens. Bioelectron. 99 (2017) 274–280. [3] R.C. Gupta, Toxicology of Organophosphate and Carbamate Pesticide, Academic
Press, USA, 2005.
[4] M. Boas, U. Feldt-Rasmussen, K.M. Main, Thyroid effects of endocrine disrupting chemicals, Mol. Cell. Endocrinol. 355 (2012) 240–248.
[5] I. Dhouib, M. Jallouli, A. Annabi, S. Marzouki, N. Gharbi, S. Elfazaa, M.M. Lasram, From immunotoxicity to carcinogenicity: the effects of carbamate pesticides on the immune system, Environ. Sci. Pollut. Res. 23 (2016) 9448–9459.
[6] I. Dhouib, A. Annabi, M. Jallouli, S. Marzouki, N. Gharbi, S. Elfazaa, M. Mr Lasram, Carbamates pesticides induced immunotoxicity and carcinogenicity in human: a review, J. Appl. Biomed. 14 (2016) 85–90.
Table 2
Analytical parameters obtained in natural water samples for MT detection using p-AgSAE combined with SWV. The same parameter evaluated in supporting electrolyte. All data were evaluated using medium values from three analytical and recovery curves.
Sample From
Calibration Curves
From Recovery Curves
[MT]calculated (mol L−1)
[MT]recovered (mol L−1)
Recovery(%) [MT]calculated (mol L−1)
1 8.90 × 10⁻⁷ 3.70 × 10⁻⁷ 123.3 3.08 × 10⁻⁷
2 2.73 × 10⁻⁶ 3.03 × 10⁻⁷ 101.0 3.01 × 10⁻⁷
[7] FAO-ONU, Pesticides Residues in Food, Stylus Pub Llc, U.S.A., 1985.
[8] W. Mnif, A.I.H. Hassine, A. Bouaziz, A. Bartegi, O. Thomas, B. Roig, Effect of en-docrine disruptor pesticides: a review, Int. J. Environ. Res. Public Health 8 (2011) 2265–2303.
[9] EPA, Environmental Protection Agency. Method 632: The determination of carba-mate and urea pesticides in municipal and industrial wastewater. in:〈https://www. epa.gov/sites/production/files/2015-10/documents/method_632_1992.pdf〉. November, 2017.
[10] C. Crescenzi, A. Di Corcia, E. Guerriero, R. Samperi, Development of a multiresidue method for analyzing pesticide traces in water based on solid-phase extraction and electrospray liquid chromatography mass spectrometry, Environ. Sci. Technol. 31 (1997) 479–488.
[11] T. Benijts, W. Lambert, A. De Leenheer, Analysis of multiple endocrine disruptors in environmental waters via wide-spectrum solid-phase extraction and dual-polarity ionization LC-Ion Trap-MS/MS, Anal. Chem. 76 (2004) 704–711.
[12] H. Chena, R. Chena, S. Li, Low-density extraction solvent-based solvent terminated dispersive liquid–liquid microextraction combined with gas chromatography-tandem mass spectrometry for the determination of carbamate pesticides in water samples, J. Chromatogr. A 1217 (2010) 1244–1248.
[13] M. Saraji, N. Esteki, Analysis of carbamate pesticides in water samples using single-drop microextraction and gas chromatography–mass spectrometry, Anal. Bioanal. Chem. 391 (2008) 1091–1100.
[14] D. Barceló, Environmental Protection Agency and other methods for the determi-nation of priority pesticides and their transformation products in water, J. Chromatogr. A 643 (1993) 117–143.
[15] J.M. Soriano, B. Jiménez, G. Font, J.C. Moltó, Analysis of carbamate pesticides and their metabolites in water by solid phase extraction and liquid chromatography: a review, Crit. Rev. Anal. Chem. 31 (2001) 19–52.
[16] S. Chiron, A.F. Alba, D. Barceló, Comparison of on-line solid-phase disk extraction to liquid-liquid extraction for monitoring selected pesticides in environmental waters, Environ. Sci. Technol. 27 (1993) 2352–2359.
[17] H.A. Azab, A. Duerkop, E.M. Saad, F.K. Awad, R.M. Abd El Aal, R.M. Kamel, A novel luminescent terbium-3-carboxycoumarin probe for time-resolvedfluorescence sensing of pesticides methomyl, aldicarb and prometryne, Spectrochim. Acta Part A: Mol. Biomol. Spectrosc. 97 (2012) 915–922.
[18] D. Akyüz, T. Keles, Z. Biyiklioglu, A. Koca, Electrochemical pesticide sensors based on electropolymerized metallophthalocyanines, J. Electroanal. Chem. 804 (2017) 53–63.
[19] A. Hildebrandt, R. Bragos, S. Lacorte, J.L. Marty, Performance of a portable bio-sensor for the analysis of organophosphorus and carbamate insecticides in water and food, Sens. Actuators B: Chem. 133 (2008) 195–201.
[20] A. Amine, F. Arduini, D. Moscone, G. Palleschi, Recent advances in biosensors based on enzyme inhibition, Biosens. Bioelectron. 76 (2016) 180–194.
[21] J. Caetano, D.C. Dragunski, V.A. Pedrosa, S.A.S. Machado, Quantification of methomyl levels in cabbage, tomato, and soya milk using a renewable ampero-metric biosensor, Int. J. Electrochem. Sci. 88 (2013) 7795–7805.
[22] E. Zapp, D. Brondani, I.C. Vieira, C.W. Scheeren, J. Dupont, A.M.J. Barbosa, V.S. Ferreira, Biomonitoring of methomyl pesticide by laccase inhibition on sensor containing platinum nanoparticles in ionic liquid phase supported in montmor-illonite, Sens. Actuators B: Chem. 155 (2011) 331–339.
[23] S.C. Fernandes, I.C. Vieira, A.M.J. Barbosa, V.S. Ferreira, Methomyl detection by inhibition of laccase using a carbon ceramic biosensor, Electroanalysis 23 (2011) 1623–1630.
[24] D.J.E. Costa, J.C.S. Santos, F.A.C. Sanches-Brandão, W.F. Ribeiro, G.R. Salazar-Banda, M.C.U. Araujo, Boron-doped diamond electrode acting as a voltammetric sensor for the detection of methomyl pesticide, J. Electroanal. Chem. 789 (2017) 100–107.
[25] V. Mirceski, S. Komorsky-Lovric,Square Wave Voltammetry:Theory and Applications, Springer, Berlim, 2007.
[26] D. De Souza, L. Codognoto, A.R. Malagutti, R.A. Toledo, V.A. Pedrosa, R.T.S. Oliveira, L.H. Mazo, L.A. Avaca, S.A.S. Machado, Square wave voltammetry: second part, Appl. Quim. Nova 27 (2004) 790.
[27] J.F. Rusling, Electrochemistry in micelles microemulsions, and related micro-heterogeneousfluids, in: A.J. Bard (Ed.), Eletroanalytical Chemistry: A Series of Advances, 18 Marcel Dekker, Texas, 1994, p. 80.
[28] L.M. Silva, D. De Souza, Ziram herbicide determination using a polished silver solid amalgam electrode, Electrochim. Acta 224 (2017) 541–550.
[29] D. De Souza, L.C. Melo, A.N. Correia, P. Lima-Neto, O. Fatibello-Filho, L.H. Mascaro, Utilização de eletrodos sólidos de amálgama para a determinação analítica de compostos orgânicos e inorgânicos, Quím. Nova 34 (2011) 487–496. [30] B. Yosypchuk, J. Barek, Analytical applications of solid and paste amalgam
elec-trodes, Crit. Rev. Anal. Chem. 39 (2009) 189–203.
[31] D. De Souza, L.H. Mascaro, O. Fatibello-Filho, The effect of composition of solid silver amalgam electrodes on their electrochemical response, J. Solid State Electrochem. 15 (2010) 2023–2029.
[32] F.W.P. Ribeiro, G.L.F. Mendonça, J.E.S. Soares, V.N. Freire, D. De Souza, P.N.S. Casciano, P. Lima-Netoa, A.N. Correia, Exploiting the reduction of haloper-idol: electrochemical and computational studies using silver amalgam and HMDE electrodes, Electrochim. Acta 137 (2014) 564–574.
[33] J. Mocak, A.M. Bond, S. Mitchell, G. Scollary, A statistical overview of standard (IUPAC and ACS) and new procedures for determining the limits of detection and quantification: application to voltammetric and stripping techniques (Technical Report), Pure Appl. Chem. 69 (1997) 297–328.
[34] G.D. Christian, Analytical Chemistry, 6th ed., John Wiley & Sons, Canada, 2004. [35] J.B. Kanaak, G. Ware (Ed.), Reviews of Environmental Contamination and
Toxicology, Springer, Berlin, 2010.
[36] R.G. Compton, C.E. Banks, Understanding Voltammetry, World Scientific, London, 2007.
[37] Z. Galus, Fundamentals of Electrochemical Analysis, Polish Scientific Publishers, Warszawa, 1994.
[38] J.O.M. Bockris, A.K.N. Reddy, M. Gamboa-Aldeco, Modern Electrochemistry, Spring Street, New York, 2000.
[39] A.J. Fry, Synthetic Organic Electrochemistry, 2nd ed., John Wiley & Sons, Canada, 1989.
[40] Conselho Nacional do Meio Ambiente (CONAMA - Environmental National Council in Brazil)〈http://www.aga-ambiental.com.br/leis/resolucaoconama20-86.doc〉
(Accessed March 2016)〈http://www.mma.gov.br/port/conama/res/res86/ res2086.html〉.