Article
J. Braz. Chem. Soc., Vol. 25, No. 1, 161-168, 2014. Printed in Brazil - ©2014 Sociedade Brasileira de Química
0103 - 5053 $6.00+0.00
A
*e-mail: [email protected]
Method Validation for Simultaneous Determination of Cholesterol and Cholesterol
Oxides in Milk by RP-HPLC-DAD
Luciana C. Bauer,a Débora de A. Santana,b Marianne dos S. Macedo,b
Alexandre G. Torres,c Nilson E. de Souzad and Julliana I. Simionato*,a,d
aGraduate Program in Food Engineering and bBasic and Instrumental Studies Department,
University of Southwest Bahia (UESB), Itapetinga-BA, Brazil
cInstitute of Chemistry - Graduate Program in Food Science - Federal University of Rio de Janeiro
(UFRJ), Rio de Janeiro-RJ, Brazil
dFederal Technological University of Paraná (UTFPR), Londrina-PR, Brazil
O escopo da presente pesquisa foi desenvolver e validar uma metodologia para extração simultânea de colesterol e óxidos de colesterol utilizando saponificação direta em amostras de leite fluido para posterior análise por cromatografia líquida de alta eficiência em fase reversa com detecção por arranjo de diodos (RP-HPLC-DAD). Foram avaliados os parâmetros analíticos de seletividade, linearidade e faixa de aplicação, precisão inter e intradia, recuperação, limites de detecção e quantificação do método. Os resultados demonstraram que a metodologia pode ser empregada com segurança e confiabilidade para análise do colesterol e óxidos do leite.
The aim of the present work was to develop and validate a reversed-phase highperformance liquid chromatography with diode array detection (RP-HPLC-DAD) method for determination of cholesterol and cholesterol oxides extracted from milk samples. The method consisted of direct samples saponification and analytes extraction, followed by their determination using RP-HPLC-DAD. Suitable analytical selectivity, linearity and range of application, intra-assay and intermediary precision, recovery, detection and quantification limits (LOD and LOQ) were achieved and, the results showed that the developed RP-HPLC-DAD method can be applied to routine determination of cholesterol and cholesterol oxides in milk samples.
Keywords: direct saponification, 7-ketocholesterol, 25-hydroxycholesterol, liquid chromatography, dairy fat
Introduction
Cholesterol is a natural steroidal lipid present in animal fats responsible for several functions in mammals. Cholesterol is essential to mammalian cell membrane structure and function, it is a substrate for the synthesis of bile acids and steroid hormones.1 Although it is essential
to humans, high blood levels of cholesterol can increase the risk of development of several diseases, including hypertension, atherosclerosis myocardial infarction, and stroke.2
Generally, most part of the cholesterol in the human organism is produced endogenously, and approximately
30% is obtained by dietary intake (exogenous cholesterol) coming from foods of animal origin, such as eggs, meats, milk and whole-fat dairy products. The amount of cholesterol obtained by dietary intake depends on the habitual diet and, an elevated intake of animal fats leads to high levels of cholesterol intake and, consequently, to high blood levels of cholesterol.3,4 Consequently, dietary intake
of cholesterol must be controlled both at the individual and the population levels.
temperature, radiation, free radicals, and metallic ions, among others.5 Cholesterol oxidation products
(COP) can be deleterious to human health as can be responsible by atherogenic, cytotoxic, carcinogenic and mutagenic properties.6 In addition, COP are potent
inhibitors of cholesterol synthesis and they are associated to inflammatory processes, such as those observed in rheumatic arthritis and degenerative diseases as Parkinson’s and Alzheimer’s.
Concerning determination of cholesterol and cholesterol oxides in food, gas chromatography (GC) has been the most used technique. However, quantitative GC determination of cholesterol and COP requires purification steps, and tricky derivatization (silylation) to avoid artifact peaks and to improve the stability of the analytes. Thus, GC have been slowly replaced by other methods,7 since even when carefully executed, cholesterol
and COP can suffer thermolysis leading to the formation of artifacts.8 The most common artifacts are oxides that
are originated during the preparation and/or determination steps, resulting in overestimation of the COP contents in the samples.9
To our knowledge, most of the recently published papers on quantitative determination of cholesterol and cholesterol oxides exploits high performance liquid-chromatography (HPLC).10,11 In spite of some
drawbacks, such as elevated volumes of solvents and limits of detection and of quantification, sample preparation is simple and required small number of steps; basically saponification and the choice of extraction solvents are needed for adequate separation and quantification of analytes by HPLC.
Additionally, HPLC usually does not need high temperatures during the determination, minimizing degradations, which results in a higher recovery of analytes and in a limited or no formation of artifacts.12 Because
of potential deleterious health effects of cholesterol and COP’s intake, the aim of the present work was to develop and validate a reversed-phase HPLC with diode array detector (RP-HPLC-DAD) method for the simultaneous determination of cholesterol and COP’s (7-ketocholesterol and 25-hydroxycholesterol) in whole milk.
Experimental
Sampling
Twelve milk samples were analyzed, collected by manual milking of crossbred Holstein x Gir cows from the Campus of Itapetinga-BA of the State University of Southwest Bahia.
Simultaneous extraction of cholesterol and cholesterol oxides from fluid milk
After various tests to verify the best conditions to extract cholesterol and the oxides (7-ketocholesterol and 25-hydroxycholesterol), the extraction was performed in duplicate by direct saponification and posterior extraction with hexane, according to Saldanha et al.13 with
modifications on the type and time of saponification which were based on Saldanha et al.14
For the extraction of the unsaponifiable matter, 10 mL of milk sample were taken and 8 mL of aqueous potassium hydroxide solution (KOH) 50% (m/v) and 12 mL of ethyl alcohol P.A were added. Following, the sample was vortex mixed for 1 min, the mixture was rested for 22 h in the dark and at room temperature to complete the saponification reaction. Afterwards, 10 mL of distilled water were added along with 10 mL of n-hexane and the mixture was vortex mixed for 5 min. After the complete phase-separation, the upper layer was collected and n-hexane was evaporated at room temperature in a rotary evaporator. The residue was suspended in 2.5 mL of acrylonitrile and isoproponalin (95:5, v/v), the same phase used as HPLC mobile phase.
Samples were filtered through a membrane of polyvinylydene fluoride (PVDF) with a pore diameter of 0.45 µm and injected in the RP-HPLC-DAD.
Chromatographic determination
A Shimadzu (Japan) liquid chromatograph was used for all analyses, equipped with a quaternary pump system, an on-line degasser, a Rheodyne injection valve with a 20 µL sample loop, column oven, and a spectrophotometer with diode array detector. The cholesterol and cholesterol oxides were separated in a reversed-phase analytical column C18
(Restek C18, 15 cm × 6 mm i.d. × 5µm), using an isocratic
binary solvent consisting of acetonitrile and isopropanol 95:5 (v/v) as mobile phase, which was filtered and degassed prior to chromatographic runs.
Solvent flow-rate and oven temperature were selected as 2 mL min-1 and 35 ºC, respectively, aiming to get complete
resolution of chromatographic peaks with a total run of 15 min.
All analyzes were performed in duplicate and chromatographic data were processed with the LC Solution® software (Shimadzu).
Sigma-Aldrich®. Peak identities were confirmed by spiking
samples with standards and also on the characteristic UV-spectrum of each substance, with or without standard co-elution. For quantitative determination, cholesterol and 25-hydroxycholesterol were monitored at 202 nm and 7-ketocholesterol in 227 nm.
Quantification of cholesterol and cholesterol oxides in fluid milk
The quantification of the cholesterol and oxides was accomplished by external standardization. Analytical curves were built for all analytes by injection of standard solutions of the compounds, relating the solution’s concentration with the equipment’s response (peak area),15
and the analytes samples concentrations were calculated by interpolation of their analytical signals in the analytical curves.
HPLC method validation
The validation of the proposed method was done according to the description provided by Ribani et al.,15
using the following analytical parameters: selectivity, linearity and range of application, repeatability, intermediary precision, recovery, limits of detection and quantification. The evaluation of the results was performed as recommended by the Resolution ANVISA RE number 899,16 of 05/29/2003, which is based on the international
norms of IUPAC.
For the evaluation process, commercial pasteurized skim milk products (n = 3) were purchased in the city of Itapetinga-BA, Brazil. Low fat content products were chosen in order to achieve a matrix similar to those of the samples, but with the minimum quantity of the focused analyte, to minimize interferences during the process steps.
Selectivity was evaluated in triplicate by using the spectra provided by the spectrophotometer with photodiode array detector by comparison of the peaks present in the chromatograms of the products with those peaks in the chromatograms of the standards, verifying the resolution and separation of the pure compounds.
Prior to the injection, the products were enriched with 50 µg of cholesterol, 7-ketocholesterol, and 25-hydroxycholesterol for each 1 mL of milk, then homogenized and extracted. After obtaining the chromatograms of the products and the purity spectrum of each peak, these data were compared to those ones collected when processing the standard solutions. Recoveries were evaluated in triplicate by adding to milk sample aliquots standard solutions of the analytes for reaching the following
concentrations: 75, 150 e 300 µg mL-1 for cholesterol and,
50, 75 and 100 µg mL-1 for cholesterol oxides. The injection
of control samples was performed without strengthening the standard. After the quantification of the analytes in the fortified samples and in the control, the recovery percentage (% REC) was calculated according to equation 1.
(1)
The additional parameters were evaluated by using the data obtained for analytical curves. Their construction was accomplished by injecting standard cholesterol and cholesterol oxide solutions dissolved in the mobile phase in the following concentrations: 1, 10, 20, 100, 200, 1000, and 2000 µg mL-1 for cholesterol and 0.1,
1, 10, 100, e 500 µg mL-1 for the 7-ketocholesterol and
25-hydroxycholesterol. These solutions were analyzed with two repetitions of four replicas each, in three non-consecutive days, with the solutions stored in a freezer at –18 ºC during the intervals between the days.
The linearity was evaluated according to the correlation coefficient by Pearson (R²) for linear regression. This parameter allowed estimation of the curve’s quality, and shall present a value close to 1.0, which indicates smaller dispersion of the experimental points and greater reliability of the estimated regression coefficients.
The application range of the analytical curve was achieved by the relative response method. In this method, a graph is constructed with the relative responses on the axis of the coordinates and the correspondent concentrations on a logarithmic scale on the axis of the abscissas. The application range is defined as being the range between the points where the relative response intercepts the lines of the reliability intervals, at 95% and 105% of the linear range.
The precision was evaluated point-to-point, for the repeatability (intraday) as well as for the intermediary precision (interdays) using the estimate of the averages and coefficients of variation (CV).
The limits of detection (LOD) and quantification (LOQ) were calculated considering the signal-to-noise ratio accepted for each limit and the parameters estimated for the analytical curve, according to equations 2 and 3:
LOD + 3.3 × s/S (2) LOQ = 10 × s/S (3)
Results and Discussion
Choice of method for the extraction of cholesterol and cholesterol oxides
When the determination of the cholesterol and the COP is carried out by HPLC, the critical sample preparation steps are the saponification and the extraction of the non-saponifiable material, in which are included the cholesterol and oxides. The saponification of the lipids has the primordial objectives of removing acylglycerols from the extract of the lipids (transforming them into soap and free glycerol) and hydrolyzing the esters of cholesterol.12
The reaction can be done after the extraction of the lipids,17
or by direct saponification of the sample.18 The direct
saponification technique was selected because it uses a significantly lower quantity of solvents and also requires shorter preparation time. Additionally, when previous fat extraction from foods is adopted, higher volumes of toxic solvents are required and therefore must be avoided.
Another relevant aspect is the conditions that saponification reaction is carried out since artifacts can be produced. Thus, the option adopted was to carry out the process at room temperature (cold saponification), seeking to minimize the generation of these compounds and avoiding submitting the analytes to high temperatures.
Dionisi et al.19 compared four COP extraction methods
in powder milk, including direct cold saponification of samples, and the other three methods with previous lipid extraction and posterior cold saponification, concluding that the best procedure was direct saponification because it presented good repeatability, precision, minimum formation of artifacts (< 0.05% of total cholesterol), and lower preparation time and solvent consumption.
Busch and King9 studied the stability of cholesterol and
7-ketocholesterol in different saponification conditions and observed a loss of approximately 50% of the oxide when it was exposed to more elevated temperatures (37 and 45 ºC) in comparison to room temperature (24 ºC). Furthermore, the formation of the dehydration product colesta-3,5-dieno-7-one was up to 398% higher when the saponification was performed at higher temperatures, demonstrating the oxide’s elevated thermal susceptibility. Cholesterol presented a better thermal stability and losses were only observed when the saponification was performed at 45 ºC, and in this condition the recovery was approximately 70%.
Concerning the extracting solvent, different solvents can be used, but most authors use n-hexane which is capable of extracting the cholesterol as well as oxides because of its polarity.13,14,19 Therefore, this solvent was also selected
for use in the present study.
Confirmation of peak identity
Peaks were identified using samples spiked with analytical standards of cholesterol and cholesterol oxides. Standards co-eluted with analytes’ peaks in milk samples (Figure 1), and also the UV-spectra of the standards and samples, both before and after standard spiking, were highly similar (Figure 1).
Validation
Selectivity
The chosen chromatographic conditions proved to be adequate for the separation of cholesterol and cholesterol oxides in milk samples. The method’s selectivity was confirmed using the LC Solution® software, showing
good resolution of the peaks and the separation of the pure compounds (Figure 1), confirming that in the retention times of cholesterol, 7-ketocholesterol, and 25-hydroxycholesterol there were no co-elution of other compounds in the food matrix.
Linearity and application range
The data relative to linearity show that there is a strong correlation between cholesterol concentrations and the oxides within the studied range and the respective areas. The coefficients of determination superior to 0.999 found for all curves confirm that the method generates results proportional to the concentrations of the analytes, within a specific range, being possible to correlate areas and analytes concentrations. Furthermore, these results are in
agreement with the requirements of the National Agency of Sanitary Vigilance (ANVISA) and the National Institute of Metrology, Standardization, and Industrial Quality (INMETRO), which recommend a correlation coefficient equal to 0.99 or a value over 0.90, respectively.16,20
For the evaluation of the application ranges of the achieved analytical curves, graphs were plotted relating the logarithm of the concentration of standards with the respective relative response of the equipment (peak area divided by the respective concentration of the analyte). Reliability intervals inferior and superior to 5% between the averages values of the injections were accepted as the acceptable range of application.
Furthermore, with regards to the relative response method, the range of application can be obtained by precision data, in which the concentration range where the precision is guaranteed is considered as the application range of the method proposed for the extraction and determination of the analytes.15,21 Results of the method’s
precision, which are presented hereinafter, confirm the obtained application range.
Repeatability and intermediary precision
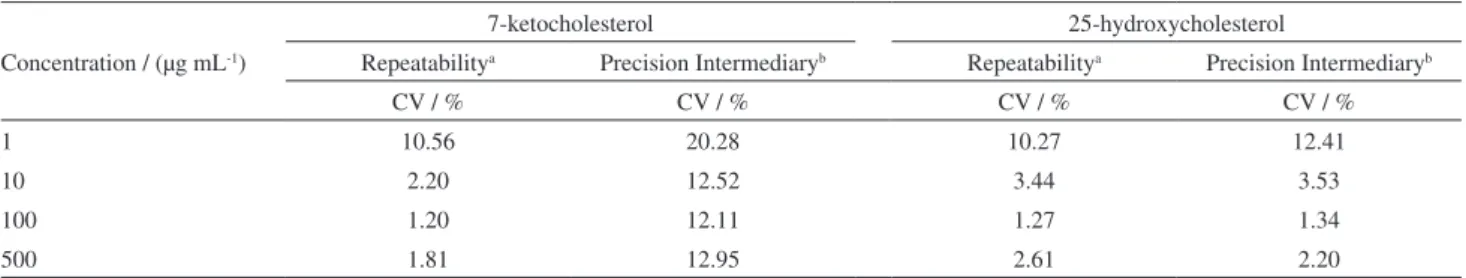
The coefficients of variations achieved in the study of repeatability and intermediary precision were adequate for all concentrations of cholesterol, 7-ketocholesterol, and 25-hydroxycholesterol, except for the lowest cholesterol concentration, following the criterion of acceptance for the variation coefficient of Brazil. The legislation considers CV values of up to 15% acceptable, although recommends a maximum variation of 5% for micro constituents. For micro constituents such as cholesterol oxides it admits CV values of up to 20%, depending on the complexity of the matrix.22
The values obtained for the precision of the analytical method for the analytes are found in Tables 1 and 2.
Similar results for precision were found by other authors and contribute to the confirmation of the precision of the proposed method for the determination of cholesterol and cholesterol oxide in milk samples.
Daneshfar et al.11 validated an HPLC-UV method for
cholesterol determination in milk and obtained precision CV% lower than to 5%, while Morales-Aizpúrua and Tenuta-Filho,23 using a HPLC-DAD system, obtained CV%
of 7.25 to 9.29% for repeatability in evaluating the content of cholesterol, 7-ketocholesterol, and 25-hydroxycholesterol in mayonnaise. According to the results presented for intermediary precision, one notices a reduction of precision for 7-ketocholesterol over the days, which may be related to the stability of this compound during analysis or storage, as demonstrated by Busch et al..22
These authors observed that the stability of this oxide diminished over the studied period of 7 days, in addition to decreasing according to the number of injections. Because in the present study the same standard solutions were used for injection in different days, totalizing 6 storage days, it can be suggested that some type of alteration in these solutions may have occurred, such as, for example, transformation of the 7-ketocholesterol into colesta-3,5-dieno-7-ona, which even so does not damage the validation process of the method, since even being reduced, the precision was guaranteed over the entire period.
Table 1. Precision of the analytical method for the determination of cholesterol in milk expressed by the variation coefficient
Concentration / (µg mL-1)
Cholesterol
Repeatabilitya Intermediary Precisionb
CV / % CV / %
1 16.99 72.56
10 5.41 5.04
20 5.03 4.70
100 2.07 1.95
200 1.20 1.09
1000 2.44 4.44
2000 1.18 1.21
an = 8; bn = 24.
Table 2. Precision of the analytical method for the determination of cholesterol oxides in milk expressed by the variation coefficient
Concentration / (µg mL-1)
7-ketocholesterol 25-hydroxycholesterol
Repeatabilitya Precision Intermediaryb Repeatabilitya Precision Intermediaryb
CV / % CV / % CV / % CV / %
1 10.56 20.28 10.27 12.41
10 2.20 12.52 3.44 3.53
100 1.20 12.11 1.27 1.34
500 1.81 12.95 2.61 2.20
Detection limit and quantification limit
The limits of detection (LOD) and quantification (LOQ) obtained by analytical curves were 11.10 e 33.65 µg mL-1
for cholesterol; 1.35 and 4.10 µg mL-1 for 7-ketocholesterol,
and 2.35 and 7.10 µg mL-1 for 25-hydroxycholesterol,
respectively.
Furthermore, according to Denobile e Nascimento,24
the quantification limit corresponds to the smallest concentration of the analyte that can be established with proper precision; taking this aspect into consideration one can also consider as LOQ for the cholesterol 10 µg mL-1
and for the oxides 1 µg mL-1, as seen in Tables 1 and 2.
Different results were obtained by other authors. Stroher et al.,25 using an HPLC system similar to the one
here used for determination of cholesterol in meat products, found a LOD equivalent to 0.005 mg g–1 and a LOQ of
0.016 mg g–1. Baggio e Bragagnolo8 obtained, respectively,
LOD of 4.8 µg g–1 and LOQ of 16 µg g-1 for cholesterol
analyses, and an LOD of 0.09 µg g-1 and LOQ of 0.3 µg g–1
for ketocholesterol analyses.
These differences are probably coming from the different methods employed for sample preparation. Different HPLC systems used for sample analyses as well as distinct forms for the calculation of limits did not harm the results of the cholesterol determination of the samples of this work, since the milk exhibits higher concentrations of this substance.
Regarding the oxides, these limits can be reduced by improving the operational conditions during the analyses, mainly in terms of the electrical stability of the chromatographic system, because this interferes directly with the equipment’s signal-to-noise ratio, also influencing the deviations of the analytical response.
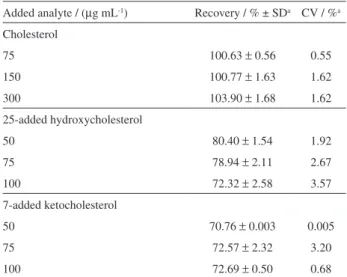
Recovery test
The results of the recovery test for the milk samples are shown in Table 3. The obtained results prove the efficiency of the proposed method for the cholesterol determination and the oxides, 7-ketocholesterol and 25-hydroxycholesterol. Analyte recoveries close to 100% are ideal, but smaller values are admitted if the precision is good,16 and in this case a CV / % of up to 5% is acceptable.
Results similar to those found for the cholesterol determination were found by Saldanha et al.13 while
comparing two methods for determination of cholesterol in milk, one being an enzymatic method and the other one a liquid chromatographic method. Other authors also achieved similar results for cholesterol, studying extraction methods on various samples, such as fish,26 mayonaise,23 and eggs.27
In relation to the cholesterol oxides, Saldanha et al.,14
using the same extraction method as this work, found superior results for samples of fish (salted cod and fresh hake), between 95 and 104% of recovery for oxides with moderate polarity, in which are included the 7-ketocholesterol and 25-hydroxycholesterol; this may be related to the differences in the matrix of the studied foods.
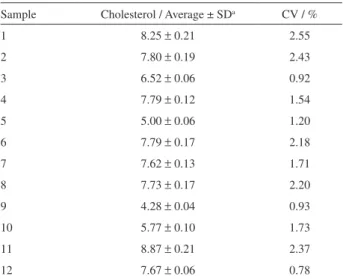
Determination of cholesterol and cholesterol oxides in milk
The oxide 7-ketocholesterol was not detected in any of the analyzed samples; only cholesterol and 25-hydroxycholesterol were detected in the fluid milk samples. The obtained mean values and the respective variation coefficients for the content of cholesterol in the milk samples can be seen in Table 4. The quantities of 25-hydroxycholesterol are not shown, since the detected quantities were inferior to the LQ of the method, making the reliable determination of these values impossible.
On average, the cholesterol content of whole milk is 12 mg per 100 mL, higher than those found in this work. However, this content may suffer from variation. Piironem et al.,28 evaluated Finnish commercial samples
and found values between 5.6 and 6.4 mg of cholesterol in 100 g of milk; Saldanha et al.13 evaluated Brazilian
commercial samples and found average values for cholesterol of 9.75 mg per 100 g of milk; and Manzi and Pizzoferrato,29 evaluating Italian commercial milk samples,
found values of 10.4 and 11.3 mg per 100 g of whole milk. These variations can be attributed to variations in the processing of the milk as well as to differences in the animal breeds, individual characteristics, and intervals between
Table 3. Results for the recovery / % of cholesterol and oxides in milk samples
Added analyte / (µg mL-1) Recovery / % ± SDa CV / %a
Cholesterol
75 100.63 ± 0.56 0.55
150 100.77 ± 1.63 1.62
300 103.90 ± 1.68 1.62
25-added hydroxycholesterol
50 80.40 ± 1.54 1.92
75 78.94 ± 2.11 2.67
100 72.32 ± 2.58 3.57
7-added ketocholesterol
50 70.76 ± 0.003 0.005
75 72.57 ± 2.32 3.20
100 72.69 ± 0.50 0.68
milking, lactation phase, composition of the animal’s diet, and seasonal and climatic interferences, thereby explaining the divergence of results.
In relation to the results presented for cholesterol oxides, these were expected because the fresh foods did not present COP or presented extremely small quantities, at trace levels, of these compounds.29
Furthermore, for being considered as an indicator of the cholesterol oxidation in foods and a secondary product of the oxidizing reaction,9 the non detection of
the 7-ketocholesterol can be accepted as a positive result. Additionally, the detection of 25-hydroxycholesterol in low and not quantifiable concentrations indicates that the conditions of obtention, storage, and preparation of the sample did not contribute significantly to the oxidation of the cholesterol, concurring with Orczewska-Dudek et al..30
These authors stated that milk may be more resistant to auto oxidation of cholesterol, even under unfavorable conditions of storage and/or processing, because it contains metals of low valence, high content of saturated fats, and natural anti-oxidizers such as vitamins and sulfhydryl groups, thereby characterizing the lacteous products by a lowe COP content, the lowest within all products of animal origin.30
Conclusions
The method proposed here for the simultaneous extraction of cholesterol and cholesterol oxides, 7-ketocholesterol, and 25-hydroxycholesterol proved to be suitab, and can be used with reliability for the determination of these compounds in milk. The method could be valuable
for the routine determination of cholesterol and cholesterol oxides in milk.
Acknowledgements
The authors would like to thank Coordenação de Aperfeiçoamento de Pessoal de Nível Superior (CAPES) and Conselho Nacional de Desenvolvimento Científico e Tecnológico (CNPq) for research funds.
References
1. Arya, S. K.; Datta, M.; Malhotra, B. D.; Biosens. Bioelectron.
2008, 23, 1083.
2. Shih, W. C.; Yang, M. C.; Lin, M. S.; Biosens. Bioelectron.
2009, 24, 1679.
3. Harper, A. E.; Feedstuffs 1993, 2, 13.
4. Scherr, C.; Ribeiro, J. P.; Arq. Bras. Cardiol. 2009, 92, 190. 5. Sieber, R.; Int. Dairy J. 2005, 15, 191.
6. Peng, S. K., Morin, R. J.; Biological Effects of Cholesterol Oxides, 1st ed.; Crc Press: London, 1991.
7. Guardiola, F.; Boatella, J.; Codony, R. In Cholesterol and Phytosterol Oxidation Products: Analysis, Occurrence, and
Biological Effects; Guardiola, F.; Dutta, P. C.; Codony, R.;
Savage G. P., eds.; Aocs Press: Champaign, 2002, ch. 3. 8. Baggio, S. R.; Bragagnolo, N.; Ciênc. Tecnol. Aliment. 2004,
24, 1.
9. Bush, T. P.; King, A. J.; J. Am. Oil Chem. Soc. 2010, 87, 955.
10. Plozza, T.; Craige, V.; Trenerry, A.; Caridi, D.; Food Chem. 2012, 134, 559.
11. Daneshfar, A.; Khezeli, T.; Lofti, H. J.; J. Chromatogr. B 2009,
877, 456.
12. Ulberth, F.; Buchgraber, M.; In Guardiola, F., Dutta, P. C., Codony, R, Savage, G. P. Cholesterol E Phytosterol oxidation products: analysis, occurrence, and biological effects. Champaign: Aocs Press; 2002.
13. Saldanha, T.; Mazalli, M. R.; Bragagnolo, N.; Ciênc. Tecnol. Aliment. 2004, 24, 109.
14. Saldanha, T.; Sawaya, A. C. H. F.; Eberlin, M. N.; Bragagnolo, N.;
J. Agric. Food Chem. 2006, 54, 4107.
15. Ribani, M.; Bottoli, C. B. G.; Collins, C. H.; Jardim, I. C. S. F.; Melo, L. F. C.; Quim. Nova 2004, 27, 771.
16. Brasil. ANVISA - Agência Nacional De Vigilância Sanitária. Resolução Re Nº 899, De 29 De Maio De 2003. Guia para Validação de Métodos Analíticos e Bioanalíticos. ANVISA:
Brasília, 2003.
17. Raith, K.; Brenner, C.; Farwanah, H.; Muller, G.; Eder, K.; Neubert, R. H. H.; J. Chromatogr. A 2005, 1067, 207. 18. Talpur, F. H.; Bhanger, M. I.; Khuhawar, M. Y.; J. Food Comp.
Anal. 2006, 19, 698. Table 4. Total cholesterol content in mg per 100 mL of milk, in the
analyzed samples
Sample Cholesterol / Average ± SDa CV / %
1 8.25 ± 0.21 2.55
2 7.80 ± 0.19 2.43
3 6.52 ± 0.06 0.92
4 7.79 ± 0.12 1.54
5 5.00 ± 0.06 1.20
6 7.79 ± 0.17 2.18
7 7.62 ± 0.13 1.71
8 7.73 ± 0.17 2.20
9 4.28 ± 0.04 0.93
10 5.77 ± 0.10 1.73
11 8.87 ± 0.21 2.37
12 7.67 ± 0.06 0.78
19. Dionisi, F.; Golay, P. A.; Aeschlimann, J. M.; Fay, L. B.; J. Agric. Food Chem. 1998, 46, 2227.
20. INMETRO - Instituto Nacional de Metrologia, Normalização e Qualidade Industrial. Orientações sobre Validação de Ensaios Químicos, DOQ-CGCRE-008; 2003.
21. Brito, N. M.; Amarante Júnior, O. P.; De Polese, L.; Ribeiro, M. L.; Rev. Ecotoxicol. Meio Ambiente 2003, 13, 129. 22. Bush, T. P.; Gross, H. B.; King, A. J.; J.Chromatogr. Sep. Tech.
2011, 2, 107.
23. Morales-Aizpúrua, I. C.; Tenuta-Filho, A.; Ciênc. Tecnol. Aliment. 2005, 25, 495.
24. Denobile, M.; Nascimento, S. E.; Braz. J. Pharm. Sci. 2004,
40, 210.
25. Stroher, G. L.; Rodrigues, A. C.; Dias, L. F.; Pedrão, M. R.; Paula, L. N.; Visentaine, J. V.; de Souza, N. E.; Am. J. Anal. Chem.2012, 3, 306.
26. Visentaine, J. V.; Saldanha, T.; Bragagnolo, N.; Franco, M. R. B.; Ciênc. Tecnol. Aliment. 2005, 25, 310.
27. Mazalli, M. R.; Saldanha, T.; Bragagnolo, N.; Rev. Inst. Adolfo Lutz 2003, 62, 49.
28. Piironen, V.; Toivo, J.; Lampi, A. M.; J. Food Comp. Anal. 2002,
15, 705.
29. Manzi, P.; Pizzoferrato, L.; Food Bioprocess Technol.2010, 3, 234.
30. Orczewska-Dudek, S.; Bederska-Łojewska, D.; Pieszka, M.; Pietras, M. P.; Ann. Animal Sci. 2012, 12, 25.
Submitted: October 24, 2013
Supplementary Information
Printed in Brazil - ©2014 Sociedade Brasileira de Química0103 - 5053 $6.00+0.00S
I
*e-mail: [email protected]
UV-Vis Spectrometric Detection of Biodiesel/Diesel Blend Adulterations with
Soybean Oil
David D. S. Fernandes,a Adriano A. Gomes,a Marcelo M. de Fontes,b Gean B. da Costa,b
Valber E. de Almeida,c Mario C. U. de Araújo,a Roberto K. H. Galvãod and Germano Véras*,c
aLaboratório de Automação e Instrumentação em Química Analítica/Quimiometria (LAQA),
Departamento de Química, Universidade Federal da Paraíba, Caixa Postal 5093, 58051-970 João Pessoa-PB, Brazil
bPrograma de Pós-Graduação em Ciências Agrárias and cDepartamento de Química, CCT,
Universidade Estadual da Paraíba, 58429-500 Campina Grande-PB, Brazil
dDivisão de Engenharia Eletrônica, Instituto Tecnológico de Aeronáutica,
12228-900 São José dos Campos-SP, Brazil
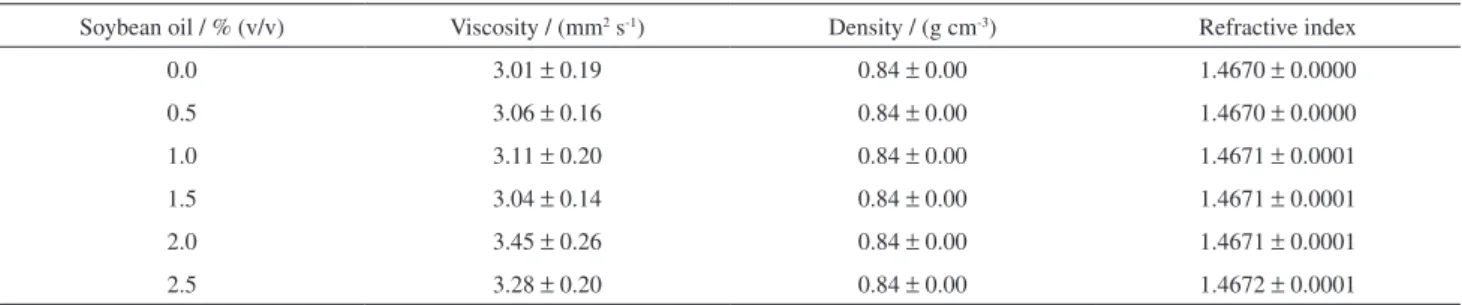
Table S1. Average and standard deviation values of viscosity, density and refractive index of B5 blends adulterated with soybean oil (n = 10 samples for each level of soybean oil)
Soybean oil / % (v/v) Viscosity / (mm2 s-1) Density / (g cm-3) Refractive index
0.0 3.01 ± 0.19 0.84 ± 0.00 1.4670 ± 0.0000
0.5 3.06 ± 0.16 0.84 ± 0.00 1.4670 ± 0.0000
1.0 3.11 ± 0.20 0.84 ± 0.00 1.4671 ± 0.0001
1.5 3.04 ± 0.14 0.84 ± 0.00 1.4671 ± 0.0001
2.0 3.45 ± 0.26 0.84 ± 0.00 1.4671 ± 0.0001
2.5 3.28 ± 0.20 0.84 ± 0.00 1.4672 ± 0.0001
Viscosity, refractive index and density were measured for B5 biodiesel/diesel blends adulterated with soybean oil at the levels of 0.0 (i.e. without adulteration), 0.5, 1.0, 1.5, 2.0 and 2.5% v/v (10 samples for each level). Viscosity was measured using a Cannon-Fenske 200 viscosimeter (Vidrolabor). Prior to the viscosity measurements,