Phase quanti
fi
cation in nanobainite via magnetic measurements and
X-ray diffraction
W. Solano-Alvarez
a,n, H.F.G. Abreu
b, M.R. da Silva
c, M.J. Peet
a aDepartment of Materials Science and Metallurgy, University of Cambridge, UKbDepartamento de Engenharia Metalúrgica e de Materiais, Universidade Federal do Ceará, Fortaleza, Brazil cInstituto de Física e Química, Universidade Federal de Itajubá, Itajubá, Minas Gerais, Brazil
a r t i c l e
i n f o
Article history:
Received 9 October 2014 Received in revised form 12 November 2014 Accepted 13 November 2014 Available online 15 November 2014
Keywords:
Nanostructured bainite Phase quantification Saturation magnetization X-ray diffraction
a b s t r a c t
Accurate phase quantification of nanostructured bainitic steel is of importance because of the nature of its percolating structure that controls many of its mechanical properties. X-ray diffraction is the tech-nique of choice for such analysis, but magnetic methods can be more rapid and less sensitive to defect structures. In this study, the phase volume fractions measured using both of these techniques for the specific mixtures associated with nanostructured bainite have been compared and contrasted. An ex-pression which relates the volume fraction and the saturation magnetization is obtained and its form is found to be consistent with previous work done on duplex stainless steels and TRIP steels. Thefitting constants used in many of such analyses vary significantly so an attempt is made to rationalize the differences by considering the factors that determine the intrinsic saturation magnetization of ferrite.
&2014 Elsevier B.V. All rights reserved.
1. Introduction
Nanostructured bainite contains an extremelyfine mixture of ferrite and austenite. The ability of the austenite to percolate the steel dictates amongst other factors, the ductility [1]and its re-sistance to the diffusion of hydrogen through the two-phase mixture[2]. Given the specific austenite morphology characteristic of nanostructured bainite, there is a critical threshold of austenite fraction below which the material fractures during tensile loading
[3], and the austenite also ceases to be effective as a barrier to hydrogen ingress[2].
There are many methods to determine the retained austenite content[4–8], each of which has limitations that have been dis-cussed extensively[9,10]. Diffraction using X-rays or neutrons has the advantage of rigor in the analysis of data and remains the method of choice for phase fraction analysis. However, magnetic methods to determine volume fractions can be rapid to implement even though they may require calibration. One difficulty is that the calibration constants seem to vary widely as a function of the alloy composition and microstructure[11–16]. In the present work we investigate X-ray diffraction and magnetic detection of retained austenite in nanostructured bainitic steel, and attempt to clarify the nature of the calibration function required for the magnetic
technique. Given that there are now several commercial applica-tions and numerous research programmes associated with this structure, it would be useful to have an easy method to char-acterize the retained austenite content with confidence.
2. Experimental methods
2.1. Material
All alloys used were cast as 25–50 kg ingots, which were then reduced 50% via hot forging. The chemical compositions are pre-sented inTable 1.
2.2. Heat treatments
The heat treatment of small samples cut via electrical-dis-charge machining included homogenization at 1200°C for 2 days and furnace cooling, austenitization in the
γ
region (900–1000°C) for 15 min and air cooling, bainitic transformation at different temperatures and times (Table 2) before being quenched in water at room temperature, and in some cases tempering also for dif-ferent times and temperatures. For the two heat treatments prior to the bainitic transformation, samples were sealed in quartz tubes back-filled with argon or in a vacuum furnace. Cooling slowly through the 700–550°C range, following homogenization, was used to ensure pearlite formation and avoid martensite, which would induce quench cracks[17]. Extensive characterization by Contents lists available atScienceDirectjournal homepage:www.elsevier.com/locate/jmmm
Journal of Magnetism and Magnetic Materials
http://dx.doi.org/10.1016/j.jmmm.2014.11.037 0304-8853/&2014 Elsevier B.V. All rights reserved.
n
Corresponding author. Tel.:+44 1223 334336.
X-ray diffraction and microscopy in these and similar conditions has been reported previously[18–22].
The main three parameters that determine the quantity of the ferromagnetic ferrite present are the mass, chemical composition, and the heat treatment of the samples. Therefore, the magneti-zation was studied by altering only one of these three parameters at a time in order to separate out their individual contributions. For example, samples 6 and 7 have different compositions but constant heat treatment and approximately constant mass; sam-ples 8, 9 and 10 have different mass but constant composition and heat treatment; samples 3 and 4 have different heat treatment but constant composition and approximately constant mass; and fi -nally samples 1 and 2 have no variation, meaning constant heat treatment, composition, and very similar mass.
2.3. X-ray diffraction
Samples were polished to a1 mμ finish, etched with 2% Nital and analyzed with X-ray diffraction (XRD) to measure the volume fractions of bainitic ferrite and retained austenite using aPhilips PW1830 vertical diffractometer with unfiltered CuKα radiation. Scans were performed with an acceleration voltage and current of 40 kV and 40 mA from 40 to 125°, with a step size of 0.05°and a dwell time of 26 s. A divergence slit of 0.5°, an anti-scatter slit of 0.5°, and a receiving slit of 0.2 mm were used to restrict the beam size and the counts obtained. The volume fractions of ferrite and austenite were derived usingHighScore Plusand the Rietveld
re-finement method.
2.4. Transmission electron microscopy
Samples were cut into thin slices250 mμ thick using a silicon carbide cutting wheel and ground down to40 100 m– μ using 1200 silicon carbide grinding paper. These thin discs of 0.3 mm in dia-meter were then electropolished using a twin jet polishing ma-chine and a solution of 80% ethanol, 15% glycerol, and 5% per-chloric acid with voltages between 20 and 40 V. Samples were observed in a JEOL 200 CX with an accelerating voltage of 200 kV.
2.5. Vibrating sample magnetometer
The magnetization and coercivefield of the different samples were measured at room temperature using the TEM discs prior to electropolishing with a VSM EGG-PAR model 4500 with a max-imum applied field of 600 kA m 1 and total measuring time of
25 min. These conditions were chosen in order to be able to compare the results to XRD volume fractions and to other mag-netic measurements in the literature, which were mostly per-formed at room temperature. This study concentrates only on dual phase systems, but it should be noted that for the tempered samples additional measurements could be performed above the Curie temperature of cementite (480 K) without affecting the structure in order to obtain information about the carbide phase fractions.
3. Results and discussion
Given the similarity in heat treatments and expected nanos-tructure, only some representative samples were studied using TEM. The images obtained are presented inFig. 1. For the sake of
brevity, samples from here onwards are referred to as
− − − − −
X Tisotrans tisotrans Ttemper ttemper Y, where X is the alloy type,Tstands for the temperature in [°C],tis the time in hours [h], days [d], or years [y], andYis the sample number in case of there being more than one with the same composition and heat treatment.
The stereologically corrected bainitic plate size of some un-tempered samples was determined using the mean width in the direction normal to the plate length. For samples 1 (A-200C-10d-1) and 2 (A-200C-10d-2) the mean thickness is 3971 nm and for sample 5 (B-150C-1y) it is 5174 nm[18].
The volume fraction of retained austenite obtained via Rietveld analysis of the complete XRD spectra (including overlapping peaks) is presented inTable 3along with the values of saturation magnetization per unit mass obtained at the maximum applied
field and the effective field corrected by the demagnetization factor corresponding to shape (thickness) of each sample[23]. The magnetization curves are presented inFig. 2.
Table 1
Chemical composition, wt%, of the alloys used.
Alloy C Si Mn Cr Mo Ni V Co P S Al
A 0.79 1.59 1.94 1.33 0.30 0.02 0.11 – o0.005 – –
B 0.80 1.59 2.01 1.00 0.24 – – 1.51 0.002 0.002 –
C 0.79 1.56 1.98 1.01 0.24 – – 1.51 0.002 0.002 1.01
D 0.78 1.60 2.02 1.01 0.24 – – 3.87 0.002 0.002 1.37
Table 2
Heat treatments performed on different samples. The weight column corresponds to thefinal sample geometry of thin discs used for TEM and magnetic measurements.
Sample Alloy Weight/g Isothermal transformation Tempering
Temperature/°C Time Temperature/°C Time
1 A 0.01135 200 10 days – –
2 A 0.01065 200 10 days – –
3 A 0.00965 200 10 days 400 1 h
4 A 0.0089 200 10 days 500 1 h
5 B 0.00405 150 1 year – –
6 B 0.00395 200 4 days – –
7 C 0.0036 200 4 days – –
8 D 0.0099 200 4 days – –
9 D 0.0064 200 4 days – –
It can be seen fromTable 3 that tempering at 500°C for 1 h decomposed all the retained austenite and left behind a com-pletely ferritic structure, as confirmed by the TEM image ofFig. 1b. It is therefore not surprising that this sample displayed the highest specific saturation magnetization. By plotting the measured vo-lume fraction of bainitic ferriteVαb against the specific saturation magnetizationms(Fig. 3), it was possible to perform a linearfit which yields the following equation:
= −
α
Vb 0.0054ms 0.015 (1)
The small value of they-intercept confirms the fact that the magnetization of a completely austenitic sample should be
approximately zero[14], so the equation can be rewritten as
= α
V m
185.2 (2)
s b
The value 185.2 A m2kg 1represents the intrinsic saturation
magnetization of ferrite (Ms) with an average of the compositions inTable 1, which is in close agreement with the measured mag-netization of 184.9 A m2kg 1 for sample 4
(A-200C-10d-500C-1h).
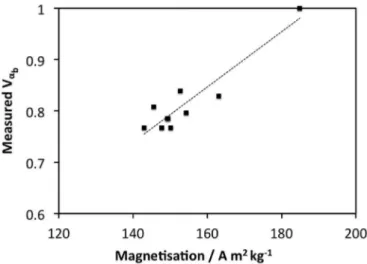
By using Eq. (2), it is possible to plot the expected volume fraction of bainitic ferrite for all samples against the measured value. As seen inFig. 4, 70% of the measured values lie within the error bars of the calculated value despite slight compositional variations. The error bars of the measured values all correspond to 0.01 given by the generally achieved accuracy of the Rietveld
re-finement method usingHigh Score Plus, whilst the error bars of the Fig. 1.TEM micrographs of samples: (a) 3 (A-200C-10d-400C-1h), (b) 4 (A-200C-10d-500C-1h), (c) 5 (B-150C-1y), and (d) 8 (D-200C-4d-1).
Table 3
Volume fraction of retained austeniteVγ, saturation magnetizationms, and effective fieldHefffor each sample. The error to all volume fractions is70.01 and for all magnetization measurements,71 . For the analysis, only bainitic ferrite and aus-tenite were considered, although the structure will contain carbides after tempering.
Sample Vγ ms(A m2kg 1) Heff(kA m )−1
1 A-200C-10d-1 0.215 149.4 167.6 2 A-200C-10d-2 0.215 149.2 168 3 A-200C-10d-400C-1h 0.161 152.7 168.5 4 A-200C-10d-500C-1h 0 184.9 167.6
5 B-150C-1y 0.204 154.3 172.1
6 B-200C-4d 0.192 145.5 172.3
7 C-200C-4d 0.171 163.1 172.3
8 D-200C-4d-1 0.233 147.7 168.5 9 D-200C-4d-2 0.233 150.1 170.7
calculated values were determined by
δVαb=0.005423δms+0.000137ms (3)
where 0.005423 is the average of theVαb/ms ratio of all samples and 0.000137 is its standard error, as described in[14].
The fact that the ferrite volume fraction of samples 5 (B-150C-1y), 7 (C-200C-4d) and 9 (D-200C-4d-2) cannot be accurately
predicted is not clear as it could not be attributed to either the mass of the sample, the chemical composition, or the heat treat-ment. It is possible nevertheless that since magnetic measure-ments were performed on TEM samples, the nanostructure was not homogenous for such sample size or there was stress induced transformation of the retained austenite to martensite. Recent research has shown that even after significant cycling stressing, the austenite films of nanostructured bainite in the regions of maximum subsurface shear stress do not stress transform to martensite[24]. Nevertheless, less stable blocky austenite regions could in principle transform to martensite during thin disc sample preparation distorting volume fraction measurements. Ion milling of the samples would reduce this effect, but given the cost and time associated with it, standard TEM sample preparation was chosen knowing that the affected region caused by the final grinding step with 1200 grit is ∼26 mμ for both sides, which corresponds to∼10 40%– of the sample volume depending on the different specimen thickness. Analysis of samples 8, 9, and 10 that have the same composition and heat treatment but different thickness (178, 155, and 222 mμ respectively) confirms that the thinnest sample has the highest magnetization and thus the highest ferrite content (150.1 A m2kg 1) and the thickest one, the
lowest (143.0 A m2kg 1) that could in part be because the region
of possible stress transformation of austenite to martensite is a larger percentage of the whole sample. Although sample pre-paration is a variable that could lead to further improvement of the accuracy of magnetic phase quantification, the different mag-netization values for samples 8–10 still lie within the error estimated.
A variety of values have been found for the intrinsic saturation magnetization of ferrite in different steels (saturation magnetiza-tion of samples containing virtually no austenite), but no quanti-tative explanations of such difference have been presented in the literature to date. Here, a simple calculation was performed to estimate this quantity based solely on the chemical composition of the alloy
= ∑
∑
M k m x
x (4)
s
s i i
i calc
Since only iron (msFe=218 A m kg2 −1), cobalt (msCo=159 A m kg2 −1), and nickel (msNi=54.4 A m kg2 −1) are ferromagnetic at room
tem-perature,msfor all other elements was taken as 0 A m2kg 1[25].x is the weight percent of each element andkis a correction factor that will be discussed later. The results of this calculation for different alloys in contrast with the measured values are presented inTable 4.
Fig. 3.Measured volume fraction of bainitic ferrite and saturation magnetization.
Fig. 4.Measured volume fraction of ferrite via diffraction (black dots) compared with the calculated value (white diamond) using the proposed equation.
Table 4
Measured (Msexp) and calculated (Mscalc) intrinsic saturation magnetization of ferrite for different alloys, except for the ones marked with†which are martensitic. Magnetic measurements were performed at room temperature (temperature not stated in those marked withn). The chemical composition of each alloy is shown in wt%.
Name Msexp/A m kg2 −1 Mscalc/A m kg2 −1 Fe C Si Mn Cr Mo Ni V Co P S N Nb Ti Al
Superduplex stain-less UNS S32750[14]
128 142.1 63.523 0.02 0.34 0.83 24.57 3.75 6.68 – – 0.026 0.001 0.26 – – –
Duplex stainless UNS S39205 [13]
133n
154.5 69.575 0.032 – – 22.38 2.55 5.32 – – 0.028 0.003 0.1123 – – –
304 stainless[26] 160.4n,†
160.2 71.299 0.07 0.72 1.32 18.03 – 8.46 – 0.08 0.015 0.006 – – – – Superbainite
(Alloy A)
184.9 204.7 93.915 0.79 1.59 1.94 1.33 0.30 0.02 0.11 – 0.005 – – – – –
300 maraging steel [16]
188 170.4 66.93 0.01 – – – 4.96 17.86 – 9.31 – – – – 0.79 0.14
TRIP (Al1.4P)[12] 189.5 211.2 96.87 0.18 0.02 1.52 – – – – – 0.005 – 0.004 – – 1.4 TRIP (Al1.8)[12] 197.5 210.1 96.36 0.2 0.02 1.53 – – – – – 0.081 – 0.0055 – – 1.8 Cr- High carbon[15] 206.4†
InFig. 5, the calculated values of intrinsic saturation magneti-zation for each of the alloys in Table 4 are plotted against the measured experimental values. A linear regression was applied which yielded the following equation if solved forMsexp
= −
Msexp 1.13Mscalc 33.35 (5)
In the previous work it is assumed that the chemical compo-sition dominates the intrinsic saturation magnetization of the ferrite, while it is acknowledged that microstructure also plays a role [15,27,12]. From our analysis it is possible to quantify how dominant the chemical composition actually is. Given the sig-nificant grain size difference between samples such as nanos-tructured bainite with a mean ferritic plate size of∼40 60 nm– and the superduplex stainless steel with grains up to∼350 mμ , it can be speculated that there must be a contribution of the ferritic grain size (domain size), shape/size of the sample,1and crystal structure of the ferritic phase (cubic or tetragonal) that can be incorporated to Eq.(4)by a constantk, which has a value of 1.052 for this study if the linear regression is performed with an intercept of zero. By providing data such as the grain and sample size in future studies, a more complete equation to predict the intrinsic saturation magnetization of ferrite, Ms, and hence the volume fraction of ferrite/austenite could, in principle, be determined using magnetic measurements alone.
4. Conclusion
By performing a short magnetization measurement at room temperature it is possible to confidently determine the amount of austenite/ferrite volume fraction of a nanostructured bainitic alloy
irrespective of small compositional variations by using
= α
Vb ms/185.2. Similar expressions have been derived for stainless
steels with substantial compositional, grain size, and phase vo-lume fraction differences confirming the applicability of magne-tization measurements as a reliable tool for phase quantification in steels.
A simple calculation has been performed to determine the in-trinsic saturation magnetization of ferrite based solely on the chemical composition of the ferromagnetic elements present in
the alloy. The results indicate that chemical composition does not predict this property entirely and that additional parameters such as the grain size (domain size), sample size/shape, or crystal structure of the ferrite may need to be considered in the devel-opment of a generally applicable model.
Acknowledgments
Funding by CONACyT, the Cambridge Overseas Trust, and the Roberto Rocca Education Programme is highly appreciated and acknowledged. We are very thankful to Prof. H. K. D. H. Bhadeshia and Dr. Ting Ping Hou for comments, suggestions, and encouragement.
References
[1]H.K.D.H. Bhadeshia, Properties offine-grained steels generated by displacive transformation, Mater. Sci. Eng. A 481–482 (2008) 36–39.
[2]L.C.D. Fielding, E.J. Song, D.K. Han, H.K.D.H. Bhadeshia, D.W. Suh, Hydrogen diffusion and the percolation of austenite in nanostructured bainitic steel, Proc. R. Soc. Lond. A 470 (2014) 20140108.
[3]M. Sherif, C. Garcia-Mateo, T. Sourmail, H.K.D.H. Bhadeshia, Stability of re-tained austenite in TRIP-assisted steels, Mater. Sci. Technol. 20 (3) (2004) 319–322.
[4]M.J. Dickson, Significance of texture parameters in phase analysis by X-ray diffraction, J. Appl. Crystallogr. 2 (1969) 176–180.
[5]R.L. Bannerjee, X-ray determination of retained austenite, J. Heat Treat. 2 (1981) 147–150.
[6]J.X. Zhang, P.M. Kelly, L.K. Bekessy, J.D. Gates, Determination of retained aus-tenite using an X-ray texture goniometer, Mater. Charact. 45 (2000) 39–49. [7]M. Radu, J. Valy, A.F. Gourgues, F.L. Strat, A. Pineau, Continuous magnetic
method for quantitative monitoring of martensitic transformation in steels containing metastable austenite, Scr. Mater. 52 (2005) 525–530.
[8]L.K. Perry, D.H. Ryan, R. Gagon, Studying surfaces and thinfilms using Möss-bauer spectroscopy, Hyperfine Interact. 170 (2006) 131–143.
[9]J. Talonen, P. Aspergren, H. Hänninen, Comparison of different methods for measuring strain induced martensite content in austenitic steels, Mater. Sci. Technol. 20 (2004) 1506–1512.
[10]P.J. Jacques, S. Allain, O. Bouaziz, A. De, A.F. Gourgues, B.M. Hance, Y. Houbaert, J. Huang, A. Iza-Mendia, S.E. Kruger, M. Radu, L. Samek, J. Speer, L. Zhao, S. van der Zwaag, On measurement of retained austenite in multiphase TRIP steels—
results of blind round robin test involving six different techniques, Mater. Sci. Technol. 25 (2009) 567–574.
[11]L. Zhao, N.H. van Dijk, A.J. Lefering, J. Sietsma, Magnetic detection of small fractions of ferromagnetic martensite within the paramagnetic austenite matrix of TWIP steel, J. Mater. Sci. 48 (4) (2013) 1474–1479.
[12]L. Zhao, N.H.V. Dijk, E. Brück, J. Sietsma, S.V. der Zwaag, Magnetic and X-ray diffraction measurements for the determination of retained austenite in trip steels, Mater. Sci. Eng. A 313 (1) (2001) 145–152.
[13]S.S.M. Tavares, P.D.S. Pedrosa, J.R. Teodosio, M.R.D. Silva, J.M. Neto, S. Pairis, Magnetic properties of the UNS S39205 duplex stainless steel, J. Alloys Compd. 351 (1) (2003) 283–288.
[14]S.S.M. Tavares, J.M. Pardal, J.A.D. Souza, J.M. Neto, M.R.D. Silva, Magnetic phase quantification of the UNS S32750 superduplex stainless steel, J. Alloys Compd. 416 (1) (2006) 179–182.
[15]S.S.M. Tavares, S.R. Mello, A.M. Gomes, J.M. Neto, M.R.D. Silva, J.M. Pardal, X-ray diffraction and magnetic characterization of the retained austenite in a chromium alloyed high carbon steel, J. Mater. Sci. 41 (15) (2006) 4732–4736. [16]J.M. Pardal, S.S.M. Tavares, M.C. Fonseca, M.R. da Silva, J.M. Neto, H.F.G. Abreu, Influence of temperature and aging time on hardness and magnetic properties of the maraging steel grade 300, J. Mater. Sci. 42 (7) (2007) 2276–2281. [17] W. Solano-Alvarez, H.K.D.H. Bhadeshia, Controlled-cracking of bearing steel:
Part 1, Metallurg. Mater. Trans. A 45 (11) (2014) 4907–4915,http://dx.doi.org/ 10.1007/s11661-014-2430-y.
[18] M.J. Peet, Transformation and tempering of low temperature bainite (Ph.D. thesis), University of Cambridge, 2010.
[19]C. Garcia-Mateo, F.G. Caballero, H.K.D.H. Bhadeshia, Acceleration of low-tem-perature bainite, ISIJ Int. 43 (2003) 1821–1825.
[20]C. Garcia-Mateo, M. Peet, F.G. Caballero, H.K.D.H. Bhadeshia, Tempering of a hard mixture of bainitic ferrite and austenite, Mater. Sci. Technol. 20 (2004) 814–818.
[21]H.J. Stone, M.J. Peet, H.K.D.H. Bhadeshia, P.J. Withers, S.S. Babu, E.D. Specht, Synchrotron X-ray studies of austenite and bainitic ferrite, Proc. R. Soc. A 464 (2008) 1009–1027.
[22]H.S. Hasan, M.J. Peet, M.-N. Avettand-Fènoël, H.K.D.H. Bhadeshia, Effect of tempering upon the tensile properties of a nanostructured bainitic steel, Mater. Sci. Eng. A 615 (2014) 340–347.
Fig. 5.Calculated intrinsic saturation magnetization against experimental values for different alloys. The continuous line is the applied linear regression and the dashed line represents perfect correspondence to the experimental data.
1Zhao et al. measured a 3% difference in the saturation magnetization between
[23]B.D. Cullity, C.D. Graham, Introduction to Magnetic Materials, Addison-Wesley Publication Company, Reading, Mass, 1972.
[24]W. Solano-Alvarez, E.J. Pickering, H.K.D.H. Bhadeshia, Degradation of nanos-tructured bainite under rolling contact fatigue, Mater. Sci. Eng. A 617 (2014) 156–164.
[25]C.M. Sorensen, Magnetism in Nanoscale Materials in Chemistry, John Wiley and Sons, Inc., New York, USA, 2002.
[26] P.L. Mangonon, G. Thomas, Structure and properties of thermal-mechanically treated 304 stainless steel, Metallurg. Trans. 1 (6) (1970) 1587–1594. [27] S.S.M. Tavares, M.R.D. Silva, J.M. Pardal, H.F.G. Abreu, A.M. Gomes,