Systematic review of dementia prevalence
1994 to 2000
Marcos Antonio Lopes
1,2, Sérgio Ricardo Hototian
2, Geraldo C. Reis
1,
Hélio Elkis
3, Cassio Machado de Campos Bottino
2Abstract – Ageing has occurred in all regions of the world, with impact on neuropsychiatric disorders, par-ticularly dementia. However, previous meta-analysis and reviews have shown high variability in world dementia prevalence rates. Objective: The aim of this study was to perform a wide-ranging review of the dementia preva-lence studies published in recent years. Methods: The search was made on Medline, Lilacs and Embase databases for research conducted between 1994 and 2000. The main inclusion criteria were: use of standard diagnostic criteria and investigation of community samples. Results: The fi nal selection included 42 papers, from all con-tinents. The mean prevalence rate of dementia in subjects aged 65 years and older, for continents, ranged from 2.2% in Africa to 8.9% in Europe, and among countries, from 1.3% in India to 14.9% in Spain. However, there was a trend of clustering of the world prevalence rates with the majority of studies reporting rates between 4.2% and 7.2% (≥65 years). Age directly infl uenced the rates, with a mean prevalence rate of 1.2% (95% CI: 0.8–1.5) for the 65-69 years group and 39.9% (95% CI: 34.4–45.3) for the 90-94 year group, but showing less pronounced infl uence in the very elderly age group. The urban samples had higher rates, where no signifi cant gender differ-ence was eviddiffer-enced. Conclusion: The age infl uence over dementia rates apparently leveled off in the very elderly group while a trend toward similar dementia prevalence rates around the world was probably infl uenced by greater homogeneity in diagnostic criteria.
Key words: epidemiology, prevalence, dementia, Alzheimer disease, review.
Revisão sistemática de prevalência de demência – 1994 a 2000
Resumo – A população idosa vem aumentando em todo o mundo, levando a um impacto nos transtornos
psiquiátricos, principalmente os quadros de demência. Contudo, revisões e meta-análises prévias têm mostrado alta variabilidade nas taxas mundiais de prevalência de demência. Objetivo: O objetivo deste estudo foi realizar uma ampla revisão de trabalhos recentes de prevalência de demência. Métodos: O levantamento foi feito em três bases de dados, Medline, Lilacs e EMBASE, no período de 1994 a 2000. Os principais critérios de inclusão foram: uso de critérios diagnósticos padronizados e investigação de amostra comunitária. Resultados: A seleção fi nal incluiu 42 artigos, de todos os continentes. A taxa média de prevalência de demência, na idade maior ou igual a 65 anos, entre continentes, variou de 2.2% na África, até 8.9% na Europa, e entre países, de 1.3% na Índia, até 14.9% na Espanha. Contudo, a maioria dos estudos reportou taxas entre 4.2% e 7.2% (≥65 anos). A idade exerceu infl uência direta sobre as taxas de prevalência, com taxas médias de 1.2% na faixa etária 65-69 anos, e 39.9% na faixa etária 90-94 anos, mostrando, no entanto, um efeito menos pronunciado nos idosos muito idosos. A população de procedência urbana teve taxas signifi cativamente maiores, e não houve diferença signifi cativa entre os sexos. Conclusão: A infl uência da idade sobre as taxas de prevalência de demência diminuiu entre os idosos mais “idosos”, e a tendência de resultados similares em todo o mundo provavelmente foi infl uenciada pela homogeneidade nos critérios diagnósticos.
Palavras-chave: epidemiologia, prevalência, demência, doença de Alzheimer, revisão.
1Clinics Hospital, Department of Neurology, Psychiatry and Medical Psychology of Faculty of Medicine of Ribeirão Preto, University of São Paulo, Brazil. 2Old Age Research Group (PROTER), Institute of Psychiatry, Faculty of Medicine, University of São Paulo, Brazil. 3Department of Psychiatry, Faculty of
Medicine, University of São Paulo, Brazil.
Marcos Antonio Lopes – Clinics Hospital, Department of Neurology, Psychiatry and Medical Psychology - Bandeirantes Avenue, 3900 / Campus of USP 14049-900 Ribeirão Preto SP - Brazil. E-mail: [email protected]
The world ageing process impacts certain diseases, and in recent years researchers from many countries have stud-ied the prevalence and risk factors associated with demen-tia, especially Alzheimer disease (AD).
which showed the strong effect of age on dementia preva-lence, the descriptive review of Fratiglioni et al. (1999),2 reporting that Vascular Dementia (VD) is more prevalent than Alzheimer disease in Asian countries and the Euro-pean review by Lobo et al. (2000),3 observing Alzheimer disease as the major cause for the fast increase of dementia in the elderly, a high variability of dementia prevalence rates has been observed around the world. However pre-vious reviews have either shown studies with broad diag-noses or specifi c characteristics (such as same region) or have evaluated a single variable. A wide-ranging review which evaluates recent studies and has high homogene-ity in research methods, including diagnostic criteria, can help researchers to understand the factors influencing the distribution of dementia rates throughout different regions of the world.
The purposes of this study were: 1) to review worldwide dementia prevalence studies from 1994 to 2000; 2) to assess and to integrate dementia prevalence rates, evaluating its distribution related to demographic factors; 3) to assess prevalence rates of both main etiological subtypes of De-mentia, namely: Alzheimer disease and Vascular Dementia; 4) to assess the infl uence of methodological variables on dementia prevalence rates; 5) to analyse the relationship between dementia prevalence and the variables studied, in order to detect possible associations which could be ad-dressed in future researches.
A preliminary analysis of the data presented in this arti-cle, without statistical analysis, was published previously.4
Methods
Survey of studies
Studies published between 1994 and 2000 were obtained from 3 data bases: Medline, Lilacs and EMBASE. In step one all languages were considered. The terms “epidemiol-ogy”, “prevalence” and “dementia” were used in “all fi elds”. All articles were sent for selection, according to specifi c criteria. Two examiners working independently performed the selection on the Medline database (M.A.L. and S.R.H).
Selection of studies
Studies were selected in 3 phases, with the following inclusion criteria:
• 1st phase: Original articles that have estimated dementia
prevalence in community samples using internationally accepted diagnostic criteria for “Dementia Syndrome”, according to most recent diagnostic manuals, chiefl y the DSM-III-R, DSM-IV, ICD-10 or similar (very broad diagnoses were excluded, such as “organic cerebral syn-drome” or “organic mental disorder”).
• 2nd Phase: Articles written in English, Portuguese, and
Spanish; accessibility.
• 3rd Phase: Data presented in a way that permitted
com-parison between studies.
Characterization of the studies evaluated
The following variables were recorded for each study: authors, country of origin, publication year, age range studied, sample composition (inclusion of institutional-ized subjects, urban or rural provenance), total sample size, loss of subjects, sub-sample size by age group and gender, dementia prevalence in elderly aged 65 years and older and at 5-year intervals, prevalence in each gender and age inter-val, prevalence of Alzheimer disease and Vascular Dementia etiological diagnoses, diagnostic criteria, use of computer-ized tomography and laboratorial exams.
Data investigation
Descriptive analysis
The studies were initially gathered on six geographic areas. Crude mean prevalence and distribution with regard to age group, gender and etiology were evaluated for each geographic area, within each country and among the coun-tries. Although the means were not adjusted, only studies with prevalence rates in elderly aged 65 years and older were taken into account. Exception was made when analys-ing the age variable, whereby only those studies with spe-cifi c age ranges (65-69, 70-74 and so on) were investigated, and for the etiology variable for which 3 studies with age range of 100 years and older were separately analysed.
Statistical analysis
vari-able was calculated and compared with the mean of other categories of the same variable. According to this strategy, the analysis of the variables “sample type” (community or institution+community), “provenance” (urban or rural), and “gender” was performed. Additionally, an adjustment to the variable “age” was made, where each variable cited above was investigated for each age group intervals. The Bonferroni method was then applied, in which the 0.05 p value was divided by 21 (3 variables and 7 age ranges) in order to obtain a new p value corresponding to the sta-tistical signifi cance. Without the adjustment for the “age” variable, the variables “sample size”, “percentage of par-ticipation” and “percentage of loss” were also examined. Non-parametric tests were used, considering that the data did not show a normal distribution. The Mann-Whitney test was used for the variables with two categories such as “sample type” (community, community+institution), and “gender”. The Kruskal-Wallis test was used for the vari-able with three categories namely, “provenance” (urban, urban+rural, rural) while the Spearman non-parametric correlation coeffi cient was applied for continuous variables such as “sample size”, “percentage of participation” and “percentage of loss”. The same tests outlined above were used in the analysis of the variables “sample type, “gender” and “provenance’, for all age group intervals.
Multivariate analysis
Finally, multivariable analysis was performed using the variables “age’, “gender”, “sample type”, “provenance”, “use of computerized tomography”, “use of laboratorial exams”, “use of total population”, “use of DSM”,6-8 “use of Hachinski Ischemic Scale”9 and “use of NINCDS-ADRDA diagnostics criteria”.10 The variable “use of NINCDS-ADRDA criteria” was chosen according to the methodology described in the reviews, as the possible interference of diagnostic criteria in dementia prevalence rates was considered. Logistic re-gression was performed with the Proc Logistic section of the SAS program. This choice of mathematical model took into consideration that the dependent variable was dicho-tomic – “with dementia” or “without dementia” – and that many independent variables could have potential infl u-ence on dementia prevalu-ence rate, as described above. The data were considered for Logistic Regression following this strategy: lines for all age ranges of all studies; each two lines referred to the same age range and the same study, one line for male and another line for female; the fi rst column for the “age” variable (age range); second column for number of cases of dementia; third column for total number of people; the next columns for the other variables. Adjusted “odds ratios” were estimated, with the respective confi -dence intervals and ‘p’ values.
Results
Selection and utilization of studies
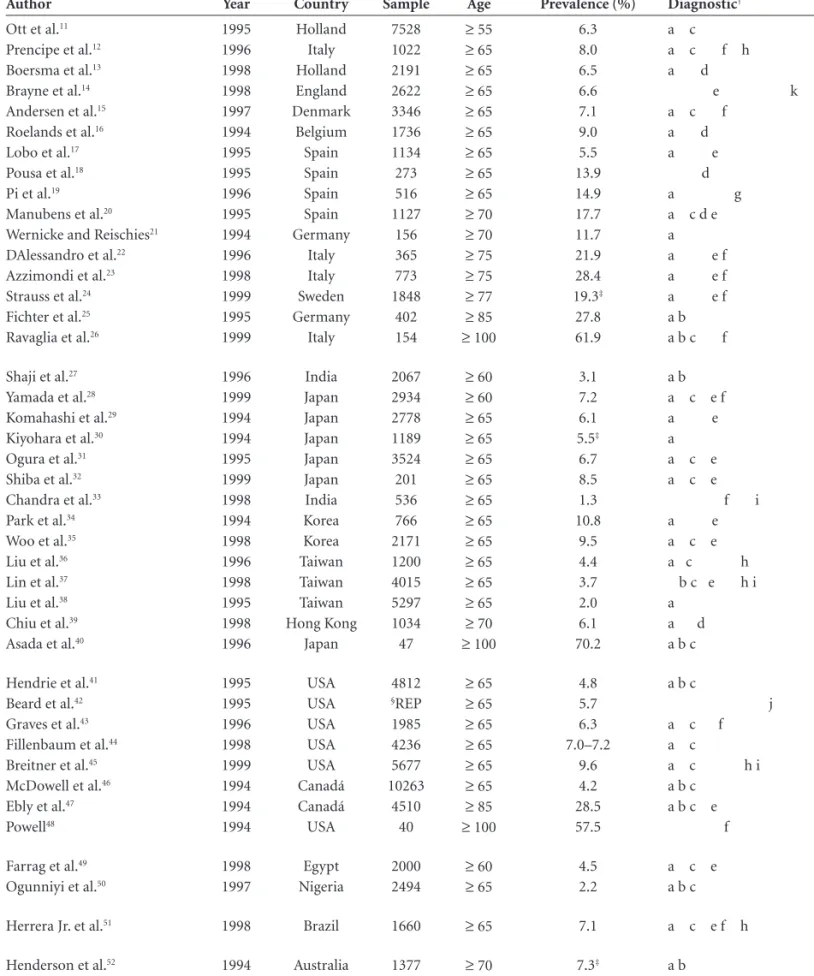
1750 articles were found, from which 73 were initially selected, according to the criteria established in the fi rst phase of the selection. Eight articles in other languages were excluded (Dutch: four; Japanese: two; German: one; and Polish: one), and two articles could not be accessed (2nd Phase). In the third phase of the selection, 15 articles were excluded: 12, for using age group different from “65 years and older”, or age intervals different from the major-ity of other studies; two, for examining specifi c samples (male gender, retired); and one, for estimating prevalence of moderate and severe degrees of dementia only. In total, 42 articles were fi nally studied, as shown in Table 1.
The studies were partly used in that, for each evaluation, only one set of articles was used since not all the data studied in these articles were available. In the descriptive analysis for variables “prevalence of dementia”, “age”, “gender” and “Alzhe-imer disease / Vascular Dementia Ratio”, 2612-19,29-38,41-46,50,51, 2611-18,20-24,25,27,29,31,32,34,37,39,43,45,47,51,52, 1913-15,17-19,29-32,34-38,43,45,46,51 and 2115-18,26,29-32,34-38,40,41,43,46,48,50,51 articles out of the total number of articles selected were used, respectively.
Descriptive analysis
The distribution by geographic area was defi ned as follows: • Europe: 16 studies (Spain: four, Italy: four, Holland: two, Germany: two, England: one, Sweden: one, Den-mark: one, Belgium: one).
• Asia: 14 studies (Japan: six, Taiwan: three, Korea: two, India: two, Hong-Kong: one).
• North America: 8 studies (United States: six, Canada: two).
• Africa: 2 studies (Nigeria: one, Egypt: one). • South America: 1 study (Brazil: one). • Oceania: 1 study (Australia: one).
Social-demographic distribution
The mean dementia prevalence rates, in elderly aged 65 years and older, were 2.2% in Africa, 5.8% in Asia, 6.2% in North America, 7.1% in South America, up to 8.9% in Europe. In Nigeria, one of the lowest results was described, 2.2%50, below rates in the American study41 that included subjects classifi ed as “African-American”.
stud-Table 1. Worldwide dementia prevalence studies, from 1994 to 2000.
Author Year Country Sample Age Prevalence (%) Diagnostic†
Ott et al.11
Prencipe et al.12
Boersma et al.13
Brayne et al.14
Andersen et al.15
Roelands et al.16
Lobo et al.17
Pousa et al.18
Pi et al.19
Manubens et al.20
Wernicke and Reischies21
DAlessandro et al.22
Azzimondi et al.23
Strauss et al.24
Fichter et al.25
Ravaglia et al.26
1995 1996 1998 1998 1997 1994 1995 1995 1996 1995 1994 1996 1998 1999 1995 1999 Holland Italy Holland England Denmark Belgium Spain Spain Spain Spain Germany Italy Italy Sweden Germany Italy 7528 1022 2191 2622 3346 1736 1134 273 516 1127 156 365 773 1848 402 154
≥ 55
≥ 65
≥ 65
≥ 65
≥ 65
≥ 65
≥ 65
≥ 65
≥ 65
≥ 70
≥ 70
≥ 75
≥ 75
≥ 77
≥ 85
≥ 100
6.3 8.0 6.5 6.6 7.1 9.0 5.5 13.9 14.9 17.7 11.7 21.9 28.4 19.3‡ 27.8 61.9
a c a c f h a d
e k a c f
a d a e d a g a c d e a a e f a e f a e f a b a b c f
Shaji et al.27
Yamada et al.28
Komahashi et al.29
Kiyohara et al.30
Ogura et al.31
Shiba et al.32
Chandra et al.33
Park et al.34
Woo et al.35
Liu et al.36
Lin et al.37
Liu et al.38
Chiu et al.39
Asada et al.40
1996 1999 1994 1994 1995 1999 1998 1994 1998 1996 1998 1995 1998 1996 India Japan Japan Japan Japan Japan India Korea Korea Taiwan Taiwan Taiwan Hong Kong Japan 2067 2934 2778 1189 3524 201 536 766 2171 1200 4015 5297 1034 47
≥ 60 ≥ 60 ≥ 65 ≥ 65 ≥ 65 ≥ 65 ≥ 65 ≥ 65 ≥ 65 ≥ 65 ≥ 65 ≥ 65 ≥ 70 ≥ 100
3.1 7.2 6.1 5.5‡ 6.7 8.5 1.3 10.8 9.5 4.4 3.7 2.0 6.1 70.2 a b a c e f a e a a c e a c e f i a e a c e a c h b c e h i a
a d a b c
Hendrie et al.41
Beard et al.42
Graves et al.43
Fillenbaum et al.44
Breitner et al.45
McDowell et al.46
Ebly et al.47
Powell48 1995 1995 1996 1998 1999 1994 1994 1994 USA USA USA USA USA Canadá Canadá USA 4812 §REP 1985 4236 5677 10263 4510 40
≥ 65
≥ 65
≥ 65
≥ 65
≥ 65
≥ 65
≥ 85
≥ 100
4.8 5.7 6.3 7.0–7.2 9.6 4.2 28.5 57.5
a b c
j a c f a c
a c h i a b c
a b c e f
Farrag et al.49
Ogunniyi et al.50
1998 1997 Egypt Nigeria 2000 2494
≥ 60 ≥ 65
4.5 2.2
a c e a b c
Herrera Jr. et al.51 1998 Brazil 1660 ≥ 65 7.1 a c e f h
Henderson et al.52 1994 Australia 1377 ≥ 70 7.3‡ a b
†Diagnostic Criteria and Instruments: (a) “Diagnostic and statistical manual of mental disorders, 3rd ed. rev” (DSM-III-R)7 ou “Diagnostic and statistical
manual of mental disorders, 4th ed.” (DSM-IV);8 (b) International of Classifi cation of Diseases ICD-1053; (c) “National Institute of Neurological and
Com-municative Disorders and Stroke and the Alzheimer’s Disease and Related Disorders Association (NINCDS-ADRDA)”;10 (d) “Cambridge Mental Disorders
of the Elderly Examination” (CAMDEX);54 (e) Hachinski Ischemic Scale (HIS);9 (f) “Clinical Dementia Rating” (CDR);55 (g) “Blessed Dementia Scale”
(BDS);56 (h) “National Institute of Neurological Disorders and Stroke and Association Internationale pour la Recherche et l’Enseignement en Neurosciences
(NINDS-AIREN);57 (i) “The Consortium to Establish a Registry for Alzheimer’s Disease” (CERAD);58 (j) “Rochester Epidemiologic Project” (REP); (k)
ies (8.5%)32 occurred in a rural region. The highest preva-lence in Asian countries was 10.8%,34 also in a rural zone, in a very economically limited Korean community.
Great variability was found in the North American re-sults. The prevalence varied between 4.8%41 and 9.6%,45 with a mean of 6.7%. Among investigations, Fillenbaum et al. (1998)44 and Hendrie et al. (1995)41 studies are notewor-thy. In the fi rst study, almost no differences were observed between African and White Americans (7.0 and 7.2% re-spectively), while in the second study, a high prevalence in African-American subjects was described (4.8%) compared with rates for Africans living in Africa (2.2%).41,50 The Ca-nadian study described a prevalence of 4.2%.46
The results of European studies, estimating prevalence in 65 years and older, were as follows: Holland: 6.5%;13 England: 6.6%;14 Denmark: 7.1%;15 Italy: 8.0%;12 Belgium: 9.0%16 and Spain: 5.5%,17 13.9%18 and 14.9%.19 The mean in Europe was very high at 8.9%, strongly infl uenced by two Spanish studies,18,19 that investigated rural and rural/ urban population, and found the highest rates of all the European studies.
In the Brazilian study, the only study selected in South America, the authors described a rate of dementia preva-lence of 7.1%.51
Dementia prevalence increased with age in all regions, except North America (a study conducted in the USA)48, for the group aged 100 years and older, where a lower rate was noted compared to the preceding age group (Figure 1). Mean rates of dementia prevalence, worldwide and by region, did not increase at such a high rate in the oldest age groups compared to other age groups (Table 2).
Higher dementia prevalence was observed in the female gender, across all regions studied. In some studies the ra-tio was two women to every one man. However, approxi-mately 25% of the studies described higher prevalence in male gender with these differences not reaching statistical signifi cance. Fillenbaum et al. (1998)44 observed a slight predominance of the male gender, which was not statisti-cally signifi cant, in dementia cases for African-Americans, in contrast to the result observed for White Americans. Ogunniyi et al. (1997),50 in Nigeria, found an overwhelm-ing prevalence of male gender (6:2 ratio) in Vascular De-mentia cases.
Prevalence of Alzheimer disease was higher than Vas-cular Dementia in all researched regions, partiVas-cularly in the South-American study51 which presented results two to three times higher than in other regions. An important inversion of this relationship occurred in 25 % of the Asian studies, with VD prevalence described in two studies as two times greater than AD. The age effect over these two etiologic diagnoses was also evident, verifying that the AD/
Figure 1. Dementia prevalence rate (mean), in each region.
Table 2. Effect of age over dementia prevalence rates. Crude mean rate in each age group (%) and amount of the increase of rates, as age increases (times).
Age
N (studies)
Mean
rate (%)† (95% CI)
Increase of rates‡
65–69 17 1.2 (0.8–1.5)
70–74 19 3.7 (2.6–4.7) 3.0
75–79 21 7.9 (6.2–9.5) 2.1
80–84 20 16.4 (13.8–18.9) 2.0
85–89 16 24.6 (20.5–28.6) 1.5
90–94 6 39.9 (34.4–45.3) 1.6
>95 6 54.8 (45.6–63.9) 1.3
†Mean dementia prevalence rate; ‡Amount of increase of rates, in
com-parison with rate before.
0 1 2 3 4 5
North America Asia South America Europe
Percentage
AD VD
Figure 2. Crude mean rate of Alzheimer’s disease (AD) and vascular
VD ratio showed an important increase in centenarians (Figures 2 and 3).
Predominance of Vascular Dementia over Alzheimer disease, identifi ed as a tendency in Japan by Komahashi et al. (1994),29 was not observed in the Ogura et al. (1995) study,31 where an Alzheimer disease/Vascular Dementia ratio of 1.5:1 was found. Kiyohara et al. (1994),30 despite reporting a higher prevalence of VD over AD, verifi ed a signifi cant increase in AD/VD rate over a 7-year-period.
The AD/VD ratio among African-Americans was simi-lar to those in most of the Western world studies, standing at around 1.5:1. When African-Americans were compared to White Americans, the results were also equivalent.
Approximately 30% of the studies used solely the Mini-Mental State Examination” (MMSE) (Folstein et al., 1975),60 for detection of probable dementia cases. Eighty-four per-cent of the studies utilized criteria from the “Diagnostic and Statistical Manual of Mental Disorders”, from the American Psychiatry Association (versions III-R or IV),7,8 and 50% of
these studies also used the NINCDS-ADRDA criteria.10 Fif-ty-four percent of the studies used at least one scale or ad-ditional criteria for Vascular Dementia (Hachinski Ischemic Scale,9 in the majority of the studies, or NINDS-AIREN57).
Statistical analysis
Univariate analysis
Age – The estimated average prevalence rate and the examined functions, for each age group interval, can be seen in Table 3. All three models permitted excellent ad-justments, both by R2 values and by estimated values, but the modified logistic was the most efficient, especially when estimated values for each model were compared. It was also noted that the modifi ed logistic model yielded prevalence estimates closer to observed rates. In contrast to the exponential model, both logistic and the modifi ed logistic models presented an infl ection point on the result-ing graphic (Figure 4), the infl ection point in the modifi ed logistic model being prior to the one in the logistic model. In the modifi ed logistic model the highest prevalence rates were reached for higher ages than in the logistic model.
0 2 4 6 8 10
North America Asia South America Europe
Ratio
AD/VD1 AD/VD2
Figure 3. Ratio Alzheimer’s disease (AD) and vascular dementia
(VD) in each region, in elderly aged 65 years and older (AD/VD 1) and in 100 years and older (AD/VD 2).
Figure 4. Age infl uence over dementia prevalence exponential,
lo-gistig and modifi ed logistic models.
Table 3. Effect of age over dementia prevalence rates, according to three statistical models. Rates in ob-served prevalence and in three models are expressed in percentage (%).
Age† (years) Prevalence (%) Exponential Logistic Modifi ed logistic
67.5 1.75 4.01 2.04 2.01
72.5 3.84 6.10 3.81 4.42
77.5 7.55 9.18 6.98 8.79
82.5 14.74 13.81 12.46 15.36
87.5 24.08 20.78 21.25 26.43
95.5 37.98 39.95 42.90 41.01
R2‡ (%) 96.7 98.2 99.2
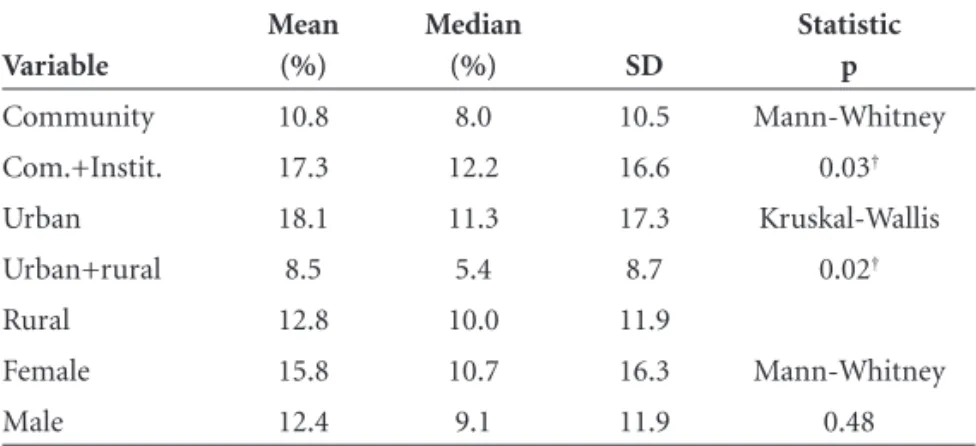
Sample type (community or institution), provenance (ur-ban or rural), gender – Studies investigating community+ institution samples and samples from urban provenance, presented signifi cantly higher prevalence rates compared to community alone and samples from urban-rural prov-enance, respectively. The female gender presented higher rates than male, but this was not statistically signifi cant (Table 4). There was one negative correlation between prevalence rates and the variables “sample size”. (r: –0.62; p<0.01; statistically signifi cant) and “participation rate” (r: –0.41; p:0.06; tendency of association).
When the variables “sample type”, “provenance” and “gender” were analysed in each age group, no statistically signifi cant association was found.
Multivariate analysis
The logistic regression method allowed analysis of how “age’, “gender”, “sample type”, “provenance”, “use of com-puterized tomography”, “use of laboratorial exams”, “use
of total population”, “use of DSM”,6-8 “use of Hachinski Ischemic Scale”9 and “use of NINCDS-ADRDA diagnos-tic criteria”10 infl uenced prevalence rates, and adjusted for each other. Age infl uenced prevalence rates signifi cantly where age and prevalence rates increased hand-in-hand. Studies with community+institution sample type, rural provenance, “use of total population” and “use of laborato-rial exams” presented signifi cantly higher prevalence rates. Studies that used computerized tomography and Hachin-ski Ischemic Scale presented signifi cantly lower prevalence rates. Variables such as “gender”, “use of DSM” and “use of NINCDS-ADRDA”, did not present statistically signifi cant differences (Table 5).
Discussion
Methodological advances were evident from the great number of studies that used standardized diagnostic cri-teria for diagnoses of dementia and its main causes: Al-zheimer disease and Vascular Dementia. On the other
Table 4. Effect of ‘sample’ (community or community + institution), ‘provenace’ (urban or urban+rural or rural) and ‘gender’ over rates.
Variable
Mean (%)
Median
(%) SD
Statistic p
Community 10.8 8.0 10.5 Mann-Whitney
Com.+Instit. 17.3 12.2 16.6 0.03†
Urban 18.1 11.3 17.3 Kruskal-Wallis
Urban+rural 8.5 5.4 8.7 0.02†
Rural 12.8 10.0 11.9
Female 15.8 10.7 16.3 Mann-Whitney
Male 12.4 9.1 11.9 0.48
†Signifi cant statistically.
Table 5. Effect of demographic and clinical variables over rates, after multivariate analysis.
Variable Odds ratio adjusted C.L. 95% p
Age 1.15 1.14–1.16 <0.0001†
Female 1.10 0.99–1.22 0.0557
Community + institution 1.31 1.00–1.69 0.0426†
Urban 1.76 1.39–2.22 <0.0001†
Rural 1.38 1.14–1.68 <0.0001†
Computerized tomography 0.50 0.39–0.65 <0.0001†
Laboratory 1.51 1.13–2.02 0.0053†
All population 1.28 1.07–1.53 0.0071†
DSM 0.99 0.75–1.30 0.9494
Hachinski ischemic scale 0.71 0.59–0.87 0.0009†
NINCDS-ADRDA 1.08 0.92–1.28 0.3143
hand, with relation to the method for detection of probable cases of dementia, the “Mini-Mental of State Examination” (MMSE)60 was applied alone in a considerable number of studies. Such strategy is questionable, in view of the effects of age and schooling on the performance of the MMSE.
Results differed signifi cantly both within the same re-gion, and within the same country. Greatest differences within the same region appeared in Asia, where Chandra et al. (1998)33 described a prevalence rate of 1.3% in In-dia, while Park et al. (1994)34 reported a rate of 10.8% in Korea. However, 14 of the 26 studies reporting dementia prevalence in subjects aged 65 years and older, investigating a total of 40.940 elderly in the community, reported rates ranging from 4.2% to 7.2%. Similarly, there seemed to be a worldwide tendency to report similar rates of dementia prevalence in elderly aged 65 and older (the 14 above-men-tioned studies were performed in all researched regions, except Africa). Another illustration of worldwide similarity was the increased rates of prevalence of dementia corre-lated with increased age in all researched regions (except Africa, due to insuffi cient data for comparison). There was insuffi cient evidence to elucidate the causes underlying the extreme dementia rates mentioned, or to assure the avail-able data indicated “true” regional differences, or differ-ences caused by methodological bias.
The results on the variable provenance were contro-versial. While in the descriptive analysis higher prevalence rates among Japanese,32 Asian34 and European19 subjects were found in rural samples, on the univariable and mul-tivariable analyses, higher prevalence rates were associated to urban provenance as was stated by Jorm et al. (1987).1 Regarding the descriptive analysis, it is important to point out the small sample size in the two Spanish studies18,19 (with the highest rates found in Europe), which increased the risk of inaccuracy of the results obtained. Controlling the interference of the variables reported in the present review, other factors could possibly explain the associa-tion between urban populaassocia-tion and higher dementia rates such as lower mortality and other conditions that might be typical of rural populations, but which can also be present in elderly samples living in urban areas, such as poor edu-cation12,22,23,34,35 (intrinsic factor and not a methodological bias), inadequate mental stimulation,34 manual occupation in the past23 (closely related to the previous factor), poor diet,34 limited access to medical care.32
In the present study, the descriptive analysis of the gender variable confi rmed a tendency described earlier by Jorm et al. (1987)1 and recently by Lobo et al. (2000).3 The higher prevalence of dementia in the female gender resulted mainly from the distribution of Alzheimer disease in 75% of the studies reviewed. However, the multivariable
analy-sis did not demonstrate a signifi cant difference between the variable “gender” and prevalence rates, although the “p” value was close to 0.05, indicating a tendency of higher prevalence rates for the female gender. It is not possible to explain whether there is a higher risk for women of develop-ing Alzheimer disease by exclusively examindevelop-ing prevalence studies. Hebert et al. (2001),61 in an interesting study com-pared prevalence and incidence of Alzheimer disease be-tween two populations resident in Boston, USA. The results demonstrated that incidence and prevalence of Alzheimer disease, controlling for age, were not signifi cantly different between men and women. In conclusion, the authors de-clared that higher prevalence rates of women with Alzheim-er disease could be due to women’s highAlzheim-er life span, and not related to any specifi c risk factor associated to gender.
The use of diagnostic instruments did not infl uence uniformly the rates of prevalence of dementia, similar to the findings reported by Corrada et al. (1995),62 in the study of sources of variability on rates of prevalence of Al-zheimer disease. However, the argument that Corrada et al. (1995)62 presented, that computerized tomography and the Hachinski Ischemic Scale9 contributed to diagnosing cases of Vascular Dementia in subjects with Alzheimer disease, lowering their prevalence rates, could not be applied to the results of the present study, which investigated the infl u-ence on prevalu-ence rates of dementia, and not Alzheimer disease. Thus, it raised the hypothesis that factors other than the relationship between Vascular Dementia and Al-zheimer disease could explain that association.
The relationship Alzheimer disease/Vascular Demen-tia appeared considerably higher in South America.51 This fi nding may have been infl uenced by two main aspects: a “true” low prevalence of Vascular Dementia in this sample, and the fact that this study was one of the few to diagnose, among etiological types of dementia, mixed dementia (Al-zheimer disease associated with Vascular Dementia), which may in turn have lowered the rates of Vascular Dementia. However, additional studies in South America are neces-sary to investigate the distribution of etiological types of dementia in communities from the region.
cardiovascular diseases in the population studied. In the study by Kiyohara et al. (1994),30 the Alzheimer disease/Vas-cular Dementia ratio showed an increase over a time frame of seven years, possibly because rates of Cerebrovascular Accidents among men in the studied population had low-ered. However, it is necessary to point out that the analysis of dementia subtypes must be considered cautiously given approximately 55% of the viable studies for this purpose used specifi c instruments (NINCDS-ADRDA, NINDS-AI-REN or Hachinski Ischemic Scale) while only 25% per-formed computerized tomography and laboratory studies.
Age also infl uenced rates of prevalence across all anal-yses performed, but not homogeneously. Supporting the results of the descriptive analysis for the age variable, the statistical models tested indicated a decrease in the infl u-ence of age in older age groups, as illustrated in the modi-fi ed logistic model. This result conmodi-fi rmed the meta-analysis published by Ritchie and Kildea (1995)5 which stated that the prevalence rates of dementia did not increase exponen-tially as age increases, as Jorm et al. (1987)1 had suggested previously. The data available allowed the supposition that there might be a plateau of prevalence rates above the age of 90 years old. Nevertheless, it is important to bear in mind the hypotheses pointed out by Johanson and Zarit (1995)65 – that “mortality could potentially ‘lower’ the rates of prevalence of dementia in older age ranges” - and by McGee and Brayne (1998)66 - “once mortality is taken into account, incidence must continue to rise into the oldest groups despite the apparent leveling off of prevalence in the very oldest”. Moreover, a recent article by McGee and Brayne (2001),67 using a deterministic model, found that only combining extreme changes in mortality, differential mortality and prevalence could lessen the incidence of dementia with increasing age, corroborating the need for more information on the oldest elderly subgroups.
With regard to the considerations presented, the main constraint of this study is the lack of access to a greater amount of data from the studies reviewed. Greater access, allied to systematic examination of incidence studies, could give access to additional information concerning the cir-cumstances that determined the distribution of cases of dementia in the world population.
Our study presented results similar to those of earlier re-views, especially concerning the increase in rates of demen-tia prevalence parallel to increased age. Regarding this is-sue, although older elderly were scarce in such studies, there seemed to be a decreased infl uence of age in older age rang-es. Such evidence leads to the assumption that dementia was not related to aging, but to age, as Ritchie and Kildea (1995)5 have previously suggested. However, in order to better in-vestigate the relationship between age and dementia rates,
it would be essential to control incidence and mortality rates, as pointed out by McGee and Brayne (1998, 2001).66,67
The tendency toward a clustering of prevalence rates may have occurred in majority of the studies investigated due to greater homogeneity in diagnostic criteria employed in the studies published between 1994 and 2000.
However, specifi c regional aspects do exist, such as racial composition, and socio-cultural heterogeneity, especially in regions that have been poorly studied, such as South Amer-ica and AfrAmer-ica, which justify additional studies on the prev-alence and incidence of dementia in developing countries.
References
1. Jorm AF, Korten AE, Henderson AS. The prevalence of de-mentia: a quantitative integration of the literature. Acta Psy-chiatr Scand 1987;76:465-479.
2. Fratiglioni L, Ronchi D, Agüero-Torres H. Worldwide preva-lence and incidence of dementia. Drugs Aging1999;15:365-375 3. Lobo A, Launer LJ, Fratiglioni L et al. Prevalence of dementia and major subtypes in Europe: a collaborative study of popu-lation-based cohorts. Neurology 2000;54(Suppl 5):S4-S9. 4. Lopes MA, Bottino CMC. Prevalence of dementia in several
regions of the world: analysis of epidemiologic studies from 1994 to 2000. Arq Neuropsiquiatr 2002;60:61-69.
5. Ritche K, Kildea D. Is senile dementia related” or “age-ing-related”? evidence from meta-analysis of dementia preva-lence in the oldest old. Lancet 1995; 346:931-934.
6. American Psychiatric Association. Diagnostic and statistical manual of mental disorders, 3rd ed. Washington, DC:
Ameri-can Psychiatric Association; 1980.
7. American Psychiatric Association. Diagnostic and statistical manual of mental disorders, 3rd ed (review). Washington, DC,
American Psychiatric Association; 1987.
8. American Psychiatric Association. Diagnostic and statistical manual of mental disorders, 4th ed. Washington, DC,
Ameri-can Psychiatric Association; 1994.
9. Hachinski VC, Iliff LD, Zihkla E et al. Cerebral blood fl ow in dementia. Arch Neurol1975;32:632-637.
10. McKhann G, Drachman D, Folstein M, Katzman R, Price D, Stadlan EM. Clinical diagnosis of Alzheimer’s disease: report of the NINCDS-ADRDA Work Group under the auspice of the department of health and human services task force on Alzheimer’s disease. Neurology 1984;34:939-944.
11. Ott A, Breteler MMB, Harskamp F et al. Prevalence of Al-zheimer’s disease and vascular dementia: association with education. The Rotterdam Study. BMJ 1995; 310:970-973. 12. Prencipe M, Casini AR, Ferretti C, Lattanzio MT, Fiorelli M,
13. Boersma F, Eefsting JA, van den Brink W, Koeter M, van Tilburg W. Prevalence of dementia in a rural netherlands population and the infl uence of DSM-III-R and CAMDEX criteria for the prevalence of mild and more severe forms. J Clin Epidemiol 1998;51:189-197.
14. Brayne C, Nickson J, McCraken C, Gill C, Johnson AL. Cogni-tive function and dementia in six areas of England and Wales: distribution of MMSE and prevalence of GMS organicity level in the MRC CFA Study. Psychol Med 1998;28:319-335. 15. Andersen K, Lolk A, Nielsen H, Andersen J, Olsen C,
Kragh-Sorensen P. Prevalence of very mild to severe dementia in Denmark. Acta Neurol Scand1997; 96:82-87.
16. Roelands M, Wostyn P, Dom H, Baro F. The Prevalence of De-mentia in Belgium: A population-based door-to-door survey in a rural community. Neuroepidemiology 1994;13:155-161. 17. Lobo A, Saz P, Marcos G, Dia JL, de la Camara C. The preva-lence of dementia and depression in the elderly community in a southern european population. The Zaragoza Study. Arch Gen Psychiatry 1995;52:497-506.
18. Pousa SL, Regla JL, Franch V, Pinedo LF. The prevalence of dementia in Girona. Neurologia 1995;10:189-193.
19. Pi J, Olivé JM, Roca J, Masana L. Prevalence of dementia in a semi-rural population of Catalunya, Spain. Neuroepidemiol-ogy 1996;15:33-41
20. Manubens JM, Martinez-Lage JM, Lacruz F et al. Prevalence of Alzheimer’s disease and other dementia disorders in Pam-plona, Spain. Neuroepidemiology 1995;14:155-164. 21. Wernicke TF, Reischies FM. Prevalence of dementia in old
age: clinical diagnoses in subjects aged 95 years and older. Neurology 1994;44:250-253.
22. D’Alessandro R, Pandolfo G, Azzimondi G, Feruglio FS. Prev-alence of dementia among elderly people in Troina, Sicily. Eur J Epidemiol 1996;12:595-599.
23. Azzimondi G, D’Alessandro R, Pandolfo G, Feruglio FS. Com-parative study of the prevalence of dementia in two Sicilian communities with different psychosocial backgrounds. Neu-roepidemiology 1998;17:199-209.
24. Strauss E, Viitanen M, Ronchi D, Winblad B, Fratiglioni L. Ag-ing and the occurrence of dementia. FindAg-ings from a popula-tion-based cohort with a large sample of nonagenarians. Arch Neurol 1999;56:587-592.
25. Fichter MM, Meller I, Schröppel H, Steinkirchner R. Dementia and cognitive impairment in the oldest old in the community. Prevalence and comorbidity. Br J Psychiatry 1995;166:621-629. 26. Ravaglia G, Forti P, Ronchi D et al. Prevalence and severity of dementia among northern Italian centenarians. Neurology 1999;53:416-418.
27. Shaji S, Promodu K, Abraham T, Roy KJ, Verghese A. An epidemiological study of dementia in a rural community in Kerala, Índia. Br J Psychiatry 1996;168:745-749.
28. Yamada M, Sasaki H, Mimori Y et al. Prevalence and risks of
dementia in the Japanese population: RERF’S adult health study Hiroshima subjects. J Am Geriatr Soc 1999;47:189-195. 29. Komahashi T, Ohmori K, Nakano T et al. Epidemiological survey of dementia and depression. Jpn J Psychiatry Neurol 1994;48:517-526.
30. Kiyohara Y, Yoshitake T, Kato I et al. Changing patterns in the prevalence of dementia in a Japanese community: The Hisayama study. Gerontology 1994; 40(suppl 2):229-235. 31. Ogura C, Nakamoto H, Uema T et al. COSEOUP GROUP.
Prevalence of senile dementia in Okinawa, Japan. Int J Epi-demiol 1995;24:373-380.
32. Shiba M, Shimogaito J, Kose A et al. Prevalence of dementia in the rural village of Hanazono-mura, Japan. Neuroepidemiol-ogy 1999;18:32-36.
33. Chandra V, Ganguli M, Pandav R, Johnston J, Belle S, De Kosky ST. Prevalence of Alzheimer’s disease and other de-mentias in rural India. The Indo-US study. Neurology 1998;51:1000-1008.
34. Park J, Ko HJ, Park YN, Jung C. Dementia among the elderly in a Korean community. Br J Psychiatry 1994;164:796-801. 35. Woo JI, Lee JH, Yoo K, Kim C, Kim Y, Shin YS. Prevalence
estimation of dementia in a rural area of Korea. J Am Geriatr Soc 1998;46:983-987.
36. Liu C, Lin R, Chen Y, Tai C, Yen Y, Howng S. Prevalence of demen-tia in a urban area in Taiwan. J Formos Assoc 1996;95:762-768. 37. Lin R, Lai C, Tai C, Liu C, Yen Y, Howng S. Prevalence and
subtypes of dementia in southern Taiwan: impact of age, sex, education, and urbanization. J Neurol Sci 1998;160:67-75. 38. Liu H, Lin K, Teng EL et al. Prevalence and subtypes of
de-mentia in Taiwan: a commmunity survey of 5297 individuals. J Am Geriatr Soc 1995;43:144-149.
39. Chiu HFK, Lam LCW, Chi I et al. Prevalence of dementia in Chinese elderly in Hong Kong. Neurology 1998;50:1002-1009. 40. Asada T, Yamagata Z, Kinoshita T et al. Prevalence of demen-tia and distribution of apoE alelles in Japanese centenarians: an almost-complete survey in Yamanashi Prefecture, Japan. J Am Geriatr Soc 1996;44:151-156.
41. Hendrie HC, Osuntokun B, Hall K et al. Prevalence of Al-zheimer’s disease and dementia in two communities: Ni-gerian Africans and African Americans. Am J Psychiatry 1995;152:1485-1492.
42. Beard CM, Kokmen E, O’Brien PC, Kurland LT. The preva-lence of dementia is changing over time in Rochester, Min-nesota.Neurology 1995;45:75-79.
43. Graves AB, Larson EB, Edland SD et al. Prevalence of de-mentia and its subtypes in the Japanese American population of King County, Washington State. The Kame Project. Am J Epidemiol 1996;144:760-771.
45. Breitner JCS, Wyse BW, Anthony JC et al. APOE-e4 count predicts age when prevalence of AD increases, then declines. The Cache County Study. Neurology 1999;53:321-331. 46. McDowel I, Hill G, Lindsay J et al. Canadian Study of Health
and Aging: study methods and prevalence of dementia. Can Med Assoc J 1994;150:899-913.
47. Ebly EM, Parhad IM, Hogan DB, Fung TS. Prevalence and types of dementia in the very old: results from the Canadian study of health and aging. Neurology 1994;44:1593-1600. 48. Powell A. Senile dementia of extreme aging: a common
dis-order of centenarians. Dementia 1994;5:106-109.
49. Farrag AF, Farwiz HM, Khedr EH, Mahfouz RM, Omran SM. Prevalence of Alzheimer’s disease and other dementing Disor-ders: assiut-upper Egypt study. Dement Geriatr Cogn Disord 1998;9:323-328.
50. Ogunniyi A, Gureje O, Baiyewu O et al. Profi le of dementia in a Nigerian community: types, pattern of impairment, and severity rating. J Natl Med Assoc 1997;89:392-396.
51. Herrera Jr E, Caramelli P, Nitrini R. Estudo epidemiológico populacional de demência na cidade de Catanduva - Estado de São Paulo - Brasil.Rev Psiq Clín (São Paulo)1998;25:70-73. 52. Henderson AS, Jorm AF, Mackinnon A et al. A survey of de-mentia in the Canberra population: experience with ICD-10 and DSM-III-R criteria. Psychol Med 1994; 24:473-482. 53. World Health Organization. International classifi cation of
diseases, 10th ed. Mental and behavioral disorders. Geneva:
World Health Organization; 1987.
54. Roth M, Tym E, Mountjoy CQ et al. CAMDEX A standardised instrument for the diagnosis of mental disorders in the elderly with special reference to the early detection of dementia. Br J Psychiatry 1986;149:698-709.
55. Hughes CP, Berg L, Danziger WL. A new clinical scale for the stating of dementia. Br J Psychiatry 1982;140:566-572. 56. Blessed G, Tomlinson B, Roth M. The association between
quan-titative measures of dementia and of senile change in the cerebral grey matter of elderly subjects. Br J Psychiatry 1968;114:797-811.
57. Román GC, Tatemichi TK, Erkinjuntti T et al. Vascular dementia: Diagnostic criteria for research studies: report of the NINDS-AI-REN International Wokshop. Neurology 1993;43:250-260. 58. Morris JC, Heyman A, Mohs RC et al. The consortium to
establish a registry for Alzheimer’s disease (CERAD). Part I. Clinical and neuropsychological assessment of Alzheimer’s disease. Neurology 1989;39:1159-1165.
59. Copeland JRM, Dewey ME, Griffi ths-Jones HM. Computerised psychiatric diagnostic system and case nomenclature for elder-ly subjects: GMS and AGECAT. Psychol Med 1986;16:89-99. 60. Folstein MF, Folstein SE, McHugh PR. Mini Mental State: a
pratical method for grading the cognitive state of patients for the clinician. J Psychiatr Res 1975;12:189-198.
61. Hebert LE, Scherr PA, McCann JJ et al. Is the risk of develop-ing Alzheimer’s disease greater for women than for men? Am J Epidemiol 2001;153:132-136.
62. Corrada M, Brookmeyer R, Kawas C. Sources of variability in prevalence rates of Alzheimer’s disease. Int J Epidemiol 1995;24:1000-1005.
63. Hébert R, Brayne C. Epidemiology of vascular dementia. Neuroepidemiology 1995;14:240-257.
64. Guk-Hee S, Ajit S. A review of the epidemiological transi-tion in dementia: cross-natransi-tional comparisons of the indices related to Alzheimer’s disease and vascular dementia. Acta Psychiatr Scand 2001;104:4-11.
65. Johanson B, Zarit S. Prevalence and incidence of dementia in the oldest old: a longitudinal study of population-based sample of 84-90-year-olds in Sweden. Int J Geriatr Psychiatry 1995;10:359-366.
66. McGee MA, Brayne C. The impact on prevalence of dementia in the oldest age groups of differential mortality patterns: a deterministic approach. Int J Epidemiol 1998;27:87-90. 67. McGee MA, Brayne C. Exploring the impact of prevalence