Abstract— This article proposes the comparison of control
charts for bivariate copulas when observations are exponential distribution. The Monte Carlo simulation was used to investigate the value of Average Run Length (ARL) for in-control and out-of-in-control process. The dependence of random variables were used and measured by Kendall’s tau in each copula. The simulation results show that performance of MCUSUM control chart was similar to MEWMA control chart for almost all shifts.
Index Terms—Copula, ARL, MCUSUM, MEWMA, Monte Carlo simulation
I. INTRODUCTION
ONTROL chart is one of the most widely applied statistical process control (SPC) which is a statistical and visual tool designed to detect shifts in manufacturing process. It is designed and evaluated under the assumption that the observations are from processes which are independent and identically distributed (i.i.d.). Univariate control chart is devised to monitor the quality of a single process characteristic but modern process often monitor more than one quality characteristic. These quality characteristics are clearly correlated and separate univariate control charts for monitoring individual quality characteristic which may not be adequate for detecting changes in the overall quality of the product. Thus, it is desirable to have control charts that can monitor multivariate measurements and they are referred to as multivariate statistical process control charts.
Multivariate statistical process control (MSPC) charts are the most rapidly developing sections of statistical process control [1] and lead to an interest in the simultaneous inspection of several related quality characteristics [2-3]. The three most common multivariate control charts are the multivariate cumulative sum (MCUSUM) [4] control chart,
Manuscript received July 10, 2015; revised August 8, 2015. This work was supported in part by the Graduate Colleges, King Mongkut’s University of Technology North Bangkok.
S. Kuvattana is with the Department of Applied Statistics, Faculty of Applied Science, King Mongkut's University of Technology North Bangkok, Bangkok 10800, Thailand (e-mail: [email protected]).
S. Sukparungsee is with the Department of Applied Statistics, Faculty of Applied Science, King Mongkut's University of Technology North Bangkok, Bangkok 10800, Thailand (e-mail: [email protected]).
P. Busababodhin is with the Department of Mathematics, Facultly of Science, Mahasarakham University, Mahasarakham, 41150, Thailand (e-mail: [email protected]).
Y. Areepong is with the Department of Applied Statistics, Faculty of Applied Science, King Mongkut's University of Technology North Bangkok, Bangkok 10800, Thailand (e-mail:[email protected]).
the multivariate exponentially weighted moving average (MEWMA) [5] control chart and the multivariate Shewhart control chart. Multivariate Shewhart control chart is used to detect large shifts in the mean vectors. The MEWMA and MCUSUM are commonly used to detect small or moderate shifts in the mean vectors [6]. MSPC procedures are based on a multi-normality assumption and independence but many processes are often non-normality and correlation. Moreover, multivariate control charts are the lack of the related joint distribution and copula can specify this property. Copulas are functions that join multivariate distribution functions to their one-dimensional margins . It can estimate joint distribution of nonlinear outcomes and explain the dependence structure among variables through the joint distribution by eliminating the effect of univariate marginals. Many researchers have developed the copula on MCUSUM and MEWMA charts (see [5], [7-14]).
This article presents comparison of efficiency between MCUSUM and MEWMA control charts when observations are exponential distribution with the means shifts and use a bivariate copulas function for specifying dependence between random variables.
II. THE MULTIVARIATE CUMULATIVE SUM CONTROL CHART
The multivariate cumulative sum (MCUSUM) control chart is the multivariate extension of the univariate cumulative sum (CUSUM) chart. The MCUSUM chart was initially proposed by Crosier [15]. The MCUSUM chart may be expressed as follows:
1/2
1 1 1, 2, 3
[( ) ] ; ,
t t t t t
C S X a
-1(S + X -a) t (1) where covariance (
)and St are the cumulative sumsexpressed as:
1
, if
( ) 1 , if
t
t
t t t
t
C k
k
C k
C
0
S S X a (2)
the reference value k0 and a is the aim point or target
value for the mean vector [16]. The control chart statistics for MCUSUM chart is
[ ] ; 1, 2, 3,1/2
t t t t
Y S
-1S (3)The signal gives an out-of-control if Yt h where h is the
control limit [17].
Performance Comparison of Bivariate Copulas
on the CUSUM and EWMA Control Charts
Sasigarn Kuvattana, Saowanit Sukparungsee, Piyapatr Busababodhin, and Yupaporn Areepong
III. THE MULTIVARIATE EXPONENTIALLY WEIGHTED MOVING AVERAGE CONTROL CHART
Lowry et.al. [18] have developed a multivariate exponentially weighted moving average (MEWMA) control chart. The MEWMA control chart is a logical extension of the univariate exponentially weighted moving average (EWMA) control chart. The EWMA statistic assigns less and less weight to the past observations than the current observation [6].
Suppose that Xi is a p1 vector of observations at
sample i1,2,3,... with target mean vector equal to the
zero vector and known covariance matrix and the vectors are independent over time. The extension of the EWMA control chart to the multivariate case is defined as follows:
Zi Xi (1 )Zi1 (4)
with the scalar charting constant , 0 1 which may be adjusted to change the weighting of the past observations and Z00. The quantity plotted on the control chart of the
MEWMA [19] is
2 / 1
i
i i i
T Z
ZZ(5)
The control chart signals a shift in the mean vector when
2 ,
i
T h where h is the control limit chosen to achieve a
desired in-control and the covariance matrix for Zi is
1 (1 )2
2 i i
Z
(6) which is analogous to the variance of the univariate EWMA. The Average Run Length performance of the MEWMA control chart depends on the off-target mean vector because the process mean vector shifts from the zero vector to a new out-of-control vector . The shift size is reported in terms of a quantity ( 1 ) ,1/ 2
μ
μ it usually called the non-centrality parameter. The value 0 is the in-control state and large values of correspond to bigger shifts in the mean.Note that if in equation (4) equal to 1, the MEWMA control chart statistic reduces to 2 / 1
i
i i i
T X
ZX the statisticused to on the Hotelling T2 control chart [19].
IV. COPULA FUNCTION
Copulas introduced by Sklar [20]. According to Sklar’s theorem for a bivariate case, let X and Y be continuous
random variables with joint distribution function H and
marginal cumulative distribution F x( ) and F(y),
respectively. Then H x y( , )C F x F y
( ), ( );
with a copula
2
: 0,1 0,1
C where is a parameter of the
copula called the dependence parameter, which measures dependence between the marginals. For the purposes of statistical method it is desirable to parameterize the copula function. Let denote the association parameter of the bivariate distribution and there exists a copula . Then
( ) ,
F x u F y( )v where u and v are uniformly
distributed variates [21]. This paper focuses on two types of Archimedean copulas which are Clayton and Frank [22].
Archimedean copulas
Let a class of functions : 0,1
0, withcontinuous, strictly decreasing, such that (1) 0, ( ) 0 t
and ( ) 0t for all 0 t 1 [22-24]. Archimedean
copulas of two types are generated as follow:
A. Clayton copula
1/
( , ; ) = ( 1, 0) ,
C u v max u v (7)
where ( ) (t t 1) / ; [ 1, ) \ 0.
B. Frank copula
( , ; ) 1 (1 ( 1)( 1)),
1
u v
e e
C u v ln
e
(8)
where ( ) ( 1) ; ( , ) \ 0 1 t e t ln e .
V. DEPENDENCE MEASURES FOR DATA
Generally, a parametric measure of the linear dependence between random variables is correlation coefficient and nonparametric measures of dependence are Spearman’s rho and Kendall’s tau. According to the earlier literature, the copulas can be used in the study of dependence or association between random variables and the values of Kendall’s tau are easy to calculate so this measure is used for observation dependencies.
Let X and Y be continuous random variables whose
copula is C then Kendall’s tau for X and Yis given by
4 ( , ) ( , ) - 1
c C u v dC u v
2I where c is Kendall’s tau of
copula C andthe unit square 2is the product where
0,1 and the expected value of the function C u v( , )of
uniform (0,1) random variables U and V whose joint distribution function is C, i.e., c4 [ ( , )] 1E C U V [23].
Genest and McKay [22] considered Archimedean
copula C generated by , then
1
0 ( )
4 +1
( ) Arch t dt t
where Arch is Kendall’s tau of Archimedean copula C.
A. Clayton copula
/ ( 2) ; [ 1, )\ 0 (9)
B. Frank copula
t 0
1 t
1 4 dt -1 / ; (- , )\ 0
e 1
VI. AVERAGE RUN LENGTH AND SIMULATION RESULTS The popular performance measure for control charts is the Average Run Length (ARL). ARL is classified into ARL0
and ARL1, where ARL0 is the Average Run Length when
the process is in-control and ARL1 is the Average Run
Length when the process is out-of-control [25]. The copula approach focuses on Clayton and Frank. This article use Monte Carlo simulation in R statistical software [26-28] with the number of simulation runs 50,000and sample size is 1,000. Observations were from exponential distribution with parameter ( ) equal to 1 for in-control process (
0 1
) and the shifts of the process level () by
0
. The process means are equal to 1, 1.25, 1.5, 1.75, 2,2.25 and 2.5.
Copula estimations are restricted to the cases of
dependence (positive and negative dependence) and all copula models, setting correspondes with Kendall’s tau. The level of dependence is measured by Kendall’s tau values ( 1 1) which are defined to 0.8 and -0.8, respectively.
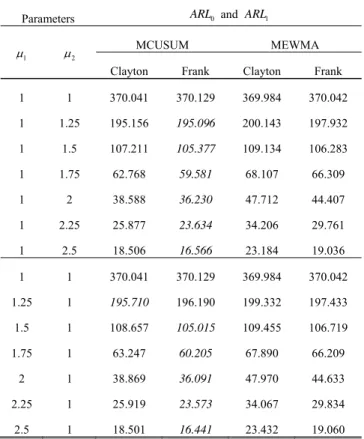
The results of simulation experiments are showed in Table I - IV for the different values of Kendall’s tau and denote 1 for the variables X and 2 for the variables Y.
The control chart was chosen by setting the desired ARL0=
370 for each copula. Table I-II show strong positive dependence( 0.8) and Table -IV show strong negative dependence ( 0.8). For example, Table I shows positive dependence(0)when the shifts in one exponential parameter. In the case of 11 and 2 is changed, for all shifts (11, 1.2522.5), the ARL1
values of Frank copula on MCUSUM control chart are less than MEWMA control chart. In the case of 2 1 and 1 is
changed, for small shift (1 1.25, 2 1), the ARL1 value
of Clayton copula on MCUSUM control chart is less than MEWMA control chart, for moderate and large shifts
1 2
(1.5 2.5, 1), the ARL1values of Frank copula on
MCUSUM control chart are less than MEWMA control chart. Table II shows positive dependence (0)when the shifts in both exponential parameters. For small shifts
1 2
(1.25 1.75, 1.25 1.75), the ARL1 values of
Clayton copula on MEWMA control chart are less than MCUSUM control chart , for moderate and large shifts
1 2
(2 2.5, 2 2.5), the ARL1 values of Clayton
copula on MCUSUM control chart are less than MEWMA control chart.
TABLEI
COMPARISON OFARLON CONTROL CHARTS WITH KENDALL’S TAU VALUE
EQUAL TO 0.8 WHEN THE SHIFTS IN ONE EXPONENTIAL PARAMETER.
Parameters ARL0 and ARL1
1
2 MCUSUM MEWMA
Clayton Frank Clayton Frank 1 1 370.041 370.129 369.984 370.042 1 1.25 195.156 195.096 200.143 197.932
1 1.5 107.211 105.377 109.134 106.283
1 1.75 62.768 59.581 68.107 66.309
1 2 38.588 36.230 47.712 44.407
1 2.25 25.877 23.634 34.206 29.761
1 2.5 18.506 16.566 23.184 19.036
1 1 370.041 370.129 369.984 370.042 1.25 1 195.710 196.190 199.332 197.433
1.5 1 108.657 105.015 109.455 106.719
1.75 1 63.247 60.205 67.890 66.209
2 1 38.869 36.091 47.970 44.633
2.25 1 25.919 23.573 34.067 29.834
2.5 1 18.501 16.441 23.432 19.060
TABLEII
COMPARISON OFARLON CONTROL CHARTS WITH KENDALL’S TAU VALUE
EQUAL TO 0.8 WHEN THE SHIFTS IN BOTH EXPONENTIAL PARAMETERS.
Parameters ARL0 and ARL1
1
2 MCUSUM MEWMA
Clayton Frank Clayton Frank 1 1 370.041 370.129 369.984 370.042 1.25 1.25 145.866 149.487 145.435 150.129
1.5 1.5 76.576 80.001 74.421 78.224
1.75 1.75 46.467 48.708 45.555 49.047
2 2 30.540 31.957 31.957 34.814
2.25 2.25 21.532 22.423 23.649 25.791
TABLE
COMPARISON OFARLON CONTROL CHARTS WITH KENDALL’S TAU VALUE
EQUAL TO -0.8 WHEN THE SHIFTS IN ONE EXPONENTIAL PARAMETER.
Parameters ARL0 and ARL1
1
2 MCUSUM MEWMA
Clayton Frank Clayton Frank 1 1 370.073 369.898 370.048 369.860 1 1.25 217.642 213.616 206.189 203.742
1 1.5 125.222 122.585 116.565 114.836
1 1.75 73.649 72.141 75.813 73.019
1 2 47.062 45.447 53.299 51.502
1 2.25 32.383 30.621 40.395 38.061
1 2.5 23.563 22.106 29.449 27.579
1 1 370.073 369.898 370.048 369.860 1.25 1 217.844 211.881 205.465 203.404
1.5 1 125.629 121.631 116.712 114.335
1.75 1 74.104 71.510 74.983 72.594
2 1 47.452 44.831 53.409 51.980
2.25 1 32.486 30.440 40.168 38.269
2.5 1 23.635 22.082 29.611 27.783
TABLEIV
COMPARISON OFARLON CONTROL CHARTS WITH KENDALL’S TAU VALUE
EQUAL TO -0.8 WHEN THE SHIFTS IN BOTH EXPONENTIAL PARAMETERS.
Parameters ARL0 and ARL1
1
2 MCUSUM MEWMA
Clayton Frank Clayton Frank 1 1 370.073 369.898 370.048 369.860 1.25 1.25 158.821 159.226 148.415 149.336
1.5 1.5 80.217 81.915 78.387 78.738
1.75 1.75 45.524 46.497 49.877 49.953
2 2 28.945 29.362 35.369 34.948
2.25 2.25 19.808 19.990 25.562 25.497
2.5 2.5 14.329 14.522 18.411 18.236
VII. CONCLUSION
The authors compared efficiency between MCUSUM and MEWMA control charts for bivariate copulas when observations are exponential distribution using the Monte Carlo simulation approach. The results found that MCUSUM control chart performs better than MEWMA control chart when one exponential parameter changes but the performance of MCUSUM control chart was found to be similar to the MEWMA control chart referring to the shift in both exponential parameters for all shifts.
ACKNOWLEDGMENT
The authors would like to thank the King Mongkut’s University of Technology North Bangkok and Thailand Ministry of Science and Technology for the financial support during this research.
REFERENCES
[1] C. Fuchs and R.S. Kenett, Multivariate quality control: theory and
applications. New York: Marcel Dekker,INC. 1985.
[2] C.A. Lowry and D.C. Montgomery, “A review of multivariate control charts,” IIE Transactions, vol. 27, pp. 800-810. 1995.
[3] W.H. Woodall, D.C. Montgomery, “Research issues and ideas in statistical process control,” Journal of Quality Technology, vol. 31,
pp. 376-386. 1999.
[4] S. Bersimis, J. Panaretos and S. Psarakis, “Multivariate Statistical Process Control Charts and the Problem of Interpretation: A Short Overview and Some Applications in Industry,” Published in: Proceedings of the 7th Hellenic European Conference on Computer
Mathematics and its Applications, Athens Greece, 2005.
[5] S. Kuvattana, S. Sukparungsee, P. Busababodhin and Y. Areepong, “Bivariate copulas on the exponentially weighted moving average control chart(Periodical style—Submitted for publication),” Maejo International Journal of Science and Technology.
[6] H.M. Midi and A. Shabbak, “Robust Multivariate Control Charts to Detect Small Shifts in Mean,” Mathematical Problems in
Engineering, vol. 2011, Special section, pp.1-19. 2011.
[7] A.A. Fatahi, , P. Dokouhaki and B.F. Moghaddam, “A bivariate control chart based on copula function,” IEEE International
Conference on Quality and Reliability (ICQR), Bangkok, Thailand,
14-17 Sept, 2011, pp. 292 – 296.
[8] A.A. Fatahi, R. Noorossana, P. Dokouhaki and B.F. Moghaddam, “Copula-based bivariate ZIP control chart for Monitoring rare events,” Communications in statistics theory and methods, vol. 41,
pp. 2699 – 2716, 2012.
[9] P. Dokouhaki and R. Noorossana, “A copula Markov CUSUM chart for Monitoring the bivariate auto-correlated binary observation,”
Quality and reliability engineering international, vol. 29, pp.
911-919, 2013.
[10] O. Hryniewicz, “On the robustness of the Shewhart control chart to different types of dependencies in data,” Frontiers in Hryniewicz
and A. Szediw, “Sequential signals on a control chart based on nonparametric statistical tests,” Frontiers in Statistical Quality
Control, vol. 9, pp. 99-108, 2010.
[11] O. Hryniewicz, “On the robustness of the Shewhart control chart to different types of dependencies in data,” Frontiers in Statistical
Quality Control, vol. 10, pp. 20-33, 2012.
[12] G. Verdier, “Application of copulas to multivariate control charts,”
Journal of Statistical Planning and Inference, vol. 143, pp. 2151–
2159, 2013.
[13] S. Kuvattana, S. Sukparungsee, P. Busababodhin and Y. Areepong, “Bivariate copulas on the Shewhart control chart(Periodical style— Submitted for publication),” Far East Journal of Mathematical Sciences.
[14] S. Kuvattana, S. Sukparungsee, P. Busababodhin and Y. Areepong, “Efficiency of bivariate copulas on the CUSUM chart,” Proceedings
of IMECS 2015, Hong Kong, 18-20 March, 2015.
[15] R.B. Crosier, “Multivariate generalizations of cumulative sum quality-control schemes,” Technometrics, vol. 30, pp. 291–303,
1988.
[16] B. C. Khoo, M. A. Atta and H. N. Phua, “A Study on the performances of MEWMA and MCUSUM charts for skewed distributions,” in Proc.10th Islamic Countries Conference On
Statistical Science, Cairo, Egypt, 2009. pp 817 – 822.
[17] C. C. Alves, R. W. Samohyl and E. Henning, “Application of multivariate cumulative sum control charts(MCUSUM) for monitoring a machining process,” 16th Int. Conf. on Industrial
Engineering And Operations Management, Sao Carlos, Brazil,
12-15 Oct, 2010, pp. 1-7.
[18] C. A. Lowry, W. H. Woodall, C. W. Champ and S. E. Rigdon, “A multivariate exponentially weighted moving average control chart,”
Technometrics, vol. 34, pp. 46–53, 1992.
[20] A. Sklar, “Fonctions de repartition a n dimensions et leurs marges,”
Publ. Inst. Statist. Univ. Paris , vol. 8, pp. 229-231, 1959.
[21] P. K. Trivedi and D. M. Zimmer, Copula Modeling: An Introduction for Practitioners. Foundations and Trends in
Econometrics. 2005.
[22] C. Genest and R. J. McKay, “The joy of copulas: bivariate distributions with uniform marginals,” American Statistician, vol.
40, pp. 280–283, 1986.
[23] R. B. Nelsen, An introduction to copulas. 2nd ed. New York.
Springer. 2006.
[24] C. Genest and L.-P. Rivest, “Statistical inference procedures for bivariate Archimedean copulas,” Journal of the American Statistical
Association, vol. 88, pp. 1034–1043, 1993.
[25] J. Busaba, S. Sukparungsee and Y. Areepong, “Numerical Approximations of Average runlength Run Length for AR(1) on Exponential CUSUM,” Proceedings of IMECS 2012, Hong Kong,
14-16 March, 2012.
[26] J. Yan, “Enjoy the joy of copulas: With a package copula,” Journal
of Statistical Software, vol. 21, pp. 1-21, 2007.
[27] M. Hofert, M. M̈achler and A.J. McNeil, “Likelihood inference for Archimedean copulas in high dimensions under known margins,”
Journal of Multivariate Analysis, vol.110, pp. 133–150, 2012.
[28] M. M̈achler and E. Zurich. (2013, March). Numerically stable Frank copula functions via multiprecision: R Package Rmpfr. [Online]. Available: