ACPD
9, 23103–23140, 2009IASI measurements of tropospheric ozone over Chinese
megacities
G. Dufour et al.
Title Page
Abstract Introduction
Conclusions References
Tables Figures
◭ ◮
◭ ◮
Back Close
Full Screen / Esc
Printer-friendly Version
Interactive Discussion
Atmos. Chem. Phys. Discuss., 9, 23103–23140, 2009 www.atmos-chem-phys-discuss.net/9/23103/2009/ © Author(s) 2009. This work is distributed under the Creative Commons Attribution 3.0 License.
Atmospheric Chemistry and Physics Discussions
This discussion paper is/has been under review for the journal Atmospheric Chemistry and Physics (ACP). Please refer to the corresponding final paper in ACP if available.
IASI measurements of tropospheric ozone
over Chinese megacities: Beijing,
Shanghai, and Hong Kong
G. Dufour1, M. Eremenko1, J. Orphal1,2, and J.-M. Flaud1
1
Laboratoire Inter-universitaire des Syst `emes Atmosph ´eriques (LISA), UMR7583, Universit ´es Paris-Est et Paris 7, CNRS, Cr ´eteil, France
2
Institut f ¨ur Meteorologie und Klimaforschung, Forschungszentrum Karlsruhe, Germany Received: 7 August 2009 – Accepted: 19 October 2009 – Published: 2 November 2009 Correspondence to: G. Dufour (dufour@lisa.univ-paris12.fr)
ACPD
9, 23103–23140, 2009IASI measurements of tropospheric ozone over Chinese
megacities
G. Dufour et al.
Title Page
Abstract Introduction
Conclusions References
Tables Figures
◭ ◮
◭ ◮
Back Close
Full Screen / Esc
Printer-friendly Version
Interactive Discussion
Abstract
IASI observations of tropospheric ozone over Beijing, Shanghai and Hong Kong during one year have been analysed, demonstrating the capability of space-borne infrared nadir measurements to probe both seasonal and daily variations of lower tropospheric ozone around megacities on the regional scale. The monthly variations of lower
tropo-5
spheric ozone retrieved from IASI show the influence of the Asian summer monsoon that brings clean air masses from the Pacific during summer. They exhibit indeed a sharp ozone maximum in late spring and early summer (May–June) followed by a sum-mer minimum. The time periods and the intensities of the maxima and of the decreases are latitude-dependent: they are more pronounced in Hong Kong and Shanghai than
10
in Beijing. Moreover, IASI provides the opportunity to follow the spatial variations of ozone over the surroundings of each megacity as well as its daily variability. We show indeed that the large lower tropospheric ozone amounts observed with IASI are con-sistent with the highest population density distribution in each region, thus suggesting the anthropogenic origin of the large ozone amounts observed. Finally an analysis of
15
the mean daily ozone profiles over each region for selected periods with high ozone events shows that the high ozone amounts observed during winter are likely related to descents of ozone-rich air from the stratosphere whereas in spring and summer the tropospheric ozone is likely enhanced by photochemical production in polluted areas and/or in fire plumes.
20
1 Introduction
Ozone (O3) is a key trace gas in the troposphere that plays a significant role in
at-mospheric chemistry, air quality and atat-mospheric radiative forcing. It is not only an important greenhouse gas (Fishman et al., 1979), but also a secondary pollutant pro-duced by the photochemical oxidation of hydrocarbons and carbon monoxide in
pres-25
ACPD
9, 23103–23140, 2009IASI measurements of tropospheric ozone over Chinese
megacities
G. Dufour et al.
Title Page
Abstract Introduction
Conclusions References
Tables Figures
◭ ◮
◭ ◮
Back Close
Full Screen / Esc
Printer-friendly Version
Interactive Discussion
the atmosphere being the primary precursor of the hydroxyl radical (OH) which is the main oxidant in the troposphere. Surface ozone at high concentrations is a pernicious pollutant that causes damages to human health and vegetation (Seinfeld and Pandis, 1997).
Background tropospheric ozone concentrations have been increasing for over a
cen-5
tury especially in the Northern Hemisphere (Vingarzan, 2004). This increase is partly related to the growth of the emissions of ozone precursors (NOx). Although trends in tropospheric ozone vary both in sign and in magnitude depending on the considered regions, background ozone levels in northern midlatitudes have continued to rise over the last decades (Vingarzan, 2004; Oltmans et al., 2006). In Europe, North America
10
and Japan, tropospheric ozone levels increased in the 1970s and in the 1980s, but the increase has slowed down since the 1990s, and ozone levels even started to decrease in some regions, partly due to emission regulations applied in these countries (Oltmans et al., 2006). On the contrary, due to the rapid development of East Asia and in partic-ular China, emissions of ozone precursors, that were still at low concentrations in the
15
1970s, have rapidly increased in the past decade (Richter et al., 2005) and are now larger than the North American and European emissions (Akimoto, 2003). Therefore, the tropospheric ozone amounts produced over China are then increasing, thus having a significant regional influence on the temporal and spatial variabilities of air quality in East Asia, but also up to the hemispheric scale due to the long-range transport across
20
the Pacific (e.g. Jacob et al., 1999). Hence, monitoring of tropospheric ozone in this re-gion of the world is important to better quantify its sources and its impact on air quality, in order to better evaluate its trend and the impact of long-range transport.
In the last years, the number of ozone measurements and studies focusing on China has significantly increased either through routine measurements (Chan et al., 1998;
25
ACPD
9, 23103–23140, 2009IASI measurements of tropospheric ozone over Chinese
megacities
G. Dufour et al.
Title Page
Abstract Introduction
Conclusions References
Tables Figures
◭ ◮
◭ ◮
Back Close
Full Screen / Esc
Printer-friendly Version
Interactive Discussion
of the monsoon especially during summer have been studied for different regions of China (Xu et al., 1997; Liu et al., 2002; Ding et al., 2008; Lin et al., 2009). Also relatively long time-series of ozone measurements were reported for example for Hong Kong (e.g. Wang et al., 2009) and Beijing (e.g. Ding et al., 2008). However, these different studies are mainly based on surface or aircraft measurements with limited
5
spatial coverage, leading to a persistent question about the representativeness of the sites at the regional scale.
The spatial coverage of the new generation of nadir-looking instruments onboard polar-orbiting satellites (e.g. IASI, GOME2, TES, OMI) makes them very promising tools to monitor tropospheric ozone over large regions, helping then to assess these
10
problems related to air quality and transport. However retrieving tropospheric ozone from satellite observations is a challenging task because only a small part of the total atmospheric ozone is contained in the troposphere. The first satellite measurements of tropospheric ozone were obtained using ultraviolet-visible sounders (e.g. Fishmann et al., 2003; Liu et al., 2005) but this type of measurements has some limitations in the
15
mid- and high latitudes. On the other hand, the recent development of infrared nadir sounders allows accurate measurements of tropospheric ozone, with the advantage that the measurements are also possible during the night. The first demonstration of tropospheric ozone column retrieval using the infrared domain was made using the IMG (Interferometric Monitor for Greenhause gases) instrument (Turquety et al., 2002,
20
Coheur et al., 2005). Later on, the TES (Tropospheric Emission Spectrometer) instru-ment aboard the EOS-Aura satellite has also provided measureinstru-ments of tropospheric ozone (Worden et al., 2007) with first applications to air quality (Jones et al., 2008) and climate modelling (Worden et al., 2008). Finally recently, using measurements from the European IASI (Infrared Atmospheric Sounding Interferometer) instrument aboard
25
ACPD
9, 23103–23140, 2009IASI measurements of tropospheric ozone over Chinese
megacities
G. Dufour et al.
Title Page
Abstract Introduction
Conclusions References
Tables Figures
◭ ◮
◭ ◮
Back Close
Full Screen / Esc
Printer-friendly Version
Interactive Discussion
is worth noticing indeed that in contrast to TES, IASI has an excellent spatial coverage and is therefore well suited for measurements of tropospheric ozone with an air quality focus.
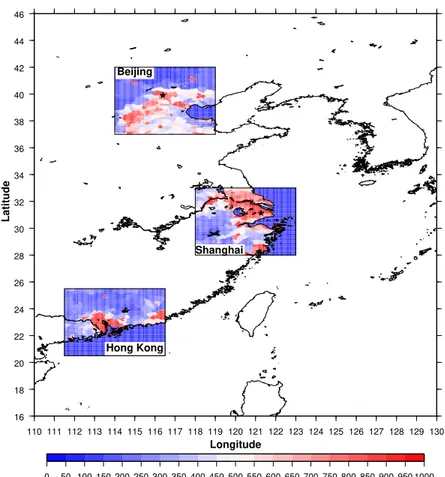
In this paper, we investigate the ability of the IASI instrument to monitor lower tropo-spheric ozone over the surroundings of three Chinese megacities (regions limited to 5◦
5
in latitude and longitude around each city): the northern part of the North China Plain (Beijing), the Yangtze River Delta (Shanghai), and the Pearl River Delta (Hong Kong) (Fig. 1). In particular we evaluate the possibilities of retrieving the seasonal variations of tropospheric ozone and also of probing its day-to-day variations. These regions have been selected because they enclose the largest Chinese megacities and large
indus-10
trial regions (the Pearl River Delta is the world’s major consumer goods manufacturing base) and because they lie in different latitudes from the tropics to the midlatitudes. The analyses are based on the first complete year of IASI operation: the year 2008. In the second section, the IASI instrument is described and the retrieval procedure is summarized. The third and fourth sections report on the seasonal variations of
tropo-15
spheric ozone observed by IASI in the three regions and on its day-to-day variations, respectively.
2 The IASI observations
2.1 The IASI instrument
The IASI (Infrared Atmospheric Sounding Interferometer) (Clerbaux et al., 2007)
in-20
strument is a nadir-viewing spectrometer onboard the European MetOp-A satellite. This satellite, launched in October 2006, flies in a polar sun-synchronous orbit (about 800 km altitude) and crosses the equator at two fixed local solar times 9:30 a.m.
(descending mode) and 9:30 p.m. (ascending mode). The IASI instrument is a
Fourier-transform spectrometer with a 2-cm optical path difference covering the 645–
25
ACPD
9, 23103–23140, 2009IASI measurements of tropospheric ozone over Chinese
megacities
G. Dufour et al.
Title Page
Abstract Introduction
Conclusions References
Tables Figures
◭ ◮
◭ ◮
Back Close
Full Screen / Esc
Printer-friendly Version
Interactive Discussion
half-maximum). The radiometric accuracy in noise-equivalent radiance temperature at 280 K is 0.28 K at 650 cm−1 and 0.47 K at 2400 cm−1. IASI measures the thermal infrared radiation emitted by the Earth’s surface and the atmosphere. The instrument scans the surface perpendicular to the satellite’s flight track with 15 individual views on each side of the track (across-track). The maximum scan angle of 48.3◦ from the nadir
5
corresponds to coverage of about 2200 km across-track for one swath.
The distance between two successive overpasses is 25◦ in longitude (i.e. 2800 km at the equator). Then, for latitudes higher than 45◦, the footprints of two successive overpasses overlap. At the nadir point, the ground pixel size (total field-of-view) is 50×50 km2. The total field-of-view is composed of 4 individual ground pixels with 12 km
10
diameter each.
The primary objectives of the IASI instrument are to deliver meteorological products (surface temperature, temperature and humidity profiles, and cloud information). How-ever the large spectral coverage, the high radiometric sensitivity and accuracy, and the rather high spectral resolution of the instrument allow deriving global distributions of
15
several important trace gases (such as O3, CO, NH3,. . . ) at high spatial resolution
(e.g. Eremenko et al., 2008; Turquety et al., 2009; Clarisse et al., 2009).
2.2 The retrieval method
The retrievals are performed using the radiative transfer model KOPRA (Karlsruhe Op-timised and Precise Radiative transfer Algorithm) and its inversion module KOPRAFIT
20
(Stiller et al., 2000), both adapted to the nadir-viewing geometry. A constrained least squares fit method with an analytical altitude-dependent regularization is used. The regularization method applied as well as the error calculations are detailed in Ere-menko et al. (2008). To summarize, the regularization matrix is a combination of zero, first and second order Thikonov constraints (Tikhonov, 1963) with altitude-dependent
25
ACPD
9, 23103–23140, 2009IASI measurements of tropospheric ozone over Chinese
megacities
G. Dufour et al.
Title Page
Abstract Introduction
Conclusions References
Tables Figures
◭ ◮
◭ ◮
Back Close
Full Screen / Esc
Printer-friendly Version
Interactive Discussion
in Eremenko et al. (2008), i.e. determined for summer midlatitude conditions. Note that the results of a validation study (Keim et al., 2009) show that, while the regularization matrix was built up for the summer period, it is valid as well also for the other seasons. Shanghai and Hong Kong lie in the tropics and the altitude-dependent regularization defined for the midlatitudes is not well adapted in this case, especially because the
5
tropopause height is higher in the tropics. Accordingly a regularization matrix has then been set for the tropical conditions using the same procedure as for the midlatitudes (Eremenko et al., 2008). The a priori profiles used during the retrievals are compiled from the climatology of McPeters et al. (2007) and are typical for the midlatitudes (Bei-jing) and for the 20–40◦N and the 10–30◦N latitude bands for Shanghai, and Hong
10
Kong, respectively. The same a priori profile has been used for all seasons.
The analysis of IASI data is performed in three steps. First, the effective surface temperature is retrieved from selected spectral windows between 800 and 950 cm−1 assuming a blackbody with an emissivity equal to unity. In the second step, the atmo-spheric temperature profile is retrieved from CO2lines in the 15µm spectral region and
15
using the ECMWF profiles as a priori. In the third step, the ozone profiles are retrieved from seven spectral windows located in the 975–1100 cm−1 region, that avoid strong water vapor lines. The spectroscopic parameters of the different species are from HI-TRAN 2004 (Rothman et al., 2005). Note that before starting the retrievals, the IASI spectra are filtered for cloud contamination. The cloud filter is based on tests on the
re-20
trieved surface temperature and on the shape of the baseline of the spectra (Eremenko et al., 2008). Only spectra for clear sky conditions are considered. A quality flag is also applied to the retrieved products to discard unphysical results (negative values, large oscillations).
The error budget, calculated for individual retrieved profile (see Eq. (3) in Eremenko
25
ACPD
9, 23103–23140, 2009IASI measurements of tropospheric ozone over Chinese
megacities
G. Dufour et al.
Title Page
Abstract Introduction
Conclusions References
Tables Figures
◭ ◮
◭ ◮
Back Close
Full Screen / Esc
Printer-friendly Version
Interactive Discussion
from 6 km up to the tropopause. The main contribution to the total error is the smooth-ing error. The total error in the columns is calculated from the error budget determined for the profile (see Eq. (4) in Eremenko et al., 2008). In fact the error on each retrieved concentration translates to a total error onto the 0–6 km columns that ranges from 10 to 20% – corresponding to less than 3 Dobson Units (DU) – for the 3 cities considered
5
in the paper. A validation exercise performed over the first one-year-and-a-half of IASI operation for the northern midlatitudes shows that no significant bias (less than 5%) exists in the retrieved columns and that the errors derived from the error budget cal-culation are consistent with the standard deviation of the differences between sonde measurements and IASI observations (Keim et al., 2009). Examples of tropospheric
10
averaging kernels are presented in Fig. 2 for each of the three megacities considered in the present study. Figure 2 suggests that the ozone from the lower and the upper troposphere can be separated from the IASI observations. The limit between these two distinguishable parts of the troposphere is about 6 km for Beijing and about 8–9 km for Shanghai and Hong Kong (Fig. 2). The averaging kernels of the lower tropospheric
15
ozone have a maximum between 2 and 3 km for Beijing and a little higher (between 3 and 4 km) for Shanghai and Hong Kong. Nevertheless, there are not two really in-dependent pieces of information in the troposphere. Indeed, the degrees of freedom range between 1.4 and 1.8 in the cases displayed in Fig. 2. Note that the retrieved ozone products are profiles but due to the lack of vertical sensitivity, we mainly present
20
partial tropospheric columns in this paper.
3 Seasonal variation of tropospheric ozone over Beijing, Shanghai, and Hong Kong
Ozone in the troposphere presents an annual cycle that varies as a function of the location (Monks, 2000; Logan, 1999; Vingarzan, 2004). Monks (2000) reports in a
25
ACPD
9, 23103–23140, 2009IASI measurements of tropospheric ozone over Chinese
megacities
G. Dufour et al.
Title Page
Abstract Introduction
Conclusions References
Tables Figures
◭ ◮
◭ ◮
Back Close
Full Screen / Esc
Printer-friendly Version
Interactive Discussion
broad summer maximum. Zbinden et al. (2006) report on climatological measurements made within the MOZAIC framework (Marenco et al., 1998) and show that tropospheric ozone presents a broad summer maximum over different European and North Amer-ican cities. This broad summer maximum is mainly attributed to photochemical pro-duction. In East Asia, the seasonal variations of surface and tropospheric ozone are
5
not driven by the same processes especially during the summer monsoon. Several studies report on these seasonal variations at different locations of Eastern China and Japan (e.g. Chan et al., 1998; Naja and Akimoto, 2004; Kim et al., 2006; Li et al., 2007; Ding et al., 2008; He et al., 2008). They show a sharp maximum in late spring and a minimum during summer (July, August especially). The timing of the sharp maximum
10
varies with longitude and altitude (Kim et al., 2006). Different processes can contribute to this maximum. A first hypothesis is the accumulation of ozone precursors during winter that are processed when radiation and temperature increase, coupled with an increase of photochemical production (Penkett and Brice, 1986; Penkett et al., 1993). Another process that can also contribute is the stratospheric-tropospheric exchange
15
that can bring ozone-rich air from the stratosphere down to the free troposphere and the surface (Monks, 2000). In East China, biomass burning can also play a significant role in the increase of ozone and precursors in late spring and early summer (e.g. Liu et al., 1999; Pochanart et al., 2003). The key mechanism that contributes to the summer minimum is the intrusion of low-ozone marine air masses coming from the tropical
Pa-20
cific (e.g. Lin et al., 2009). Actually, the flow direction becomes more southerly during the Asian summer monsoon bringing clean air masses from the Pacific (e.g. Ding et al., 2008; Liu et al; 2002). The influence of the summer monsoon is more pronounced in the South than in the North of China. A second maximum in fall is reported for measurements performed in Southern China, in the area of Hong Kong (Chan et al.,
25
1998).
ACPD
9, 23103–23140, 2009IASI measurements of tropospheric ozone over Chinese
megacities
G. Dufour et al.
Title Page
Abstract Introduction
Conclusions References
Tables Figures
◭ ◮
◭ ◮
Back Close
Full Screen / Esc
Printer-friendly Version
Interactive Discussion
(consecutive swaths do not overlap below 40◦N) and due to the increase of cloud cover during the monsoon period, a satisfactory daily coverage for the considered area is difficult to reach especially in summer as shown by the percentages of cloud free and quality flagged columns considered for each city per month (Fig. 3). We then chose to calculate a global monthly average including all the data for each month without any
5
pooling per day. We checked also that the monthly spatial coverage of the data was sufficiently homogeneous over each of the considered regions.
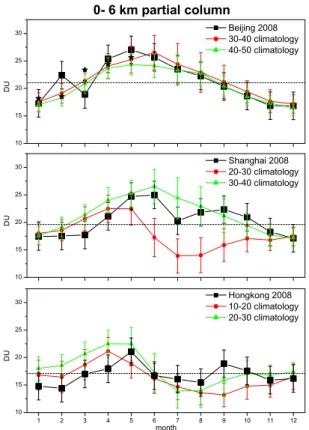
In Fig. 4, the monthly variations of the 0–6 km ozone column are compared to the climatological monthly variations for the corresponding latitude bands calculated from the McPeters et al. (2007) climatology. The climatological variabilities attached to each
10
climatological monthly mean are also plotted in Fig. 4. Note that the climatological partial columns considered here are determined for latitude bands, including longitudes outside Asia. Then, the climatological columns do not especially reflect the Asian monsoon influence contrary to the IASI observations.
3.1 Beijing area 15
Previous studies report on the influence of the Asian summer monsoon up to North-ern China, Korea and Japan (e.g. Ding et al., 2008; Naja and Akimoto, 2004; Kim et al., 2006). Ding et al. (2008) present a climatology of tropospheric ozone over Bei-jing based on aircraft data from the MOZAIC program. They show that the influence of the summer monsoon is more pronounced in the lowest layers of the troposphere
20
with a sharp decrease in July for the layer between the surface and 600 m (note that IASI is not very sensitive to the ozone surface layer, Fig. 2). The maximum broadens for higher altitudes and the decrease is smoothed. The sharp maximum in May-June at the surface level leaves place to a broad summer maximum between 4 and 8 km (see Fig. 4 in Ding et al., 2008). The monthly mean 0–6 km partial columns of ozone
25
de-ACPD
9, 23103–23140, 2009IASI measurements of tropospheric ozone over Chinese
megacities
G. Dufour et al.
Title Page
Abstract Introduction
Conclusions References
Tables Figures
◭ ◮
◭ ◮
Back Close
Full Screen / Esc
Printer-friendly Version
Interactive Discussion
crease to finally reach a minimum in early winter. This smooth decrease (Fig. 4) is consistent with the MOZAIC climatology with a smooth decrease starting in June (Ding et al., 2008). Similar seasonal cycles with an ozone maximum in early summer are visible at most of the tropospheric altitudes from the monthly mean profiles (Fig. 5a): the maximum is shifting from May to June between 5 and 7 km. The one-month delay
5
in the ozone maximum is likely related to the time needed for the transport between the lowest layers of the troposphere and the free/upper troposphere as already noticed by Kim et al. (2006). This suggests, as already mentioned in Sect. 2, that typical be-haviours of the lower troposphere and of the upper troposphere seem to be retrievable independently from the IASI observations, although the number of independent pieces
10
of information are limited in the troposphere (smaller than 2 for the whole troposphere, Fig. 2). For a detailed view of the one-month delay, we plotted two individual levels representative of the lower and free troposphere (3 and 8 km respectively) in Fig. 6. Comparison with the climatology given for the 40–50◦N latitude band at 3 km (Fig. 6) shows:
15
1. broader maximum for the climatology. The difference between the duration of the summer maximum of the climatology and of the IASI measurement over Beijing illustrates the impact of the Asian summer monsoon in the Beijing area. Indeed, the flow of clean air imported from the Pacific reduces the ozone level during summer in the lower troposphere.
20
2. The ozone concentration is up to 10 ppbv larger during the April to July period over Beijing than the climatological values for the 40–50◦N latitude band that should represent background ozone in the latitude band. The largest value (about 70 ppbv) is in agreement with the climatological values derived from the MOZAIC measurements above Beijing (Ding et al., 2008). However, the significance of
25
ACPD
9, 23103–23140, 2009IASI measurements of tropospheric ozone over Chinese
megacities
G. Dufour et al.
Title Page
Abstract Introduction
Conclusions References
Tables Figures
◭ ◮
◭ ◮
Back Close
Full Screen / Esc
Printer-friendly Version
Interactive Discussion
on the other hand because of the variability associated to each monthly climato-logical value.
Large tropospheric ozone columns are observed in February 2008 compared to Jan-uary 2008 and March 2008 and to the climatology (Fig. 4). The monthly mean for the beginning of 2009 are added in Fig. 4 (stars) for comparison and do not exhibit a
simi-5
lar enhancement in February. A possible explanation for the enhanced 0-6 km columns observed in February 2008 is a descent of stratospheric air rich in ozone: large values in February are observed up to the stratosphere (Fig. 5a). Note also that the difference between the mean columns observed in March 2008 and March 2009 are certainly not related to different geophysical conditions between the two years but more certainly
10
arises from a sampling issue of IASI. In March 2008, observations were made only during the first half of March whereas the 2009 observations were made during the whole month of March 2009.
Figure 7 shows the monthly mean 0–6 km columns of ozone, resolved in space, in the region of Beijing. The seasonal cycle is also well visible with a maximum in May
15
but with additional information on the spatial distribution of ozone in the area. The largest ozone columns are observed over the northern part of the North China Plain and are located in the vicinity of the most populated parts of the region as expected. As mentioned previously, the explanation of these large ozone columns is a combination of several processes: photochemical production from local anthropogenic sources but
20
also from biomass burning sources, activation of precursors accumulated during winter, and stratospheric-tropospheric exchange. Dedicated model studies will be necessary to identify the relative contribution of each process.
3.2 Shanghai area
The monthly mean 0–6 km columns of ozone over the Shanghai area (31.13◦N,
25
ACPD
9, 23103–23140, 2009IASI measurements of tropospheric ozone over Chinese
megacities
G. Dufour et al.
Title Page
Abstract Introduction
Conclusions References
Tables Figures
◭ ◮
◭ ◮
Back Close
Full Screen / Esc
Printer-friendly Version
Interactive Discussion
maximum in May–June is observed but contrary to Beijing, a sharp drop of the 0–6 km ozone columns occurs in July. The seasonal cycle observed from IASI data is in fair agreement with the climatological variations reported for the 20–30◦N latitude band, except that the maximum is observed one month later in 2008 with IASI. On the other hand the measured 0–6 km columns values are larger and more representative of the
5
30–40◦N latitude band. The balloon sonde stations used by McPeters et al. (2007) for the climatology of the 20–30◦N latitude band include two Japanese stations among the three stations considered. These two stations certainly strongly suffer from the Asian monsoon influence during summer: the climatology for this latitude band is then partly representative of the monsoon effect on ozone concentrations. Kim et al. (2006)
re-10
ports on the seasonal cycles of ozone for different altitudes in Korea for latitudes close to those of Shanghai and show that a sharp drop of ozone concentrations occur in July between 1 and 5 km (see Fig. 2 in Kim et al., 2006) as shown with the IASI observa-tions for the Shanghai region. This sharp drop is attributed to the summer monsoon that brings clean air from the tropical Pacific. Kim et al. (2006) describe also a shift in
15
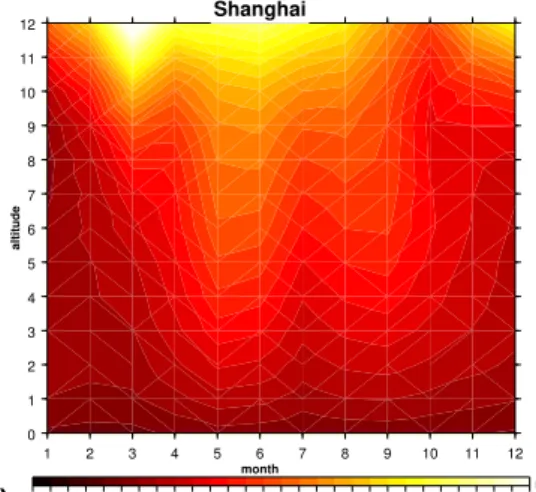
the timing of the ozone maximum between Korea and Japan, with the ozone maximum in Japan occurring one month earlier. This strongly suggests that the shift observed between the IASI observations over Shanghai and the 20–30◦N latitude band climatol-ogy (mainly based on Japanese sites) is true. The seasonal cycle with a sharp drop in July is visible in the IASI data up to 8 km and changes to a broader maximum in the
up-20
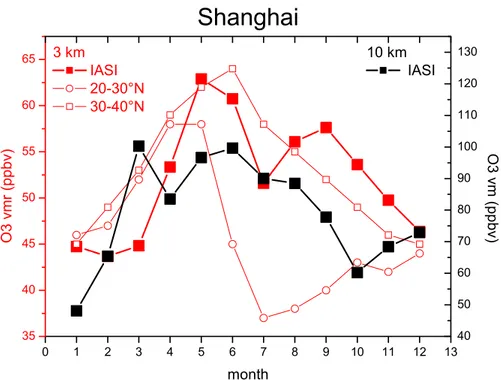
per troposphere for altitudes larger than 10 km (Fig. 5b). The difference in the seasonal variations in the lower and the upper troposphere is illustrated for two representative levels (3 and 10 km respectively) in Fig. 8. This suggests, as already mentioned in Sect. 2, that one is able to discriminate between the lower and the upper tropospheric seasonal cycle with the IASI observations, despite the small degrees of freedom of the
25
ACPD
9, 23103–23140, 2009IASI measurements of tropospheric ozone over Chinese
megacities
G. Dufour et al.
Title Page
Abstract Introduction
Conclusions References
Tables Figures
◭ ◮
◭ ◮
Back Close
Full Screen / Esc
Printer-friendly Version
Interactive Discussion
affected by the Asian monsoon (shown by the 20–30◦N latitude band, Fig. 8). The one-month shift of the maximum has already been discussed above. The ozone con-centrations retrieved from IASI are nevertheless closer to those of the 30–40◦ latitude band, especially after the drop in July (Fig. 8 and 4). One explanation of this is that the Shanghai area is more influenced by air masses coming from northern latitudes
5
with characteristics similar to the 30–40◦N latitude band. Another possible explanation can also be that air masses observed by IASI over Shanghai during this period (August to October) are affected by local enhanced photochemical production due to pollution (and/or biomass burning). This second hypothesis suggests an anthropogenic origin of the second maximum observed over Shanghai in early fall, as reported for the Hong
10
Kong area (Liu et al., 2002).
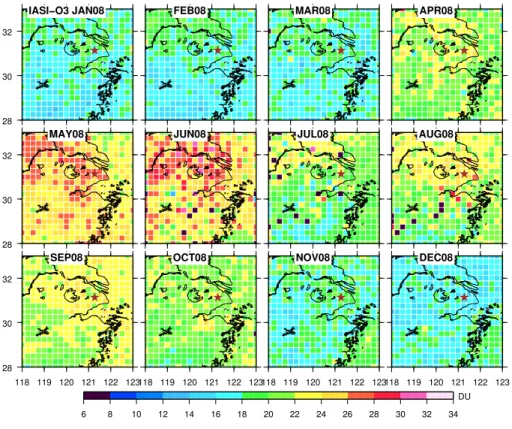
The monthly mean spatial distribution of the 0–6 km ozone columns measured with IASI is displayed in Fig. 9. The June maximum shown in Fig. 4 is also well visible in Fig. 9 with the maxima mainly located along the Yangtze River where the density of population is the largest one.
15
3.3 Hong Kong area
The monthly mean 0–6 km columns of ozone over the Hong Kong area (22.25◦N,
114.17◦E) are reported in the bottom panel of Fig. 4 and compared to the correspond-ing climatology of the 10–20◦N and 20–30◦N latitude bands. The seasonal cycle of ozone as shown by the IASI columns exhibits one maximum in May and a second
20
significant maximum in September–October. The agreement with the climatological column values is rather good but with smaller IASI columns during winter (January to April). The ozone maximum observed with IASI (May) occurs at the same time as the one derived from the climatology for the 20–30◦N latitude band. On the other hand it is shifted by one month as compared to the 10–20◦N latitude band. However, it is
25
ACPD
9, 23103–23140, 2009IASI measurements of tropospheric ozone over Chinese
megacities
G. Dufour et al.
Title Page
Abstract Introduction
Conclusions References
Tables Figures
◭ ◮
◭ ◮
Back Close
Full Screen / Esc
Printer-friendly Version
Interactive Discussion
with IASI in fall, several studies based on time series performed at a surface site or with ozone sonde measurements close to Hong Kong report also such a maximum in fall (Chan et al., 1998; Lam et al., 2001; Wang et al., 2009) mainly in the two lowest kilometres (Chan et al., 1998). This maximum is attributed to a photochemical pro-duction due to pollution (Liu et al., 2002). IASI retrieved columns and concentrations
5
of ozone (Figs. 4 and 10) are significantly larger than those of the climatologies. This would be consistent with the anthropogenic origins of the observed maximum (Liu et al., 2002). The IASI observations suggest that the ozone maxima in late spring and fall persist up to about 10 km (Fig. 5c) and the seasonal cycle presents a broad sum-mer maximum for upper altitudes (Fig. 10). Again, these results show the ability of
10
discriminating between the lower and the upper tropospheric seasonal cycle of ozone with the IASI observations despite the small degrees of freedom of the IASI retrievals in the troposphere (Fig. 2). However, the persistence of the second ozone maximum up to 10 km in the Hong Kong case needs further investigations as this maximum is only reported for the lowest layers in literature. It might be partly due to the low vertical
15
resolution of IASI.
The monthly mean spatial distribution of the 0–6 km ozone columns measured with IASI is displayed in Fig. 11. The late spring maximum is well visible with the largest ozone columns in the vicinity of the main cities of the area. The maximum in fall is especially visible in September and the largest ozone columns are also close to the
20
main cities, suggesting a photochemical production. During winter the distribution of ozone columns is rather uniform in the Hong Kong region.
4 Day to day variation of tropospheric ozone over Beijing and Shanghai
In the previous section, we showed that, using IASI measurements, it is possible to de-rive seasonal variations of tropospheric ozone representative of the lower troposphere.
25
ACPD
9, 23103–23140, 2009IASI measurements of tropospheric ozone over Chinese
megacities
G. Dufour et al.
Title Page
Abstract Introduction
Conclusions References
Tables Figures
◭ ◮
◭ ◮
Back Close
Full Screen / Esc
Printer-friendly Version
Interactive Discussion
area, the temporal coverage of the satellite instrument at this latitude leads to gaps between consecutive swaths and then to gaps in the daily coverage of the Hong Kong region. This, combined with significant cloud cover especially during summer, does not allow following the day-to-day evolution of tropospheric ozone in this region. On the contrary the temporal coverage of the IASI satellite instrument improves with the
5
latitude and becomes satisfactory for the regions of Shanghai and Beijing allowing one to follow the daily variations of tropospheric ozone over these two spatial regions.
The upper panels of Figs. 12 and 13 show the mean daily 0–6 km ozone columns over Beijing during February and April, respectively. The bottom parts of these figures show the spatial distribution of the columns for 4 selected days (red circles) during
10
which events of large tropospheric ozone amounts are detected with IASI. The anal-ysis of the mean daily profiles retrieved for the 4-days period (Fig. 14) shows large ozone values in the stratosphere and low ozone values in the troposphere on 7 Febru-ary. This changes to large ozone values in both troposphere and stratosphere on 8 February and is followed by lower values in both the troposphere and the
strato-15
sphere on 9 and 10 February. This suggests that the large concentrations observed in the lower troposphere on 8 February are due to a descent of stratospheric air for this specific day. In April the situation is different, the stratospheric values are similar for the 4 days. Only the tropospheric part of the ozone profiles is enhanced on 16 and 17 April, suggesting that the large ozone tropospheric amounts are from various tropospheric
20
origins: pollution with enhanced photochemical production, biomass burning, etc. The fact that a large number of cloudy pixels are detected during the last day of the period indicates that the meteorological situation has changed. The polluted air masses could have been mixed with clean air masses or/and washout by rain implying a reduction of ozone amounts as observed on 18 April. This would support the tropospheric origins
25
of the ozone episode detected for this period.
ACPD
9, 23103–23140, 2009IASI measurements of tropospheric ozone over Chinese
megacities
G. Dufour et al.
Title Page
Abstract Introduction
Conclusions References
Tables Figures
◭ ◮
◭ ◮
Back Close
Full Screen / Esc
Printer-friendly Version
Interactive Discussion
of the mean daily profiles retrieved for these 4 days (Fig. 14) shows: similar lower tropospheric ozone for the first two days, 3 and 4 June, whereas the lower tropospheric ozone amounts are smaller on 5 and 6 June, but with similar upper tropospheric – lower stratospheric (UTLS) ozone concentrations as on the 4 June. This supports a lower tropospheric origin (pollution with enhanced photochemical production, etc.) for
5
the enhanced ozone concentrations on the 3 and 4 June. However, the UTLS ozone concentrations on 4 June are larger than on 3 June and this may also imply that some of the large ozone concentrations observed in the 0–6 km range have a higher-altitude origin.
5 Conclusions 10
In this paper we have studied one year of IASI observations of tropospheric ozone over three Chinese megacities and their surroundings (5◦
×5◦in latitude and longitude
around each city). The monthly mean variations of lower tropospheric ozone mea-sured with IASI (partial columns and profiles) show the influence of the summer Asian monsoon on the ozone concentrations with a sharp maximum in late spring and early
15
summer (May–June) followed by a decrease during summer. The intensity of this de-crease depends on the latitude: the drop is sharper for the tropical latitudes (Hong Kong and Shanghai) than for the midlatitudes (Beijing).
Moreover, the ozone values as observed by IASI, given either as partial columns or as concentrations for the given altitude, are larger than the ozone values derived from
20
climatologies. Despite the fact that the error budgets associated with the retrievals show errors slightly larger than the difference observed with the climatology, it is worth noting that a validation study (Keim et al., 2009) does not reveal any significant sys-tematic bias in the IASI retrievals (<5%). Thus, one can consider that these differences with the climatologies are significant in particular when considering monthly averages.
25
ACPD
9, 23103–23140, 2009IASI measurements of tropospheric ozone over Chinese
megacities
G. Dufour et al.
Title Page
Abstract Introduction
Conclusions References
Tables Figures
◭ ◮
◭ ◮
Back Close
Full Screen / Esc
Printer-friendly Version
Interactive Discussion
in Shanghai and Hong Kong. One hypothesis to explain the larger ozone amounts ob-served with IASI above the three largest Chinese cities is the enhanced photochemical production of ozone due to pollution events or biomass burning. These origins are al-ready reported in the literature. The monthly mean spatial ozone distributions over the three megacities partly support the hypothesis of an anthropogenic origin of the large
5
ozone amounts observed. Indeed, the large ozone amounts are rather well correlated with the largest populated areas.
Moreover, the spatial and temporal coverage of IASI observations allowed us to fol-low the daily variations (spatially resolved) of ozone over Beijing and Shanghai. Se-lected time periods with enhanced ozone detected with IASI have been analysed. We
10
show that the large ozone amount observed in the lower troposphere during winter has likely a stratospheric origin. On the contrary, the large ozone amounts observed in the lower troposphere in spring and summer are more certainly related to an en-hanced photochemical production of ozone linked to anthropogenic origins (pollution or biomass burning).
15
Finally, the results presented in this paper demonstrate the ability to discriminate, using the IASI measurements, between the different behaviours of the lower and the upper troposphere despite a limited number of degrees of freedom in the troposphere (around 1.5). This looks very promising for assessing air quality and transport of pollu-tion.
ACPD
9, 23103–23140, 2009IASI measurements of tropospheric ozone over Chinese
megacities
G. Dufour et al.
Title Page
Abstract Introduction
Conclusions References
Tables Figures
◭ ◮
◭ ◮
Back Close
Full Screen / Esc
Printer-friendly Version
Interactive Discussion
Acknowledgements. We thank the Institut f ¨ur Meteorologie und Klimaforschung (IMK), Karl-sruhe, Germany, for a licence to use the KOPRA radiative transfer model, and especially M. H ¨opfner for his help to set up the code. We thank the ETHER database (CNRS, INSU, CNES) in France for providing access to IASI Level 1 data. This study was supported by the French Space Agency CNES (project “IASI-TOSCA”).
5
The publication of this article is financed by CNRS-INSU.
References
Akimoto, H.: Global air quality and pollution, Science, 302, 1716–1719, 2003.
10
Chan, L. Y., Liu, H. H. Y., Lam, K. S., Wang, T., Oltmans, S. J., and Harris, J. M.: Analysis of the seasonal behaviour of tropospheric ozone at Hong Kong, Atmos. Environ., 32, 159–168, 1998.
Center for International Earth Science Information Network (CIESIN), Columbia University, United Nations and Agriculture Programme (FAO), and Cnetro Internacional de Agricultura
15
Tropical (CIAT): Gridded Population of the World: Future Estimates (GWPFE), Palisades, NY, Socioeconomic Data and Applications Center (SEDAC), Columbia University, available at: http://sedac.ciesin.columbia.edu/gpw, 2005 (last access: 17 July 2009).
Clarisse, L., Clerbaux, C., Dentener, F., Hurtmans, D., and Coheur, P. F.: Global ammonia distribution derived from infrared satellite observations, Nat. Geosci., 2, 479–483, 2009.
20
ACPD
9, 23103–23140, 2009IASI measurements of tropospheric ozone over Chinese
megacities
G. Dufour et al.
Title Page
Abstract Introduction
Conclusions References
Tables Figures
◭ ◮
◭ ◮
Back Close
Full Screen / Esc
Printer-friendly Version
Interactive Discussion
Coheur, P.-F., Barret, B., Turquety, S., Hurtmans, D., Hadji-Lazaro, J., and Clerbaux, C.: Re-trieval and characterization of ozone vertical profiles from a thermal infrared nadir sounder, J. Geophys. Res., 110, D24303, doi:10.1029/2005JD005845, 2005.
Ding, A. J., Wang, T., Thouret, V., Cammas, J.-P., and N ´ed ´elec, P.: Tropospheric ozone cli-matology over Beijing: analysis of aircraft data from the MOZAIC program, Atmos. Chem.
5
Phys., 8, 1–13, 2008, http://www.atmos-chem-phys.net/8/1/2008/.
Eremenko, M., Dufour, G., Foret, G., Keim, C., Orphal, J., Beekmann, M., Bergametti, G., and Flaud, J.-M.: Tropospheric ozone distributions over Europe during the heat wave in July 2007 observed from infrared nadir spectra recorded by IASI, Geophys. Res. Lett., 35, L18805, doi:10.1029/2008GL034803, 2008.
10
Fishman, J., Ramanathan, V., Crutzen, P. J., and Liu, S. C.: Tropospheric ozone and climate, Nature, 282, 818–820, 1979.
Fishman, J., Wozniak, A. E., and Creilson, J. K.: Global distribution of tropospheric ozone from satellite measurements using the empirically corrected tropospheric ozone residual tech-nique: Identification of the regional aspects of air pollution, Atmos. Chem. Phys., 3, 893–907,
15
2003, http://www.atmos-chem-phys.net/3/893/2003/.
He, Y. J., Uno, I., Wang, Z. F., Pochanart, P., Li, J., and Akimoto, H.: Significant impact of the East Asia monsoon on ozone seasonal behavior in the boundary layer of Eastern China and the west Pacific region, Atmos. Chem. Phys., 8, 7543–7555, 2008,
http://www.atmos-chem-phys.net/8/7543/2008/.
20
Jacob, D. J., Logan, J. A., and Murti, P. P.: Effect of rising Asian emissions on surface ozone in the United States, Geophys. Res. Lett., 26, 2175–2178, 1999.
Jones, D. B. A., Bowman, K. W., Horowitz, L. W., Thompson, A. M., Tarasick, D. W., and Witte, J. C.: Estimating the summertime tropospheric ozone distribution over North Amer-ica through assimilation of observations from the Tropospheric Emission Spectrometer, J.
25
Geophys. Res., 113, D18307, doi:10.1029/2007JD009341, 2008.
Keim, C., Eremenko, M., Orphal, J., Dufour, G., Flaud, J.-M., H ¨opfner, M., Boynard, A., Cler-baux, C., Payan, S., Coheur, P.-F., Hurtmans, D., Claude, H., Dier, H., Johnson, B., Kelder, H., Kivi, R., Koide, T., L ´opez Bartolom ´e, M., Lambkin, K., Moore, D., Schmidlin, F. J., and St ¨ubi, R.: Tropospheric ozone from IASI: comparison of different inversion algorithms and
30
validation with ozone sondes in the northern middle latitudes, Atmos. Chem. Phys. Discuss., 9, 11441–11479, 2009,
ACPD
9, 23103–23140, 2009IASI measurements of tropospheric ozone over Chinese
megacities
G. Dufour et al.
Title Page
Abstract Introduction
Conclusions References
Tables Figures
◭ ◮
◭ ◮
Back Close
Full Screen / Esc
Printer-friendly Version
Interactive Discussion
Kim, J. H., Lee, H. J., and Lee, S. H.: The characteristics of tropospheric ozone seasonality observed from ozone soudings at Pohang, Korea, Environ. Monit. Assess., 118, 1–12, 2006. Lam, K. S., Wang, T. J., Chan, L. Y., Wang, T., and Harris, J.: Flow patterns influencing the
seasonal behaviour of surface ozone and carbon monoxide at a coastal site near Hong Kong, Atmos. Environ., 35, 3121–3135, 2001.
5
Li, J., Wang, Z., Akimoto, H., Gao, C., Pochanart, P., and Wang, X.: Modeling study of ozone seasonal cycle in lower troposphere over east Asia, J. Geophys. Res., 112, D22S25, doi:10.1029/2006JD008209, 2007.
Lin, W., Xu, X., Zhang, X., and Tang, J.: Contributions of pollutants from North China Plain to surface ozone at the Shangdianzi GAW Station, Atmos. Chem. Phys., 8, 5889–5898, 2008,
10
http://www.atmos-chem-phys.net/8/5889/2008/.
Lin, M., Holloway, T., Oki, T., Streets, D. G., and Richetr, A.: Mechanisms controlling surface ozone over East Asia: A multiscale study coupling regional and global chemical transport models, Atmos. Chem. Phys., 9, 3277–3301, 2009,
http://www.atmos-chem-phys.net/9/3277/2009/.
15
Liu, H., Chang, W. L., Oltmans, S. J., Chan, L. Y., and Harris, J. M.: On springtime high ozone events in the lower troposphere from Southeast Asian biomass burning, Atmos. Environ., 33, 2403–2410, 1999.
Liu, H., Jacob, D. J., Chan, L. Y., Oltmans, S. J., Bey, I., Yantosca, R. M., Harris, J. M., Duncan, B. N., and Martin, R. V.: Sources of tropospheric ozone along the Asian Pacific Rim: an
anal-20
ysis of ozonesonde observations, J. Geophys. Res., 107, 4573, doi:10.1029/2001JD002005, 2002.
Liu, X., Chance, K. V., Sioris, C. E., Spurr, R. J. D., Kurosu, T. P., Martin, R. V., and Newchurch, M. J.: Ozone profile and tropospheric ozone retrievals from Global Ozone Mon-itoring Experiment: Algorithm description and validation, J. Geophys. Res., 110, D20307,
25
doi:10.1029/2005JD006240, 2005.
Logan, J. A.: An analysis of ozonesonde data for the troposphere: Recommendations for test-ing 3-D modes and development of gridded climatology for tropospheric ozone, J. Geophys. Res., 105(D2), 16115–16149, 1999.
Marenco, A., Thouret, V., Nedelec, P., Smit, H., Helten, M., Kley, D., Karcher, F., Simon, P., Law,
30
ACPD
9, 23103–23140, 2009IASI measurements of tropospheric ozone over Chinese
megacities
G. Dufour et al.
Title Page
Abstract Introduction
Conclusions References
Tables Figures
◭ ◮
◭ ◮
Back Close
Full Screen / Esc
Printer-friendly Version
Interactive Discussion
McPeters, R. D., Labow, G. J., and Logan, J. A.: Ozone climatological profiles for satellite retrieval algorithms, J. Geophys. Res., 112, D05308, doi:10.1029/2005JD006823, 2007. Monks, P. S.: A review of the observations and origins of the spring ozone maximum, Atmos.
Environ., 34, 3545–3561, 2000.
Naja, M. and Akimoto, H.: Contribution of regional pollution and long-range transport to the
5
Asia-Pacific region: Analysis of long-term ozonesonde data over Japan, J. Geophys. Res., 109, D21306, doi:10.1029/2004JD004687, 2004.
Oltmans, S. J., Lefohn, A. S., Harris, J. M., Galbally, I., Scheel, H. E., Bodeker, G., Brunke, E., Claude, H., Tarsick, D., Johnson, B. J., Simmonds, P., Shadwick, D., Anlauf, K., Hayden, K., Schmidlin, F., Fujimoto, T., Akagi, K., Meyer, C., Nichol, S., Davies, J., Redondas, A., and
10
Cuevas, E.: Long-term changes in tropospheric ozone, Atmos. Environ., 40, 3156–3173, 2006.
Penkett, S. A. and Brice, K. A.: The spring maximum in photooxidants in the Northern Hemi-sphere tropoHemi-sphere, Nature, 319, 655–658, 1986.
Penkett, S. A., Blake, N. J., Lightmann, P., Mardr, A. R. W., Ancoyl, P., and Butcher, G.: The
sea-15
sonal variation of nonmethane hydrocarbons in the free troposphere over the North Atlantic Ocean: Possible evidence for extensive reaction of hydrocarbons with the nitrate radical, J. Geophys. Res., 98, 2865–2885, 1993.
Pochanart, P., Akimoto, H., Kaji, Y., and Sukasem, P.: Regional background ozone and car-bon monoxide variations in remote Siberia/East Asia, J. Geophys. Res., 108(D1), 4028,
20
doi:10.1029/21001JD001412, 2003.
Richter, A., Burrows, J. P., Nub, H., Granier, C., and Niemeier, U.: Increase in tropospheric nitrogen dioxide over China observed from space, Nature, 437, 129–132, 2005.
Rothman, L. S. , Jacquemart, D., Barbe, A., Chris Benner, D., Birk, M., Brown, L. R., Carleer, M. R., Chackerian Jr., C., Chance, K., Coudert, L. H., Dana, V., Devi, V. M., Flaud, J.-M.,
25
Gamache, R. R., Goldman, A., Hartmann, J.-M., Jucks, K. W., Maki, A. G., Mandin, J.-Y., Massie, S. T., Orphal, J., Perrin, A., Rinsland, C. P., Smith, M. A. H., Tennyson, J., Tolchenov, R. N., Toth, R. A., Vander Auwera, J., Varanasi, P., and Wagner, G.: The HITRAN 2004 molecular spectroscopic database, J. Quant. Spectrosc. Ra., 96, 139–204, 2005.
Seinfeld, J. H. and Pandis, S. N.: Atmospheric Chemistry and Physics, from Air Pollution to
30
Climate Change, John Wiley and Sons Inc., Toronto, Canada, 1997.
Lin-ACPD
9, 23103–23140, 2009IASI measurements of tropospheric ozone over Chinese
megacities
G. Dufour et al.
Title Page
Abstract Introduction
Conclusions References
Tables Figures
◭ ◮
◭ ◮
Back Close
Full Screen / Esc
Printer-friendly Version
Interactive Discussion
der, M., Stiller, G. P., and Zorn, S.: The Karlsruhe Optimized and Precise Radiative Trans-fer Algorithm (KOPRA), Vol. FZKA 6487 of Wissenschaftliche Berichte, Forschungszentrum Karlsruhe, Germany, 2000.
Tikhonov, A.: On the Solution of Incorrectly Stated Problems and a Method of Regularisation, Dokl. Acad. Nauk SSSR, 151, 501–504, 1963.
5
Turquety, S., Hadji-Lazaro, J., and Clerbaux, C.: First satellite ozone distributions re-trieved from nadir high-resolution infrared spectra, Geophys. Res. Lett., 29, 2198, doi:10.1029/2002GL016431, 2002.
Turquety, S., Hurtmans, D., Hadji-Lazaro, J., Coheur, P.-F., Clerbaux, C., Josset, D., and Tsamalis, C.: Tracking the emission and transport of pollution from wildfires using the IASI
10
CO retrievals: analysis of the summer 2007 Greek fires, Atmos. Chem. Phys., 9, 4897–4913, 2009,
http://www.atmos-chem-phys.net/9/4897/2009/.
Vingarzan, R.: A review of surface ozone background levels and trends, Atmos. Environ., 38, 3431–3442, 2004.
15
Wang, T., Wei, X. L., Ding, A. J., Poon, C. N., Lam, K. S., Li, Y. S., Chan, L. Y., and Anson, M.: Increasing surface ozone concentrations in the background atmosphere of Southern China, 1994-2007, Atmos. Chem. Phys., 9, 6217–6227, 2009,
http://www.atmos-chem-phys.net/9/6217/2009/.
Worden, H. M., Logan, J. A., Worden, J. R., Beer, R., Bowman, K., Clough, S. A., Eldering,
20
A., Fisher, B. M., Gunson, M. R., Herman, R. L., Kulawik, S. S., Lampel, M. C., Luo, M., Megretskaia, I. A., Osterman, G. B., and Shephard, M. W.: Comparisons of Tropospheric Emission Spectrometer (TES) ozone profiles to ozonesondes: Methods and initial results, J. Geophys. Res., 112, D03309, doi:10.1029/2006JD007258, 2007.
Worden, H. M., Bowman, K. W., Eldering, A., and Beer, R.: Satellite measurements
25
of the clear-sky greenhouse effect from tropospheric ozone, Nat. Geosci., 1, 305–308, doi:10.1038/ngeo182, 2008.
Xu, J., Zhu, Y., and Li, J.: Seasonal cycles of surface ozone and NOx in Shanghai, J. Appl. Meteorol., 36, 1424–1429, 1997.
Zbinden, R. M., Cammas, J.-P., Thouret, V., N ´ed ´elec, P., Karcher, F., and Simon, P.:
Mid-30
latitude tropospheric ozone columns from the MOZAIC program: climatology and interannual variability, Atmos. Chem. Phys., 6, 1053–1073, 2006,
ACPD
9, 23103–23140, 2009IASI measurements of tropospheric ozone over Chinese
megacities
G. Dufour et al.
Title Page
Abstract Introduction
Conclusions References
Tables Figures
◭ ◮
◭ ◮
Back Close
Full Screen / Esc
Printer-friendly Version
Interactive Discussion 16
18 20 22 24 26 28 30 32 34 36 38 40 42 44 46
110 111 112 113 114 115 116 117 118 119 120 121 122 123 124 125 126 127 128 129 130 Beijing
Shanghai
Hong Kong
Longitude
Latitude
0 50 100 150 200 250 300 350 400 450 500 550 600 650 700 750 800 850 900 950 1000
Fig. 1. Regions of 5◦
×5◦ in latitude and longitude around Beijing, Shanghai and Hong Kong
ACPD
9, 23103–23140, 2009IASI measurements of tropospheric ozone over Chinese
megacities
G. Dufour et al.
Title Page
Abstract Introduction
Conclusions References
Tables Figures
◭ ◮
◭ ◮
Back Close
Full Screen / Esc
Printer-friendly Version
Interactive Discussion
Fig. 2. Example of tropospheric averaging kernels derived from IASI observations above
ACPD
9, 23103–23140, 2009IASI measurements of tropospheric ozone over Chinese
megacities
G. Dufour et al.
Title Page
Abstract Introduction
Conclusions References
Tables Figures
◭ ◮
◭ ◮
Back Close
Full Screen / Esc
Printer-friendly Version
Interactive Discussion
Fig. 3. Percentage of cloud free and ozone quality flagged IASI pixels per month for the 3
ACPD
9, 23103–23140, 2009IASI measurements of tropospheric ozone over Chinese
megacities
G. Dufour et al.
Title Page
Abstract Introduction
Conclusions References
Tables Figures
◭ ◮
◭ ◮
Back Close
Full Screen / Esc
Printer-friendly Version
Interactive Discussion
Fig. 4. Monthly variations of the mean 0–6 km ozone columns measured with IASI in 2008
ACPD
9, 23103–23140, 2009IASI measurements of tropospheric ozone over Chinese
megacities
G. Dufour et al.
Title Page Abstract Introduction Conclusions References Tables Figures ◭ ◮ ◭ ◮ Back Close
Full Screen / Esc
Printer-friendly Version Interactive Discussion (a) 0 1 2 3 4 5 6 7 8 9 10 11
1 2 3 4 5 6 7 8 9 10 11 12
month
altitude
Beijing
30 40 50 60 70 80 90 100 110 120 130 140 150 160 170 180 ppbv (b) 0 1 2 3 4 5 6 7 8 9 10 11 12
1 2 3 4 5 6 7 8 9 10 11 12
month
altitude
Shanghai
10 15 20 25 30 35 40 45 50 55 60 65 70 75 80 85 90 95 100105110115120125130135140145150 ppbv (c) 0 1 2 3 4 5 6 7 8 9 10 11 12 13 14
1 2 3 4 5 6 7 8 9 10 11 12
month
altitude
Hong Kong
101622283440465258647076828894 100 106 112 118 124 130 136 142 148 ppbv
Fig. 5.Monthly mean ozone profiles retrieved from IASI in 2008 over Beijing(a), Shanghai(b),
ACPD
9, 23103–23140, 2009IASI measurements of tropospheric ozone over Chinese
megacities
G. Dufour et al.
Title Page
Abstract Introduction
Conclusions References
Tables Figures
◭ ◮
◭ ◮
Back Close
Full Screen / Esc
Printer-friendly Version
Interactive Discussion
Fig. 6. Monthly mean variations of ozone volume mixing ratio (vmr) retrieved at 3 (red) and 8
ACPD
9, 23103–23140, 2009IASI measurements of tropospheric ozone over Chinese
megacities
G. Dufour et al.
Title Page
Abstract Introduction
Conclusions References
Tables Figures
◭ ◮
◭ ◮
Back Close
Full Screen / Esc
Printer-friendly Version
Interactive Discussion 38
40
42 IASI−O3 JAN08 FEB08 MAR08 APR08
38 40
42 MAY08 JUN08 JUL08 AUG08
38 40 42
114 115 116 117 118 119 SEP08
114 115 116 117 118 119 OCT08
114 115 116 117 118 119 NOV08
114 115 116 117 118 119 DEC08
10 12 14 16 18 20 22 24 26 28 30 32 34 36 38 DU
Fig. 7. Monthly mean 0–6 km ozone columns from IASI spatially averaged on a
0.25◦
×0.25◦latitude-longitude grid for 2008 in the Beijing region (given in Dobson Unit, DU).
ACPD
9, 23103–23140, 2009IASI measurements of tropospheric ozone over Chinese
megacities
G. Dufour et al.
Title Page
Abstract Introduction
Conclusions References
Tables Figures
◭ ◮
◭ ◮
Back Close
Full Screen / Esc
Printer-friendly Version
Interactive Discussion
Fig. 8. Monthly mean variations of ozone vmr retrieved at 3 (red) and 10 km (black) from IASI
ACPD
9, 23103–23140, 2009IASI measurements of tropospheric ozone over Chinese
megacities
G. Dufour et al.
Title Page
Abstract Introduction
Conclusions References
Tables Figures
◭ ◮
◭ ◮
Back Close
Full Screen / Esc
Printer-friendly Version
Interactive Discussion 28
30 32
IASI−O3 JAN08 FEB08 MAR08 APR08
28 30 32
MAY08 JUN08 JUL08 AUG08
28 30 32
118 119 120 121 122 123 SEP08
118 119 120 121 122 123 OCT08
118 119 120 121 122 123 NOV08
118 119 120 121 122 123 DEC08
6 8 10 12 14 16 18 20 22 24 26 28 30 32 34 DU
ACPD
9, 23103–23140, 2009IASI measurements of tropospheric ozone over Chinese
megacities
G. Dufour et al.
Title Page
Abstract Introduction
Conclusions References
Tables Figures
◭ ◮
◭ ◮
Back Close
Full Screen / Esc
Printer-friendly Version
Interactive Discussion
Fig. 10.Monthly mean variations of ozone vmr retrieved at 3 (red) and 12 km (black) from IASI
ACPD
9, 23103–23140, 2009IASI measurements of tropospheric ozone over Chinese
megacities
G. Dufour et al.
Title Page
Abstract Introduction
Conclusions References
Tables Figures
◭ ◮
◭ ◮
Back Close
Full Screen / Esc
Printer-friendly Version
Interactive Discussion 22
24
IASI−O3 JAN08 FEB08 MAR08 APR08
22 24
MAY08 JUN08 JUL08 AUG08
22 24
112 113 114 115 116 SEP08
112 113 114 115 116 OCT08
112 113 114 115 116 NOV08
112 113 114 115 116 DEC08
6 7 8 9 10 11 12 13 14 15 16 17 18 19 20 21 22 23 24 25 26 27 DU
ACPD
9, 23103–23140, 2009IASI measurements of tropospheric ozone over Chinese
megacities
G. Dufour et al.
Title Page Abstract Introduction Conclusions References Tables Figures ◭ ◮ ◭ ◮ Back Close
Full Screen / Esc
Printer-friendly Version Interactive Discussion 8 10 12 14 16 18 20 22 24 26 28 30 32 34
2 4 6 8 10 12 14 16 18 20 22 24 26 28 30
8 10 12 14 16 18 20 22 24 26 28 30 32 34
2 4 6 8 10 12 14 16 18 20 22 24 26 28 30
Mean daily 0−6km O3 columns (DU)
Day of February
38 40 42
114 116 118 07FEB
Beijing
114 116 118 08FEB
Beijing
114 116 118 09FEB
Beijing
114 116 118 10FEB
Beijing
10 12 14 16 18 20 22 24 26 28 30 32 34 36 38 DU
Fig. 12.Mean daily 0–6 km ozone columns (morning pass) retrieved from IASI over the Beijing
ACPD
9, 23103–23140, 2009IASI measurements of tropospheric ozone over Chinese
megacities
G. Dufour et al.
Title Page
Abstract Introduction
Conclusions References
Tables Figures
◭ ◮
◭ ◮
Back Close
Full Screen / Esc
Printer-friendly Version
Interactive Discussion
16 18 20 22 24 26 28 30 32 34 36 38 40 42
2 4 6 8 10 12 14 16 18 20 22 24 26 28 30
16 18 20 22 24 26 28 30 32 34 36 38 40 42
2 4 6 8 10 12 14 16 18 20 22 24 26 28 30
Mean daily 0−6km O3 columns (DU)
Day of April
38 40 42
114 116 118 15APR
Beijing
114 116 118 16APR
Beijing
114 116 118 17APR
Beijing
114 116 118 18APR
Beijing
10 12 14 16 18 20 22 24 26 28 30 32 34 36 38 DU
ACPD
9, 23103–23140, 2009IASI measurements of tropospheric ozone over Chinese
megacities
G. Dufour et al.
Title Page
Abstract Introduction
Conclusions References
Tables Figures
◭ ◮
◭ ◮
Back Close
Full Screen / Esc
Printer-friendly Version
Interactive Discussion
Fig. 14. Mean daily ozone profiles retrieved from IASI for the two selected periods with
ACPD
9, 23103–23140, 2009IASI measurements of tropospheric ozone over Chinese
megacities
G. Dufour et al.
Title Page
Abstract Introduction
Conclusions References
Tables Figures
◭ ◮
◭ ◮
Back Close
Full Screen / Esc
Printer-friendly Version
Interactive Discussion
8 10 12 14 16 18 20 22 24 26 28 30 32 34
2 4 6 8 10 12 14 16 18 20 22 24 26 28 30
8 10 12 14 16 18 20 22 24 26 28 30 32 34
2 4 6 8 10 12 14 16 18 20 22 24 26 28 30
Mean daily 0−6km O3 columns (DU)
Day of June
28 30 32
118 120 122 03JUN
Shanghai
118 120 122 04JUN
Shanghai
118 120 122 05JUN
Shanghai
118 120 122 06JUN
Shanghai
10 12 14 16 18 20 22 24 26 28 30 32 34 36 38 DU