www.jped.com.br
ORIGINAL
ARTICLE
Reliability
and
validity
of
the
Brazilian
version
of
the
Pittsburgh
Sleep
Quality
Index
in
adolescents
夽
Muana
H.P.
Passos
a,∗,
Hítalo
A.
Silva
a,
Ana
C.R.
Pitangui
a,b,
Valéria
M.A.
Oliveira
a,
Alaine
S.
Lima
a,
Rodrigo
C.
Araújo
a,b,caUniversidadedePernambuco(UPE),ProgramadeMestradoemHebiatria,Recife,PE,Brazil bUniversidadedePernambuco(UPE),DepartamentodeFisioterapia,Petrolina,PE,Brazil
cUniversidadedePernambuco(UPE)/UniversidadeFederaldaParaíba(UFPB),ProgramaAssociadodePós-graduac¸ãoemEducac¸ão
Física,Recife,PE,Brazil
Received22March2016;accepted13June2016 Availableonline9August2016
KEYWORDS
Factoranalysis; Sleepdisorders; Adolescents; Reproducibilityof results
Abstract
Objective: Toevaluatethe reliabilityandvalidity oftheBrazilian versionofthePittsburgh SleepQualityIndex.
Methods: 309 adolescents, subdivided into a sample of 209 subjects, of whom 25 were reassessed,andanothersampleof100adolescents.ReliabilitywasassessedusingCronbach’s
˛-values, intraclasscorrelationcoefficient,StandardError ofMeasure,Minimum Detectable Change,andBland---Altmanplotting.Exploratoryanalysisofthequestionnairecomponentswas performedbasedonthesampleof209adolescents.Confirmatoryfactoranalysiswasperformed withasampleof100individuals.
Results: Thesampleof209participantshadameanageof14.38(±1.94)years,comprising 80(38.3%)girlsand129(61.7%)boys.Thesampleof100adolescentshadameanageof13.66 (±2.35)years,comprising51(51%)girlsand49(49%)boys.Thequestionnaireobtaineda Stan-dardErrorofMeasure=1.12andMinimumDetectableChange=3.10.Cronbach’s˛was0.71and theIntraclassCorrelationCoefficientwas0.65(95%CI:0.21---0.85).Thefactoranalysisshowed thatthebestmodelofcomponentswastheonethatconsistedoftwofactors,excludingthe componentontheuseofsleepmedications.
Conclusion: Thequestionnaireshowedhighinternalconsistencyandmoderatereliability. Fur-thermore,amodelwithtwofactorsseemstobethemostappropriatetoevaluatethequality ofsleepinadolescents.
©2016SociedadeBrasileiradePediatria.PublishedbyElsevierEditoraLtda.Thisisanopen accessarticleundertheCCBY-NC-NDlicense(http://creativecommons.org/licenses/by-nc-nd/
4.0/).
夽
Pleasecitethisarticleas:PassosMH,SilvaHA,PitanguiAC,OliveiraVM,LimaAS,AraújoRC.ReliabilityandvalidityoftheBrazilian versionofthePittsburghSleepQualityIndexinadolescents.JPediatr(RioJ).2017;93:200---6.
∗Correspondingauthor.
E-mail:[email protected](M.H.Passos). http://dx.doi.org/10.1016/j.jped.2016.06.006
PALAVRAS-CHAVE
Análisefatorial; Transtornosdosono; Adolescentes; Reprodutibilidadedos resultados
ConfiabilidadeevalidadedaversãobrasileiradoÍndicedeQualidadedoSono
dePittsburghemadolescentes
Resumo
Objetivo: Avaliaraconfiabilidadeevalidadedaversãobrasileira doÍndicedeQualidadedo SonodePittsburgh.
Métodos: 309adolescentes,subdivididosemumaamostrade209indivíduos,dosquais25foram reavaliados,eoutraamostrade100adolescentes.Aconfiabilidadefoiavaliadapormeiodos valoresde␣deCronbach,CoeficientedeCorrelac¸ãoIntraclasse,ErroPadrãodaMedida,Mínima
Mudanc¸aDetectáveleplotadográficoBland-Altman.Aanáliseexploratóriadoscomponentes do questionáriofoi realizada combase naamostra de209 adolescentes. A análisefatorial confirmatóriafoirealizadacomaamostrade100indivíduos.
Resultados: Aamostrade209participantesteveumamédiadeidadede14,38(±1,94)anos, sendo80(38,3%)meninase129(61,7%)meninos.Aamostracompostapor100adolescentes, teveumamédiadeidadede13,66(±2,35)anos,sendo51(51%)meninase49(49%)meninos. OquestionárioobteveErropadrãodaMedida=1,12eMudanc¸amínimadetectável=3,10.O␣
deCronbachfoide0,71eCoeficientedeCorrelac¸ãoIntraclassede0,65(IC95%0,21-0,85).As análisesfatoriaisapontaramcomomelhormodelodecomponentesaquelecompostopordois fatores,comexclusãodocomponentesobreusodemedicamentosparadormir.
Conclusão: O questionárioobteve elevada consistência interna e confiabilidade moderada. Alémdisso,ummodelodedoisfatorespareceseromaisadequadoparaavaliaraqualidadedo sonoemadolescentes.
©2016SociedadeBrasileiradePediatria.PublicadoporElsevierEditoraLtda.Este ´eumartigo OpenAccesssobumalicenc¸aCCBY-NC-ND(http://creativecommons.org/licenses/by-nc-nd/4.
0/).
Introduction
Sleepisafundamentalbiologicalprocess,especiallyinthe adolescentpopulation,asgrowthhormone,whichis essen-tial for theindividual’s physical development, issecreted duringsleep.1Inadequatesleepcan causedamageto
psy-chosocialhealthandacademicperformance,andcanresult
inriskbehaviordevelopment.2
Manytoolscanbeusedtoassessthepresenceofsleep
dis-orders,includingquestionnairesthatcanbeusedinclinical
practiceandepidemiologicalstudies.3InBrazil,sometools
thatevaluatesleephabitshavebeenvalidated,suchasthe
Children’s SleepHabits Questionnaire(CSHQ), which aims
toassesssleepproblemsinindividuals,butisrestrictedto
children.4TheMorning/EveningScalewasvalidatedfor
ado-lescents,whichislimitedtoassessingwake-upandbedtime
hoursinadolescents,callingthemmorningandevening.5
The Pittsburgh Sleep Quality Index (PSQI) is a
self-administered tool used to evaluate sleep quality and
possibledisordersinthepreviousmonth.Itwasdeveloped
byBuysseetal.in1989andvalidatedinBrazil,intheadult
population, byBertolazi etal.in 2011. Thequestionnaire
hasbeenwidelyusedindifferentpopulations,havingbeen
translatedintoandvalidatedfordifferentlanguages.6---10
In 2006, when assessing the structure of the PSQI in
healthyadultsandthosewithdepression,Coleetal.
ques-tioned the capacity of the single PSQI score to measure
themultidimensionalnatureofsleepdisorders.11After
fac-torial analyses of the components, the authors suggested
that a three-factor score model would more appropriate
toassesssleepcharacteristics.Otherstudiesalsoprovided
evidencethatamodelwithonemorefactorwouldbemore
appropriate to evaluate sleep characteristics in specific
populations.12---15 However,thestudypopulation
character-isticscanmodifythestructureofthequestionnairefactors.
TheBrazilianversionofthistoolwasvalidatedinanadult
population;however,thereisalackofstudiesassessingthe
reliabilityofthistoolinadolescentpopulations.Giventhis
factand theneed toassess the factorial structureof the
questionnaireindifferentpopulations,thisstudyhadadual
purpose:assessingthereliabilityofthissleepquality
assess-menttoolandperformingthefactorialanalysisofthePSQI
componentsinadolescents.
Methods
Participants
The study population consisted of male and female ado-lescents,agedbetween 10 and 19 years,whoengaged in amateursportspractice,fromthecityofPetrolina,stateof Pernambuco,Brazil, in2014. Afterperformingasurveyin schoolsandsportscenters,apopulationof521young ama-teurathleteswasidentified.Asthestudyperformed three different analyses, it was necessary to perform different samplingprocedures,asdescribedbelow.
minimumsampleof200adolescents.However,this
subsam-plewasconstitutedby209adolescents.
Toquantifythenecessarysampletocarryoutthesecond
stage,whichincludedtheanalysisoftheinterday
reliabil-ity (test---retest) of the questionnaire, the GPower 3.1.7
program was used, considering an ˛=0.05; ˇ=0.10 (90%
power), proportion of correlation for the null hypothesis
(H0)=0.40, and proportion of correlation for the
alter-native hypothesis (H1 )=0.80, resulting in a minimum
necessary sample size of 25 adolescents. These subjects
were recruited at random from the initial sample of 209
adolescents.
In the third stage, to perform the confirmatory factor
analysis,thestudyevaluated100adolescents,whobelonged
toan independentsample, accordingtothe
recommenda-tionsfromguidelinesonfactoranalysis.17
Therefore,309adolescentsparticipatedinthestudy,and
all participants who had the Free and Informed Consent
formsignedbythe parents/guardiansor signedby
partic-ipantsover 18 yearsof age were included. The exclusion
criterionwasconsideredasinadequatequestionnaire
com-pletion. The study was approved by the Research Ethics
CommitteeofUniversidadedePernambuco.
Tool
ThetoolusedinthestudywastheBrazilianversionofthe PittsburgSleepQualityIndex(PSQI),whichwastranslated andvalidatedbyBertolazi etal.in2011.It isnoteworthy thatnoadjustmentwasmadeinthe originaltooltocarry outthisstudy.ThequestionnairewasdevelopedbyBuysse etal.in1989,with19questionsregardingsleepqualityand disordersintheprevious month. The questionnaire evalu-atesseven sleepcomponents:subjective qualityof sleep, sleeplatency,sleepduration,sleepefficiency,sleep disor-ders,medication use,anddaytimedysfunction.Thescore canrangefrom0to3foreachcomponent,withamaximum totalscoreof21points.Scoresabove5pointsindicatepoor qualityofsleep.
Statisticalanalysis
Themeanandstandarddeviationvalueswerecalculatedfor numericalvariables.Cronbach’s˛-valuewascalculatedfor theanalysisofinternalconsistency,withvaluesabove0.70 indicatinghighinternalconsistency.18Thestandarderrorof
measure(SEM)andtheminimumdetectablechange (MDC)
werealsocalculated.Thet-testforsinglesampleswas
per-formed toevaluate the possible presence of a significant
differencebetween thescores inthetest andretest,and
aBland---Altmanplotwasconstructedfortheassessmentof
absoluteagreementbetweentest andretest.Thismethod
allowsthe visualization of the bias, the error, aswell as
outliersandtrends.19
ThevalidityofPSQIcomponentswasperformedthrough
afactor analysiswithavarimaxorthogonalrotation,with
thesampleof209adolescents.Inthisanalysis,values>0.30
were considered as showing a strong factor loading.18 To
assess the relative agreement between the test---retest
of the total questionnaire scores and the scores of the
factors formed in the exploratory factor analysis, the
intraclasscorrelation coefficient(ICC)wascalculatedwith
a 95% confidence interval(95% CI).This analysis canvary
between0and1,withvaluesbetween0and0.4indicating
poorreliability,0.4---0.75moderate,and0.75---1,excellent
reliability.20
Aconfirmatoryfactoranalysiswasalsoperformedwith
asampleof100individuals,basedonthemodelsobtained
fromtheexploratoryfactor analysis.Theadequacy ofthe
model was assessed based on the following adjustment
criteria: standardized root mean square residual (SRMR)
withvaluesequalor less than0.08,comparative fitindex
(CFI)withvaluesabove 0.95,androot meansquare error
of approximation (RMSEA) with values between 0.05 and
0.08.21,22
The analyses were performed using the statistical
packageSPSS(IBMCorp.Released2011.IBMSPSSStatistics
forWindows,version20.0,USA),GraphPadPrism(GraphPad
Prismversion5.05forWindows,GraphPadSoftware,USA),
andSPSSAmos(Amos,version23.0,ComputerProgram:IBM
SPSS,USA).
Results
Of thetotal sampleof 309 adolescents,131(42.4%) were females and 178(57.6%) weremales. A subsampleof 209 participantshadameanageof 14.38(±1.94)years, com-prising80 (38.3%)girlsand129 (61.7%)boys,whereasthe sampleof100adolescentshadameanageof13.66(±2.35) years,with51(51%)girlsand49(49%)boys.
Exploratoryfactoranalysis
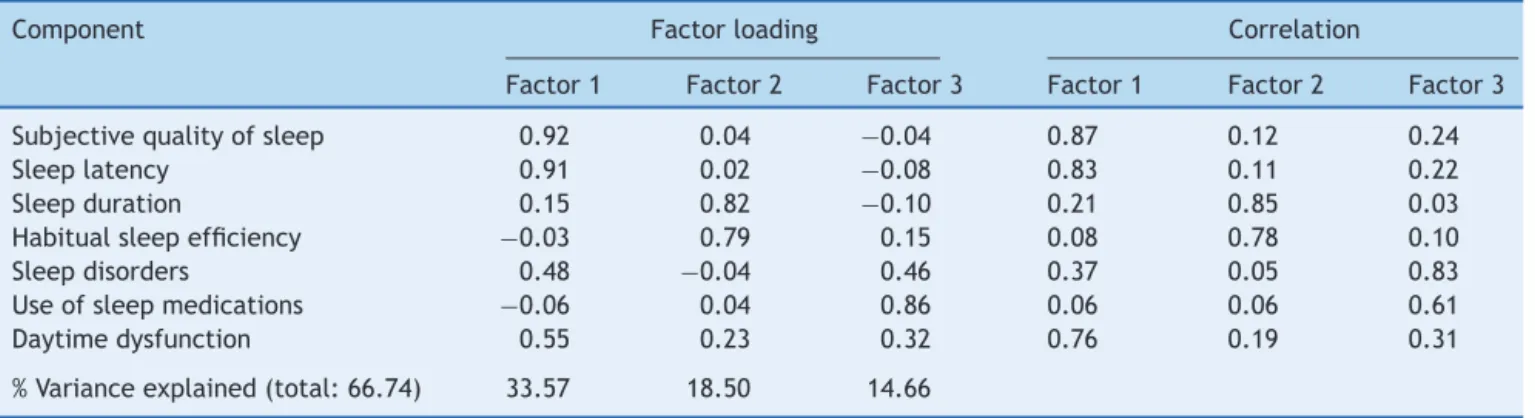
Three models of components were identified in the exploratoryfactoranalysisofthePSQIcarriedoutwiththe sampleof209adolescents.Themodelcomprisingthree fac-tors accounted for 66.57%of thetotal varianceexplained (Table 1). In this model, the components of sleep
dis-orders and daytime dysfunction were the first and third
factors.
Thus, the exploratory factor analysis of a two-factor
model was performed, showing a variance explained of
52.07% (Table2). However,the componentrelated tothe
sleepmedicationuseobtainedpoorfactorloadingandlow
correlation in relation tothe scores of factors, andthus,
it wasnot allocatedinany factor.Therefore,theanalysis
ofa modelconsistingoftwofactorswasperformed, after
excludingthecomponentonmedicationuse,showinga
vari-anceexplainedof60.41%(Table2).
TheadequacymeasurevalueoftheKaiser---Meyer---Olkin
samplewas0.59,indicatingmoderateadequacyofthethree
assessedmodels.Bartlett’ssphericitytest---chi-squaredhad
anapproximate2=382.992(p=0.000),demonstrating
ade-quateexploratoryfactoranalysisforallmodels.
Reliability
Table1 Three-factorcomponentmatrixandcorrelationmatrixofcomponentswiththePSQIfactors(n=209).
Component Factorloading Correlation
Factor1 Factor2 Factor3 Factor1 Factor2 Factor3
Subjectivequalityofsleep 0.92 0.04 −0.04 0.87 0.12 0.24
Sleeplatency 0.91 0.02 −0.08 0.83 0.11 0.22
Sleepduration 0.15 0.82 −0.10 0.21 0.85 0.03
Habitualsleepefficiency −0.03 0.79 0.15 0.08 0.78 0.10
Sleepdisorders 0.48 −0.04 0.46 0.37 0.05 0.83
Useofsleepmedications −0.06 0.04 0.86 0.06 0.06 0.61
Daytimedysfunction 0.55 0.23 0.32 0.76 0.19 0.31
%Varianceexplained(total:66.74) 33.57 18.50 14.66
Table2 Componentmatrixandcorrelationcomponentmatrixofthetwo-factormodelandtwo-factormodelafterexcluding thecomponentonsleepmedicationuseofPSQI(n=209).
Component Two-factormodel Two-factormodelafterexcludingcomponent6
Factorloading Correlation Factorloading Correlation
Factor1 Factor2 Factor1 Factor2 Factor1 Factor2 Factor1 Factor2
Subjectivequalityofsleep 0.91 0.01 0.83 0.13 0.91 0.01 0.83 0.12
Sleeplatency 0.89 −0.02 0.79 0.11 0.89 −0.02 0.79 0.11
Sleepduration 0.13 0.76 0.19 0.81 0.13 0.79 0.19 0.85
Habitualsleepefficiency −0.01 0.81 0.09 0.76 −0.01 0.81 0.09 0.78
Sleepdisorders 0.53 0.07 0.60 0.07 0.53 0.04 0.60 0.05
Useofsleepmedications 0.04 0.26 0.07 0.32 --- --- ---
---Daytimedysfunction 0.59 0.29 0.75 0.20 0.59 0.27 0.75 0.20
%Varianceexplained 33.56 18.51 Total=52.07 39.05 21.36 Total=60.41
Afterexcludingthescoreofthecomponentrelatedtosleep medicationuse,therewasanincreaseinthetool’sinternal consistencyvalue,withCronbach’s˛of0.73.
There was a statistical difference between the PSQI scoresinthetestandretest(p<0.001),indicatingthe pres-ence of systematic error, confirmed by the Bland---Altman plot.19 Fig.1shows theanalysisof absoluteagreementat
thetestandretestbetweenthemeansofthetotalscore,
withallcomponentsandafterexcludingthecomponenton
sleepmedicationuse.
Based on the composition of factors, test---retest
reli-ability between the scores of the different models was
calculated.Forthethree-factormodel,theICCvalueswere
0.59(95%CI:0.09---0.82),0.71(95%CI:0.35---0.87),and0.81
(95%CI:0.56---0.91)for thefirst,second,andthird factor,
respectively.Forthemodelconsistingoftwofactors,theICC
was0.67(95%CI:0.26---0.86)and0.64(95%CI:0.19---0.84).
Themodelconsistingoftwofactors,aftertheexclusionof
thecomponentonsleepmedicationuse,obtainedanICCof
0.67(95%CI:0.26---0.86)and0.71(95%CI:0.35---0.87).
6
A
4
2
0
–2
–4
–6
0 2 4 6 8 10
+ 1.96SD
Bias (0.92)
– 1.96SD
+ 1.96SD
Bias (0.84)
– 1.96SD
Mean PSQI score
0 2 4 6 8 10
Mean PSQI score
Diff
erence in scores betw
een
the 1
st and the 2
nd
e
valuations
6
B
4
2
0
–2
–4
–6
Diff
erence in scores betw
een
the 1
st and the 2
nd
e
valuations
0.17
0.22 0.93
0.97
1.19
0.16
0.26
0.31
Factor 1
Subjective quality of sleep
Sleep latency
Sleep duration
Habitual sleep efficiency
Sleep disorders
Daytime dysfunction
e1
e2
e3
e4
e5
e6 Factor 2
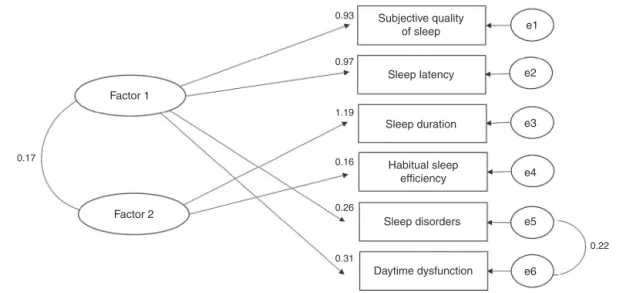
Figure2 BestmodelresultingfromtheconfirmatoryfactoranalysisofthePSQI,consistingoftwofactorsafterexcludingthe componentonsleepmedicationuse.Theovalrepresentationsdenotethelatentvariables,whilethesquaresrepresentthe mea-suredvariables.Thevaluesclosetothosecomponentsrepresentthefactorloadings.Theremainingvaluesrepresenttheexisting correlations.
Confirmatoryfactoranalysis
Based on the exploratory factor analysis, the confirma-tory factor analysis of the two- and three-factor models wasperformed.Allmodelsobtainedfromadjustments val-ues considered adequate. The first model, consisting of threefactors,obtainedvaluesofSRMR=0.07,RMSEA=0.08, andCFI=0.95.The secondmodelconsistingoftwofactors obtainedvaluesofSRMR=0.07,RMSEA=0.06,andCFI=0.97. Thethirdmodel,alsoconsistingoftwofactors,but exclud-ingthecomponentonsleepmedicationuse,obtainedvalues ofSRMR=0.06,RMSEA=0.06,andCFI=0.97(Fig.2).
Discussion
ThePSQIhasbeen widelyusedinstudies; however,ithas beenquestioned whetherthe indextotalscore iscapable ofevaluatingthemultidimensionalcharacteristicsofsleep, making it necessary to perform the analysis of the tool’s factorstructure.Inthisstudy,theexploratoryfactor anal-ysisyieldedafirstmodelconsistingofthreefactorswitha highpercentageofexplainedvariance;however,the com-ponentsof sleep disorders and daytime dysfunctionwere thefirstandthirdfactors.Therefore,itwasdecidedto per-formtheanalysisofasecondmodelwithtwofactors,which showedadecreaseinthepercentageofexplainedvariance andlowfactorloadingofthecomponentonmedicationuse, indicatingthisisnotausefulrepresentativefactorinmodel construction.17
Consideringthisresult,athirdmodelwasbuiltwithtwo
factors after excluding this component, with an increase
inthepercentageofexplainedvariancebeingobservedin
relationtothesecond model,aswellasan adequate
dis-tribution of all components. Therefore, the third model
showedbetterstructureintheexploratoryfactoranalysis,
beingformedbyafirstfactorconsistingofthecomponents:
subjectivesleepquality,sleeplatency,sleepdisorders,and
daytimedysfunction;andasecondfactorconsistingofsleep
durationandhabitualsleepefficiency.
Subsequently,theconfirmatoryfactor analysiswas
per-formed with the three proposed models. The results of
this analysis indicate acceptable adjustments values for
allmodels.However,consideringthemoreconsistent
con-struction in the exploratory factor analysis and adequate
adjustment values in the confirmatory factor analysis,
the model consisting of two factors after the
exclu-sion of the component on sleep medication use appears
to be more adequate to assess the quality of sleep in
adolescents.
Thenegativeresultsrelatedtothecomponentonsleep
medicationusecanbeexplainedbythelowprevalenceof
medication use,which wasonly3.6%. Astudy carriedout
with young adults also found a low prevalence of
med-ication use, of 3.9%, showing the low factor loading of
thiscomponent.12 Theauthorsthenanalyzedmodelsafter
thiscomponenthadbeenremoved,buttherewasnogreat
impactonthe adjusted values.However,it is noteworthy
thattheuseofsleepmedicationislowinyoungand
middle-agedadults,withanincreaseinolderadultsorindividuals
withspecific diseases.23 On the other hand, in a study of
youngindividuals,theauthorsreportedthatthecomponent
onsleepmedicationusecontributednegativelytothetool’s
internalconsistency.24 Similarly,inthisstudy,therewasan
increaseintheinternalconsistencyofthePSQI,whichwas
initially0.71,to0.73afterexcludingthecomponenton
med-icationuse.Therefore,itisspeculatedthattheassessment
onsleepmedicationusecannotbeasignificantmeasureof
sleep quality in younger individuals, especially in
adoles-cents.
Different studies have shown that the PSQI
construc-tionwithmultiplefactorsappearstobemoreadequatefor
the assessment of different sleep characteristics in adult
populations.10,25 As for individuals with specific diseases,
there is disagreement regarding the best questionnaire
those with chronic fatigue syndrome, the PSQI factor
analysis showed that a model consisting of three factors
wouldbemoreadequatetoevaluatesleep13,15;whereasin
patientswithbreastcancer,theoriginalmodel ofasingle
scoreshowed tobevalid andcapable of evaluatingsleep
disorders.14
Inthissense,differencescanbeobservedregardingthe
proposalofthemostadequatetoolstructure,whichvaries
accordingtothesubject’sageandspecificdiseases.
There-fore,thequestionnairestructureshouldnotbegeneralized
toevaluatethequalityofsleepindifferentpopulations,as
thefactorialanalysisofcomponentsisrequired.
Another importantaspect tobeassessed is tool
repro-ducibility,consideringthepossibilityofusingitindifferent
moments,aswellastoreviewthespecifictreatmenteffect.
ThepresentfindingsindicateamoderatereliabilityofPSQI
foradolescents,withanICCof0.65.However,studiesthat
proposedtoevaluatethetooltest-retestreliabilityinadult
populationsobtainedhighreliability,withPearson’s
correla-tioncoefficientvaluesof0.83and0.87.6,26Thisdivergence
of resultscanbe explainedbythedifferencein
measure-mentofreliabilityused,asPearson’scorrelationcoefficient
is notconsidered an appropriatemeasure,as itevaluates
the association between methods and not the agreement
betweenthem.19
Therefore, itis necessary toanalyzethequestionnaire
reliabilityusing acombination ofmeasures to evaluateit
both relatively and absolutely. In this sense, the analysis
of the Bland---Altman plot of the total score was
per-formed withallquestionnaire components, aswell asthe
score after excluding the component on sleep
medica-tion. The presence of an outlier in both plots and the
concentration ofthe majority of the pointsabovezero is
noteworthy.Thisresult,togetherwiththepresenceof
sig-nificant differences between the means of questionnaire
scores, indicates thepresence of systematic error. In this
context,itisimportanttoknowthetoolvariationin
abso-lutetermsand,subsequently,theSEMandMDCvaluesare
calculated.
TheSEMandMDCvaluesofthequestionnairewere1.12
and 3.10 points,respectively. It is noteworthy that there
arenostudies thatassessedthesemeasuresinadolescent
populations.Thus,knowledgeof thevariabilityassociated
to the repeatedapplication and the minimum amount of
change thatdoes noresultfromanerror in measurement
isessential todeterminetheminimumvalue indicativeof
changeinthequalityofsleep,afterapossibleintervention
inthispopulation.
Finally,theBrazilianversionofPSQIshowedhigh
inter-nalconsistencyandmoderatereliabilityinadolescents.The
originalversionofthetoolwasvalidforevaluationofsleep
disordersinadolescents;however,themodelconsistingof
twofactors,afterexcluding thecomponent ontheuseof
sleepmedications,showedoptimaladjustmentvaluesand
appears to be the most adequate to assess the different
characteristicsofsleepinthispopulation.
Funding
Higher Education Personnel Improvement Coordination (Capes).
Conflicts
of
interest
Theauthorsdeclarenoconflictsofinterest.
References
1.Rockett JC, Lynch CD, Buck GM. Biomarkers for assessing reproductivedevelopmentandhealth:Part1---pubertal devel-opment.EnvironHealthPerspect.2004;112:105---12.
2.Shochat T, Cohen-Zion M, Tzischinsky O. Functional conse-quences of inadequate sleep in adolescents: a systematic review.SleepMedRev.2014;18:75---87.
3.TogeiroSM,SmithAK.Métodosdiagnósticos nosdistúrbiosdo sono.RevBrasPsiquiatr.2005;27:S8---15.
4.Silva FG, Silva CR, Bragac LB, Neto AS. Portuguese chil-dren’s sleep habits questionnaire --- validation. J Pediatr. 2014;90:78---84.
5.FinimundiM,BarinI,BandeiraD,SouzaDO.Validityofa circa-dianrhythmscale---sleep/wakecycleforadolescents.RevPort Pediatr.2016;30:409---14.
6.Buysse DJ, Reynolds CF, Monk TH, Berman SR, Kupfer DJ. The Pittsburgh Sleep Quality Index: a new instrument for psychiatric practice and research. Psychiatry Res. 1989;28: 193---213.
7.Bertolazi AN, Fagondes SC, Hoff LS, Dartora EG, da Silva MiozzoIC,deBarbaME,etal.ValidationoftheBrazilian Por-tugueseversion of thePittsburgh SleepQuality Index. Sleep Med.2011;12:70---5.
8.Escobar-Córdoba F, Eslava-Schmalbach J. Colombian vali-dation of the Pittsburgh Sleep Quality Index. Rev Neurol. 2005;40:150---5.
9.Shochat T, Tzischinsky O, Oksenberg A, Peled R. Validation of the Pittsburgh Sleep Quality Index Hebrew translation (PSQI-H) in a sleep clinic sample. Isr Med Assoc J. 2007;9: 853---6.
10.Chong AM, Cheung CK. Factor structure of a Cantonese-version Pittsburgh Sleep Quality Index. Sleep Biol Rhythms. 2012;10:118---25.
11.ColeJC,MotivalaSJ,BuysseDJ,OxmanMN,LevinMJ,IrwinMR. Validationofa3-factorscoringmodelforthePittsburghsleep qualityindexinolderadults.Sleep.2006;29:112---6.
12.MageeCA,CaputiP,IversonDC,HuangX-FF.Aninvestigation ofthedimensionalityofthePittsburghSleepQualityIndexin Australianadults.SleepBiolRhythms.2008;6:222---7.
13.Burkhalter H, SereikaSM,Engberg S, Wirz-justice A, Steiger J, GeestSD.Structure validityofthePittsburgh Sleep Qual-ityIndexinrenaltransplantrecipients:aconfirmatoryfactor analysis.SleepBiolRhythms.2010;8:274---81.
14.HoRT,FongTC.FactorstructureoftheChineseversionofthe PittsburghSleepQualityIndexinbreastcancerpatients.Sleep Med.2014;15:565---9.
15.MarimanA,VogelaersD,HanoulleI,DelesieL,TobbackE, Pev-ernagieD.Validationofthethree-factormodelofthePSQIin alargesampleofchronicfatiguesyndrome(CFS)patients.J PsychosomRes.2012;72:111---3.
16.SmaldoneA,HonigJC,ByrneMW.SleeplessinAmerica: inad-equatesleepandrelationshipstohealthandwell-beingofour nation’schildren.Pediatrics.2007;119:S29.
17.Laros JA. O uso da análise fatorial: algumas diretrizes para pesquisadores. In: Pasquali L, editor. Análise fatorial para pesquisadores.Brasília,DF:LabPAM;2005.p.163---84. 18.FieldA.DescobrindoaestatisticausandooSPSS.2nded.Porto
Alegre,RS:Artmed;2009.
20.FleissJL.Thedesignandanalysisofclinicalexperiments.New York---Chichester---Brislane---Toronto---Singapore:Wiley;1986. 21.Hu L, Bentler PM. Cutoff criteria for fit indexes in
covari-ance structure analysis: conventional criteria versus new alternatives.StructEquModelAMultidiscipJ.1999;6:1---55. 22.Schumacker RE, LomaxRG. A beginner’s guide to structural
equation modeling. 3rd ed.New York, NY: Taylor & Francis Group;2010.
23.KaneitaY,UchiyamaM,TakemuraS,YokoyamaE.Useofalcohol andhypnoticmedicationasaidstosleepamongtheJapanese generalpopulation.SleepMed.2007;8:723---32.
24.Manzar MD, Moiz JA, Zannat W, Spence DW, Pandi-Perumal SR, BaHammam AS, et al. Validity of the Pittsburgh Sleep Quality Index in Indian university students. Oman Med J. 2015;30:193---202.
25.KohHW,LimRB,ChiaKS,LimWY.ThePittsburghSleepQuality Indexinamulti-ethnicAsianpopulationcontainsathree-factor structure.SleepBreath.2015;19:1147---54.