1Associate Pro f e s s o r, Biomedical Engineering Group (GENEBIO) - Electrical Department - Federal University of Minas Gerais (UFMG),
Belo Horizonte MG, Brazil; 2P ro f e s s o r, Biomedical Engineering Program - COPPE - Federal University of Rio de Janeiro (UFRJ), Rio
de Janeiro RJ, Brazil. Financial support by Brazilian Agencies CNPq, CAPES and FAPEMIG. Received 12 August 2005, received in final form 9 December 2005. Accepted 8 February 2006.
D r. Carlos Julio Ti e rra-Criollo - Electrical Department - Federal University of Minas Gerais (UFMG) - Av. Antônio Carlos 6627 - 31270-010 Belo Horizonte MG - Brasil. E-mail: [email protected]
LOW-FREQUENCY OSCILLATIONS IN HUMAN
TIBIAL SOMATOSENSORY EVOKED POTENTIALS
Carlos Julio Tierra-Criollo
1, Antonio Fernando Catelli Infantosi
2ABSTRACT - Oscillatory cerebral electric activity has been related to sensorial and perc e p t u a l - c o g n i t i v e functions. The aim of this work is to investigate low frequency oscillations (<300 Hz), particularly within the gamma band (30-110 Hz), during tibial stimulation. Twenty-one volunteers were subjected to 5 H z stimulation by current pulses of 0.2 ms duration and the minimum intensity to provoke involuntary twitch. EEG signals without (spontaneously) and during stimulation were re c o rded at primary somatosensory are a . A time-frequency analysis indicated the effect of the stimulus artifact in the somatosensory evoked poten-tial (SEP) frequencies up to 5 ms after the stimulus. The oscillations up to 100 Hz presented the highest relative power contribution (approximately 99%) for the SEP and showed diff e rence (p<0.01) from the f requencies of the spontaneously EEG average. More o v e r, the range 30-58 Hz was identified as the band with the highest contribution for the tibial SEP morphology (p<0.0001).
KEY WORDS: gamma oscillations, somatosensory evoked potential, tibial nerve, time-frequency analysis.
Oscilações de baixa freqüência no potencial evocado somato-sensitivo do nervo tibial humano
RESUMO - Oscilações da atividade elétrica cerebral têm sido associadas a funções sensoriais, de perc e p ç ã o e de cognição. O presente estudo objetiva investigar as oscilações de baixa freqüência, em particular da banda gama (30-110 Hz), durante estimulação do nervo tibial. Vinte e um voluntários foram estimulados com pulsos de corrente de 0,2 ms, freqüência de 5 Hz e intensidade mínima para produzir o movimento involuntário dos músculos intrínsecos do pé. Sinais EEG espontâneo e durante estimulação foram re g i s t r a-dos na área somato-sensitiva primária. A análise tempo-freqüência indicou o efeito do artefato ao estímu-lo na banda de freqüência do potencial evocado somato-sensitivo (PESS) até aproximadamente 5 ms pós-estímulo. As oscilações até 100 Hz apresentaram maior contribuição relativa de potência ao PESS (apro-ximadamente 99%) e se mostraram significativamente diferentes (p<0,01) das freqüências da média coe-rente do EEG espontâneo. Além disso, a banda 30-58 Hz foi identificada como a de maior contribuição à morfologia do PESS do nervo tibial (p<0,0001).
PA L AV R A S - C H AVE: oscilações gama, potencial evocado somato-sensitivo, nervo tibial, análise tempo-fre-qüência.
O s c i l l a t o ry neural activity has been investigated at cellular level1, in human electro e n c e p h a l o g r a m ( E E G )2and magnetoencephalogram (MEG)3 , 4. Such oscillations have been related to sensory pro c e s s i n g5 , 6 and perceptual-cognitive functions7 , 8. Various func-tional mechanisms have been associated with this phenomenon as: memory9, attention1 0, object re p re-s e n t a t i o n1 1and pain perc e p t i o n1 2. Thus, accord i n g with Basar et al.6, the brain oscillations should explain the binding problem between the sensory pro c e s s-ing and cognitive functions.
EEG re c o rdings have revealed the existence of
transient frequency oscillations in diff e rent bands, mainly in the gamma band (30-110 Hz). Several au-t h o r s6 , 7 , 1 3 , 1 4have pointed out that if this oscillations appear with the same latency and phase after each stimulus, then it is considered evoked activity. More-o v e r, diff e rent authMore-ors2 , 1 0 , 1 5 , 1 6re p o rted that these oscil-lations build up the morphology of the evoked po-tential (time average synchronized with the stimu-lus).
p resent study aims at investigating the brain oscilla-tions in the frequency band up to 300 Hz, part i c u l a r-ly within the gamma band, during stimulation of the right tibial nerve. In addition, the effect of the stim-ulus artifact in the evoked response is also estimat-ed, both in time and frequency domain. For such in-vestigation, the spectral analysis and statistical test will be applied to the somatosensory evoked poten-tial (SEP).
METHOD
Subjects – EEG signals without (spontaneously) and dur-ing electrical stimulation of the right posterior tibial nerv e at the ankle were re c o rded from twenty one volunteers (18 male), aged between 18 and 42 years old, and height f rom 1.55 to 1.86 m (Table 1), with no symptoms of neu-rological pathology and with normal SEP. The eyes of the subjects were closed during a state of relaxed wakefulness t h roughout the experiment. The SEP's were visually checked by an experienced clinician. The local ethics committee (CEP-HUCFF/UFRJ) approved this research.
Stimuli – The volunteers were subjected to periodic stim-ulation using a SapphireI I4ME (Medelec, UK) Evoked
Po-tential System and two Ag/AgCl electrodes (distance 3 c m ) . A ground electrode was placed at popliteal fossa. Current pulses of 0.2 ms duration and minimum intensity (5-24 m A , Table 1) to provoke the involuntary twitch (motor thresh-old - M T) of the intrinsic foot muscle supplied by the tibial n e rve were employed. The stimulus rate was 5 Hz, for which clearly defined evoked responses are expected2 1. Tw o
sessions of 1024 stimuli ( M T1e MT2) w e re carried out, with at least one minute interval between stimulation periods.
EEG signals – The re c o rding electrodes (Ag/AgCl) were positioned at Cz’ (2 cm behind the Cz electrode position
of the 10-20 International System), with the re f e rence at Fpz’ (midway between Fpz and Fz), as is usual for somato-s e n somato-s o ry evoked potentialsomato-s2 2. The electrode impedance kept
below 2 kΩand the bandpass filter of the Evoked Potential System was set at 10 Hz to 2 kHz. The raw EEG signal fro m the analog output of the SapphireI Iwas digitized at a
sam-pling rate of f s= 5 kHz and a resolution of 12 bits (DAQPad-1200, National Instruments, USA), using software devel-oped in LabVIEW (Version 5.01, National Instruments, USA). The trigger signal, showing the instant of each stimulus, was also acquired. The environmental temperature was controlled nearly 25ºC, that is 25.1±0.6ºC.
S o m a t o s e n s o ry evoked potentials (SEP) – The estimat-ed SEP by coherenc e mean technique (time average syn-c h ronized with the stimulus) of M=800 epochs (epoch is a period between two stimuli) resulted in im provement of
800 in the signal-noise relation (amplitude) from sponta-neously EEG. Also, a better quality of the SEP was obtained by using the algorithm for automatic artifact rejection des-cribed in previous work23.
Spectral analysis – Denoting the SEP as the temporal se-quence of Ldata samples {s(n), n=0,1,2,...,L–1}, its power spectral was obtained by24:
w h e re T=1/fs, fm= m / LT, m=0,1...,L–1 and S[m] is the m c o e f-ficient of discrete-time Fourier Tr a n s f o rm - calculated by Fast Fourier Tr a n s f o rm algorithm (FFT) - that corre s p o n d s to fmf re q u e n c y. Thus, Ps( fm) is the energy contribution of the fm frequency for SEP morphology.
Stimulation artifact – The electrical stimulation of the tibial nerve produces a transient signal of high amplitude
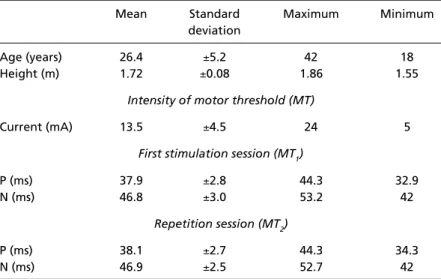
Table 1. Short latency SEP components at Cz’-Fpz’ derivation of the 21 volunteers (identified by an experienced clinician). P and N re p resents the valley and peak latencies corresponding to P37 and N45 components, respectively.
Mean Standard Maximum Minimum
deviation
Age (years) 26.4 ±5.2 42 18
Height (m) 1.72 ±0.08 1.86 1.55
Intensity of motor threshold (MT)
Current (mA) 13.5 ±4.5 24 5
First stimulation session (MT1)
P (ms) 37.9 ±2.8 44.3 32.9
N (ms) 46.8 ±3.0 53.2 42
Repetition session (MT2)
P (ms) 38.1 ±2.7 44.3 34.3
Fig 3. Power spectra of the SEP (M=800 epochs) during M T1
(thick line) and the EEGa (M=800 epochs) just before the stim -ulation (thin line) of the volunteer #21. The power spectra were obtained using a rectangular window of 190 ms duration (spec -tral resolution of 5.3 Hz), from 5 to 195 ms latencies for the S E P. (a) logarithmic scale, (b) linear scale, and (c) percent of the relative accumulated energy.
Fig 2. (a) Spontaneously EEG average (EEGa, –194 to 0 m s ) and SEP during MT1 (0 to 194 ms), for the volunteer #21 and
M= 8 0 0 epochs. (b) Spectrogram using a 1 ms Hann window, without overlapping but with zero padding, resulting in a spec -tral resolution of 10 Hz. (c) zoom of (b).
and short time duration (stimulus artifact) synchronous and immediately after the stimulus. Thus, the effect of this art i-fact in the SEP was estimated by using a time-fre q u e n c y analysis.
RESULTS
The SEP of the Cz'-Fpz' derivation (Fig 1) shows, as expected, the principal morphological character-istics P37 and N452 1 , 2 2. The data in the Table 1 eviden-ce the similarity of the SEP´s, during M T1and M T2 s t i m-ulation sessions.
The time-frequency analysis of the SEP (Fig 2) indi-cated that the stimulus artifact contributes with high e n e rgy in the whole frequency band (0–2 kHz) up to 2 ms after the stimulus (Figs 2B and 2C). Then, the e n e rgy of the stimulus artifact decreases appro x i-mately up to 1 kHz and latency of 5 ms. The statistic-al comparison (non-parametric Wilcoxon test for pair-ed data) between SEP and spontaneously EEG aver-age (EEGa) spectrograms of the 21 volunteers also indicated a diff e rence (p<0.05) up to 5 ms after the stimulus. Furt h e rm o re, notice the increment of the power contribution (approximately up to 1 kHz) in the latencies P37 and N45 in comparison with the EEGa (Fig 2B).
The power spectrum of a rectangular window ( 5 – 1 9 5 ms) of a SEP during M T1(Fig 3) shows the e n e r-gy concentrated up to 100 Hz (99%). On the other hand, the EEGa spectrum shows relative contribu-tions of power in higher frequencies, appro x i m a t e-ly up to 1 kHz (99%). Similar observations were carr i-ed out for all the volunteers and during MT2.
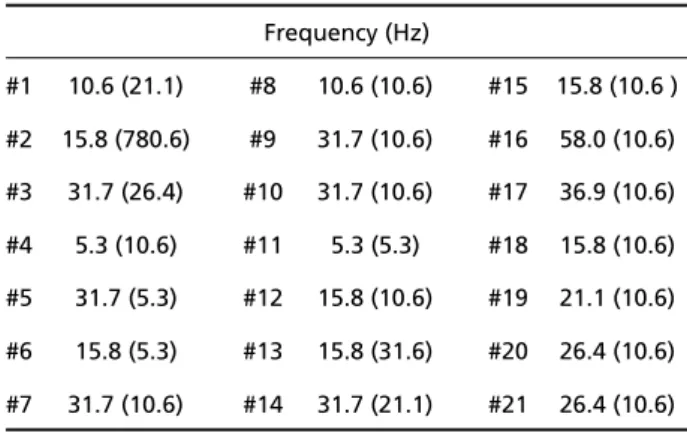
The frequencies corresponding to the maximum
peak of the SEP spectrum, during M T1stimulation, in the 21 volunteers (Table 2) indicate that the band f rom 5 to 58 Hz, with median equal to 21 Hz (Ta b l e 3), contributes with the most power for the SEP mor-p h o l o g y. On the other hand, the EEGa smor-pectrum con-tains the maximm peaks in the 5–780 Hz band, with median equal to 10 Hz. The Wilcoxon test (Table 3) Fig 1. SEP (Cz’-Fpz’ derivation) of 21 volunteers with M= 8 0 0
was applied to these frequency bands and it indicat-ed a significant diff e rence between SEP and EEGa for M T1(p=0.03), although it was not the case for M T2 (p=0.19). Thus, altern a t i v e l y, the Wilcoxon test was applied to each frequency component of the SEP and EEGa spectra in the 21 volunteers. A significant diff e-rence (p<0.01) was found in low frequencies, appro x-imately up to 100 Hz (Fig 4), being the range fro m 30 to 58 Hz the band with most significance differ-ence (p<0.0001). This result was similar for M T2s t i m-ulation session.
DISCUSSION
The time-frequency analysis of the tibial SEP indcated a significant effect (p<0.05) of the stimulus art i-fact in the frequency components of the SEP appro x-imately up to 5ms after the stimulus. In previous stu-dies, the presence of this artifact in the tibial SEP was c o n s i d e red up to 3 m s2 5, 5 m s2 6, and 10 m s2 7. Erw i n et al.28reported that this artifact can be avoided by beginning the analysis from 1 to 5 ms after the stim-ulus, which depend on the stimulated nerve. There-f o re, it is not still established the initial instant There-for analysis of the tibial SEP. Thus, the use of the time-f requency analysis, together with the statistical intime-fer-
infer-ence, it can contribute to determine the stimulation a rtifact duration, although this pro c e d u re cannot g u a-rantee the identification of the long and slow compo-nents of this artifact, because they can be overlapped on the physiologic response.
The frequency of the maximum power of the SEP spectrum, for the group of 21 volunteers, indicated the band up to 58 Hz as the best to identify the evok-ed response to the posterior tibial stimulation. Al-though this pro c e d u re is similar to the adopted by Basar et al.1 4, this band was not statistically diff e re n t (p=0.19) to the EEGa band (up to 780 Hz) during M T2 stimulation session. Such evidence suggests that the spectral analysis alone is not the most appro p r i a t e p ro c e d u re to diff e rentiate bands between the SEP and EEGa. The Wilcoxon test applied to each fre q u e n-cy component of the SEP and EEGa spectra shows sig-nificant diff e rence (p<0.01) up to 100 Hz for both M T1and M T2stimulation sessions. This finding sug-gests that there is relevant information in other fre-quency bands than the 13-55 Hz range used by Gob-belé et al.1 0in their study of the relation between the sensory process (tibial and median nerves) and the attention. However, it is worth to point out that the frequency components with higher contribution to the SEP morphology are within the range from 30 to 58 Hz (significance level, p<0.0001). Nakano and H a s h i m o t o1 9have also found that the energy of the tibial SEP spectrum is concentrated in the range 40–60 Hz, although distributed from 20 to 300 Hz. By stim-ulating other nerves, Noss et al.2 9re p o rted the low f requencies (up to 100 Hz) as those with higher con-tribution to the somatosensory response in the hu-man being.
Fig 4. p-value of statistical comparison (Wilcoxon test for paire d data) between each frequency component of the SEP spectru m and EEGa spectrum just before stimulation. M T1(thick line) and MT2(thin line) sessions.
Table 2. Frequency corresponding to the maximum peak of the SEP spectrum during MT1stimulation in the 21 volunteers (in parentheses values for EEGa spectrum).
Frequency (Hz)
#1 10.6 (21.1) #8 10.6 (10.6) #15 15.8 (10.6 )
#2 15.8 (780.6) #9 31.7 (10.6) #16 58.0 (10.6) #3 31.7 (26.4) #10 31.7 (10.6) #17 36.9 (10.6) #4 5.3 (10.6) #11 5.3 (5.3) #18 15.8 (10.6)
#5 31.7 (5.3) #12 15.8 (10.6) #19 21.1 (10.6) #6 15.8 (5.3) #13 15.8 (31.6) #20 26.4 (10.6)
#7 31.7 (10.6) #14 31.7 (21.1) #21 26.4 (10.6)
Table 3. Statistics for frequency corresponding to the maximum peak of the SEP spectrum (in parentheses values for EEGa spec -trum just before stimulation)
MT1 MT2
Median (Hz) 21.1 (10.6) 15.8 (10.6) Minimum (Hz) 5.3 (5.3) 10.6 (5.3)
Maximum (Hz) 58.0 (780.6) 31.7 (780.6)
Tibial somatosensory evoked potential is now being broadly introduced into clinical practice and intraoperative monitoring3 0 , 3 1. With this aim, norm a l values of SEP parameters are essential for a reliable application. The effect of subject height, age and gender on latency, inter-peak interval and amplitude characteristics of tibial SEP was recently investigat-e d3 1. In this kind of studies, the time-frequency analy-sis here applied, as well as the frequency components that better characterize the SEP is fundamental for investigating the brain oscillations due somatosen-sory stimulation. Moreover, these frequencies could be considered for somatosensory evoked potential intraoperative monitoring and clinical applications.
Acknowledgments – The authors are grateful to Dr. Eduardo Zaeyen for his help in EEG acquisitions.
REFERENCES
1. Steriade M. Cellular substrates of brain rhythms. In Niedermeyer E, Lopes da Silva FH (eds). Electroencephalograpy: basic principles, clin-ical applications, and related fields. 4 Ed. New York: Williams & Wi l k i n s , 1998:28-75.
2. B a s a r- E roglu C, Demiralp T. Event-related theta oscillations: an inte-grative and comparative approach in the human and animal brain. Int J Psychophysiol 2001;39:167-195.
3. Della Penna S, To rquati K, Pizzella V, et al. Temporal dynamics of alpha and beta rhythms in human SI and SII after galvanic median nerve stimulation: a MEG study. Neuroimage 2004;22:1438-1446. 4. Lopez L, Sannita WG. Magnetically recorded oscillatory responses to
luminance stimulation in man. Electroencephalogr Clin Neuro p h y s i o l 1997;104:91-95.
5 . Sannita WG. Stimulus-specific oscillatory responses of the brain: a time/ f re q u e n c y - related coding process. Clin Neurophysiol 2000;111 : 5 6 5 - 5 8 3 . 6. Basar E, Basar- E roglu C, Karakas S, Schürmann M. Oscillatory brain theory: a new trend in neuroscience. IEEE Eng Med Biol Mag 1999;18: 56-66.
7. Herrmann CS, Munk MHJ, Engel AK. Cognitive functions of gamma-band activity: memory match and utilization. Trends Cogn Sci 2004; 8:347-355
8. Basar E, Basar- E roglu C, Karakas S, Schürmann M. Gamma, alpha, delta, and theta oscillations govern cognitive process. Int J Psycho-physiol 2001;39:241-248.
9. Düzel E, Habib R, Schott B, et al. A multivariate, spatiotemporal analy-sis of electromagnetic time-frequency data of recognition memory. Neuroimage 2003;18:185-197.
10. Gobbelé R, Waberski TD, Schmitz S, Sturm W, Buchner H. Spatial dire c-tion of attenc-tion enhances right hemispheric event-related gamma-band synchronization in humans. Neurosci Lett 2002;327:57-60. 11. Kaiser J, Bühler M, Lutzenberger W. Magnetoencephalographic
gam-ma-band responses to illusory triangles in humans. Neuroimage 2004; 23:551-560.
12. Pascalis VD, Cacace I. Pain perception, obstructive imagery and phase-ordered gamma oscillations. Int J Psychophysiol 2005;56:157-169.
13. Karakas S, Basar E. Early gamma response is sensory in origin: a con-clusion based on cross-comparison of results from multiple experimen-tal paradigms. Int J Psychophysiol 1998;31:13-31.
14. Basar E, Basar- E roglu C, Demiralp T, Schürmann M. Time and fre q u e n-cy analysis of the brain’s distributed gamma-band system. IEEE Eng Med Biol Mag 1995;14:400-410.
15. Karakas S, Basar- E roglu C, Ozesmi Ç, Kafadar H. Gamma response of the brain: a multifunctional oscillation that represents botom-up with top-down processing. Int J Psychophysiol 2001;39:137-150. 16. Rossini PM, Cracco RQ, Cracco JB, House WJ. Short latency
somatosen-sory evoked potentials to peroneal nerve stimulation: scalp topogra-phy and the effect of diff e rent frequency filters. Electro e n c e p h a l o g r Clin Neurophysiol 1981;52:540-552.
17. Inoue K, Hashimoto I, Nakamura S. High-frequency oscillations in hu-man posterior tibial somatosensory evoked potentials are enhancend in patients with Parkinson’s disease and multiple system atro p h y. Neurosci Lett 2001;297:89-92.
18. Maegaki Y, Najm I, Terada K, et al. Somatosensory evoked high-fre-quency oscillations re c o rded directly from the human cerebral cortex. Clin Neurophysiol 2000;111:1916-1926.
19. Nakano S, Hashimoto I. Comparison of somatosensory evoked high-f requency oscillations ahigh-fter posterior tibial and median nerve stimula-tion. Clin Neurophysiol 1999;110:1948-1952.
20. Sakuma K, Sekihara K, Hashimoto I. Neural source estimation from a t i m e - f requency component of somatic evoked high-frequency magnet-ic oscillations to posterior tibial nerve stimulation. Clin Neuro p h y s i o l 1999;110:1585-1588.
21. Chiappa KH. Evoked potentials in clinical medicine, 3rdEd. Philadel-phia: Lippincott-Raven, 1997.
22. Misulis KE. Espehlmann’s evoked potential primer: visual, auditory and somatosensory evoked potentials in clinical diagnosis, 2n dE d . Boston: Butterworth-Heinemann, 1994.
23. Simpson DM, Tierra-Criollo CJ, Leite RT, Zayen EJB, Infantosi A F C . Objective response detection in an electroencephalogram during somatosensory stimulation. Ann Biomed Eng 2000;28:691-698. 24. Marple SL. Digital spectral analysis with applications. Englewood
Cliffs-New Jersey: Prentice-Hall, 1987.
25. Kakigi R, Shibasaki H. Scalp topography of the short latency somatosen-sory evoked potentials following posterior tibial nerve stimulation in man. Electroencephalogr Clin Neurophysiol 1983;56:430-437. 26. Kakigi R. The effect of aging on somatosensory evoked potentials
fol-lowing stimulation of the posterior tibial nerve in man. Electro e n-cephalogr Clin Neurophysiol 1987;68:277-286.
27. Pelosi L, Cracco JB, Cracco RQ. Conduction characteristics of somatosen-sory evoked potentials to peroneal, tibial and sural nerve stimulation in man. Elecencephalogr Clin Neurophysiol 1987;68:287-294. 28. Erwin CW, Rozear MP, Radtke RA, Erwin AC. Somatosensory evoked
potentials and surgical monitoring. In Niedermeyer E, Lopes da Silva FH (eds). Electroencephalograpy: basic principles, clinical applications, and related fields, 3rdEd. Baltimore: Williams &Wilkins, 1993:957-974. 29. Noss RS, Boles CD, Yingling CD. Steady-state analysis of somatosen-sory evoked potentials. Electroencephalogr Clin Neurophysiol 1996;100: 453-461.
30. MacDonald DB, Stigsby B, Al Zayed Z. A comparison between deriva-tion optimizaderiva-tion and Cz–FPz for posterior tibial P37 somatosensory evoked potential intraoperative monitoring. Clin Neurophysiol 2004; 115:1925-1930.