http://dx.doi.org/10.1590/S1982-21702014000300033
AN OUTLIER DETECTION METHOD IN GEODETIC
NETWORKS BASED ON THE ORIGINAL OBSERVATIONS
Um método de detecção de “outlier” em redes geodésicas baseado nas observações originais
BAHATTIN ERDOGAN
Department of Geomatic Engineering Yildiz Technical University, Istanbul, Turkey,
e-mail:[email protected]
ABSTRACT
The observations in geodetic networks are measured repetitively and in the network adjustment step, the mean values of these original observations are used. The mean operator is a kind of Least Square Estimation (LSE). LSE provides optimal results when random errors are normally distributed. If one of the original repetitive observations has outlier, the magnitude of this outlier will decrease because the mean value of these original observations is used in the network adjustment and outlier detection. In this case, the reliability of the outlier detection methods decreases, too. Since the original repetitive observations are independent, they can be used in the adjustment model instead of the estimating mean value of them. In this study, to show the effects of the estimating mean value of the original repetitive observations, a leveling network that contains both outward run and backward run observations were simulated. Tests for outlier, Huber and Danish methods were applied to two different cases. First, the mean values of the original observations (outward run and return run) were used; and then all original observations were considered in the outlier detection. The reliabilities of the methods were measured by Mean Succes Rate. According to the obtained results, the second case has more reliable results than first case.
RESUMO
As observações nas redes geodésicas são medidas repetitivamente, e na fase de ajustamento, os valores médios destas observações originais são usados. O operador “média”, é um tipo de estimador de mínimos quadrados (LSE). O LSE oferece resultados ótimos quando os erros aleatórios são normalmente distribuídos. Se uma das observações repetitivas originais tem outlier, a magnitude deste outlier diminui porque o valor médio das observações originais é usado no ajustamento da rede e consequentemente, na detecção de outlier a confiabilidade do método também diminui. Uma vez que as observações repetitivas originais são independentes, elas próprias podem ser usadas no método de ajustamento ao invés do valor médio estimado. Neste estudo, para mostrar os efeitos do valor médio estimado das observações repetitivas originais, uma rede de nivelamento que contém ambas as observações de ida e volta dos percursos foi simulada com outliers. Para testar a detecção dos mesmos, os métodos Huber e Danish foram aplicados em dois casos diferentes. Primeiramente, os valores médios das observações originais (de ida e de volta) foram usados, e então todas as observações originais foram consideradas na detecção dos outliers. A confiabilidade dos métodos foi medida pela razão de sucesso médio. De acordo com os resultados calculados o segundo caso teve resultados mais confiáveis do que o primeiro.
Palavras-chave: Detecção de Outliers; Observações Originais; Testes para Detecção de Outliers; Método Robusto; Confiabilidade.
1. INTRODUCTION
The geodetic networks (the leveling network, horizontal control network or Global Navigation Satellite System (GNSS) network) are established and the observations are measured at least two times repetitively. Depending on the different reasons i.e. based on environment or user attention or equipment conditions, some outliers may be occurred in the observations. These outliers can affect the estimated parameters and their variances, so that these obtained wrong results may cause wrong assumptions. Therefore the outlier in the observations must be detected.There are two main approaches to detect outlier in Geodesy: Tests for outlier (BAARDA 1968; POPE 1976) and robust methods (HUBER 1981; HAMPEL et al. 1986; ROUSSEEUW and LEROY 1987; KOCH 1999).
a height difference is measured as outward run and return run. They are called here as original observations.The mean value of them is estimated and used for network adjustment.It is known that the outward run hoi and the return run hri are independent from each other. If the outward run or the return is contaminated, the half of the outlier (∆) arises in the mean value (hoi + hri)/2+∆/2). Since the outlier (∆) is
replaced by ∆/2 in the ordinary adjustment, detecting small outlier gets more
difficult. Therefore, each of the repetitive observations should be used in the ordinary adjustment model.
In order to measure the capacities of the outlier detection method Hekimoglu and Koch (1999) and (2000) proposed using the Mean Success Rate (MSR)that is the number of success divided by the number of the total number of experiments in the simulation study. In robust statistics, the breakdown point is also used to measure the global capacity (i.e. reliability) of the robust methods(XU 2005; YOUCAI 1995). The MSR has been used in regression analysis (HEKIMOGLU and KOCH 1999; HEKIMOGLU and KOCH 2000; HEKIMOGLU and BERBER 2003; HEKIMOGLU 2005) also in geodetic networks (HEKIMOGLU and ERENOGLU 2007; ERENOGLU and HEKIMOGLU 2010; HEKIMOGLU et al. 2011; HEKIMOGLU and ERDOGAN 2013).
In this study, the effects of the estimating mean value of the original repetitive observations were investigated. A leveling network that consists outward runs and return runs was simulated. The outliers that had the different magnitude intervals were added to the observations and the contaminated observations were obtained. Tests for outlier and robust method were applied to these contaminated working samples. The MSRs of the methods were obtained. According to the obtained results the case that considers all original observations in adjustment model has more reliable results than the case that considers the mean value of the original observations in the ordinary adjustment model.
2. LINEAR MODELS
The Gauss-Markov linear model for the geodetic networks is given as follows (KOCH 1999):
, (1)
(2)
(3)
(4)
matrix, σ is the variance with unit weight, is the nxn covariance matrix of the observations, is the cofactor matrix of the parameter vector, is the cofactor matrix of the residual vector, n is the number of observations and u is the number of unknown parameters.
2.1 Tests for Outlier
Outlier detection procedures were proposed by Baarda (1968) and Pope (1976) for geodesy. It is assumed that the outliers are rare in the observations; they are called “bad” observations and their expectation value is larger than 3σ.
If an observation li has an outlier δli the hypothesis
: 0 against : 0 (5)
is tested. If the a priori variance of unit weight is known, the normalized residual is estimated to obtain test statistic as follows (the covariance matrix of the observations is diagonal):
! |#$|
%&'())$
|#$|
%)$ (6)
Whereqvvi is the ith diagonal element of Qvv. σvi is the standard deviation of the ith residual. If ! * + ,⁄ , the ith observation is considered as an outlier. α is
generally chosen as 0.001 for Baarda’s test (BAARDA, 1968).
If the a priori variance is not known, the studentized residual are estimated by using a posteriori variance . The test statistic of the Pope test (τ – test) is given
(POPE, 1976).
. |#$|
%/&'())$
|#$|
%/)$ (7)
If the level of significance α corresponds to all observations, the level of
significance for each observation must be 0 1⁄ :
23. 4 5 ,,6,6 78 1 0 1⁄ (8)
where 5 ,,6,6 7 . , 6⁄ , ,6 7 and α is generally chosen as 0.05 (KOCH 1999).
Baarda and Pope Tests in geodetic network are iterative methods. Only the observation with the largest normalized or studentized residual is tested in one cycle of the iterations. If this observation is rejected, it is removed, and the remaining observations are adjusted again. This procedure is carried out until no more outliers are detected (SCHWARZ and KOK, 1993).
2.2 Robust Methods
theM-estimation is non-linear. To solve it, iteratively reweighted LSE is used (KOCH. 1999). The M-estimations of Huber and Danish methods were used in this paper (KRARUP et al., 1980; HUBER, 1964).
: ;<: ;<: (9)
;<: ;3 :8, = 1, 2 … (10)
;3 8 @ (11)
:
: (12)
Where E is the identity matrix, k is the number of iterations and c is the tuning constant. For the first iteration is estimated from Eq(2). Then, for each iteration step the diagonal elements of the weight matrix w< are changed according to related weight function W3vDE8; and : and E are recalculated for each step.
2.2.1 The M-Estimation of Huber
F G H1 |G | I 5J
|#$| |G | * 5
K (13)
k and c are chosen as 5 and 1.5σo, respectively.
2.2.2 The M-Estimation of Danish
F G Hexp 1 |#$| |G | 4 5
J |G | O 5
K
(14)
k and c are chosen as 5 and 1.5σo, respectively.
If the residual that is estimated at the last iteration is greater than the 3σo, it is
detected as outlier; otherwise it is assumed as good observation.
3. MOTIVATION
3.1 Leveling Network
At the leveling network the height differences are measured as outward run (hoi) and return run (hri). In the outlier detection step, the means of the outward runs and return runs are used and sometimes the effects of the outliers become smaller and also they may disappear. Furthermore, LSE smears the effect of the outlier all over the residuals of the other observations. If we can eliminate this effect, more reliable results can be obtained. This situation can be realised by using original observation without computing mean.
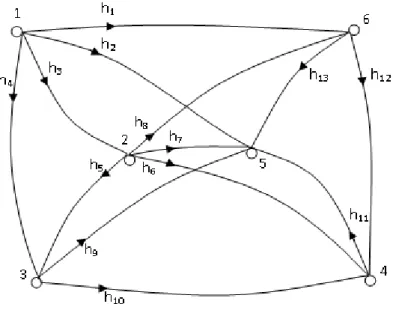
To investigate the effects of the using all original observations for outlier detection, two leveling networks given in Figs. 1 and 2 are considered. These networks have the same observations. The network given in Fig.1 includes the mean value of the outward run and return run. The analysis which is applied in this network is called “classical approach”. The network given in Fig. 2 includes all original observations as outward run and return run. The analysis which is applied in this network is called as “new approach”.
Each height difference hiin the Fig. 1 is a mean value of the outward run (hoi) and the return run (hri) in Fig.2, i.e. hi=(hoi+hri)/2. Also, hoi and hri are independent from each other. It is possible that the outward run or the return run or both of them may be contaminated. If the outward run or the return run is contaminated, the half of the outlier (∆) arises in the mean value (hi+ ∆/2).
Figure 2 - A leveling network that considers both outward runs and return runs.
To prove the reliability of the new approach, the networks given in Figs.1 and 2 were considered. The heights of six points were: H1=100.000m, H2=102.256m, H3=105.246m, H4=106.245m, H5=104.946 m and H6=103.486 m,respectively. The height differences that were not affected from random errors h0i(i=1,2,..,13) and then the height differences for outward run (hoi) and return run (hri)were computed. To obtain the measurements of the height differences the random errors (eoi and eri) were generated from a normal distribution. They were added to the height differences. The precision was taken as P √R ( 1 SS √1 =S⁄ ) where S was the length of the leveling line in km. For the classical approach the precisions of the means of the original observations were estimated and used. The lengths of the leveling line for Figs. 1 and 2 varied between 0.85 km and 1.9 km. Thus, the measurements of the height differences (hoi,hrii=1, 2,…, 13)were computed as
T TU V , W 1,2, … ,13 (15a)
TY TU VY, W 1,2, … ,13 (15b)
TZ TU [T , W 1,2, … ,13 (16)
In this section the following cases are tested: I. The observations do not include any outlier.
II. The outward run (ho5) is contaminated with +5mm magnitude. III. The return run (ho7) is contaminated with -10 mm magnitude.
IV. The outward run and return run (ho2 and hr11) is contaminated with +10mm magnitude.
V. The outward run and return run (ho8 and hr10) is contaminated with -20 mm and +1000 mm magnitude, respectively.
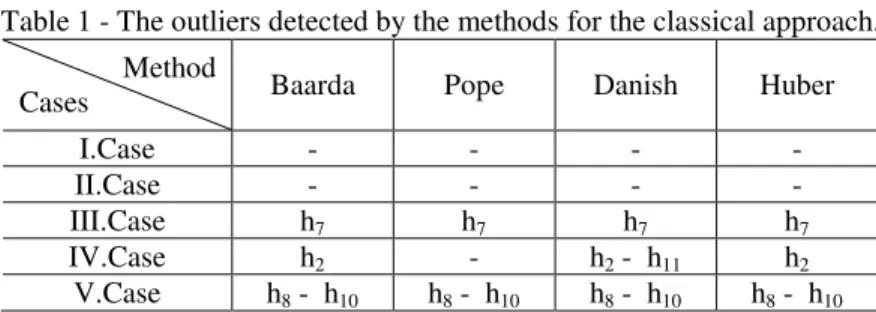
To compare the new approach with classical approach, five different cases were analysed. Table 1 and Table 2 show the outliers that were detected by the classical approach and the new approach, respectively.
Table 1 - The outliers detected by the methods for the classical approach.
For the first case,all methods didnot detect any outlier; they were successful when the observations did not include outlier.
Table 2 - The outliers detected by the methods for the new approach.
For the second case,the methods in the classical approach did not detect the outlier,whereas the methods in the new approach detected the outlier (ho5) successfully. In the classical approach the magnitude of the outlier decreases, so that the all methods are unsuccessful.
Method
Cases Baarda Pope Danish Huber
I.Case - - - -
II.Case - - - -
III.Case h7 h7 h7 h7
IV.Case h2 - h2 - h11 h2
V.Case h8 - h10 h8 - h10 h8 - h10 h8 - h10
Method
Cases Baarda Pope Danish Huber
I.Case - - - -
II.Case ho5 ho5 ho5 ho5
III.Case ho7 ho7 ho7 ho7
For the third case, all methods that were used in the classical approach and new approach detected the true outlier.
For the fourth case, there were two outliers in the observation. Baarda and Huber’s methods detected only one of them, Danish method detected two outliers and Pope’s test did not detect any outlier in classical approach. All methods in the new approach was able to detect two outliers successfully.
For the fifth case, there were two outliers and the magnitude of one of them was very large. All methods are successful for this case.
4. MONTE CARLO SIMULATION RESULTS
The success of the robust methods and Tests for outlier are changed from one sample to the other one where the random errors are different (HEKIMOGLU and KOCH, 1999; HEKIMOGLU and KOCH, 2000). The success of the methods for different samples may be different. Therefore, to obtain the reliability of the new approach 10 000 working samples were simulated and analysed. For Monte Carlo simulation the networks given in Figs. 1 and 2 were considered.
4.1 Classical Approach
The random errors and the mesurements for outward run and return run (i.e. the height differences) and outlier were generated as done in above section. The outlier was added only outward run or return run. A hundered random error vectors e were generated and then a hundered good sample also were generated by adding only random errors to the height differences (\]). In addition, for each sample was contaminated by one and two outliers 100 times. Thus, 10 000 contaminated samples were obtained for one outlier and two outliers separately (HEKIMOGLU and ERENOGLU, 2007; ERENOGLU and HEKIMOGLU, 2010; HEKIMOGLU et al., 2011; HEKIMOGLU and ERDOGAN, 2013).
The mean values of outward run and return run of this leveling network (Fig.1) were firstly analyzed by employing the classical approach with two main approaches such as Tests for outlier and robust methods (Danish and Huber methods) to decide whether observations includes outlier or not.
The MSRs and standard deviations of Tests for outlier and robust methods are given in Tables 3 and 4. α is chosen 0.001 and 0.05 for Baarda and Pope’s test,
respectively. For Danish and Huber methods c is taken as 1.5. If the residuals that are estimated at the last iteration of Danish and Huber methods greater than the threshold value, these residuals are considered as outliers.The threshold value is chosen as 3 P. The magnitude intervals for outliers are chosen as 3σ - 6σ and 6σ -
12σ.
The MSRs of all methods are very small for the magnitude interval between 3σ
and 6σ because the estimation of the mean value of outward run and return run
high precision estimations; the undetectable outliers affect badly the estimation parameters and their standard deviations.
Table 3 - MSRs and standard deviations of the Tests for outlier and robust methods between 3σ and 6σ for the classical approach.
The number of Outliers
Method (%) 0 (%) 1 (%) 2
Baarda 100 1.1±2.1 0
Pope 95 12.9±15.5 0.3±1.3
Danish 100 11.5±6.5 1.1±1.7
Huber 100 2.0±2.7 0.1±0.3
Table 4 - MSRs and standard deviations of the Tests for outlier and robust methods between 6σ and 12σ for the classical approach.
The number of Outliers
Method (%) 1 (%) 2
Baarda 62.1±10.9 27.3±9.0
Pope 68.1±24.8 5.3±6.1
Danish 83.6±8.0 62.8±11.1
Huber 68.1±9.4 41.8±9.0
4.2 The New Approach for Detection of Outlier
The outward run and return run of height differences are independent measurements. They can be considered in the adjustment model. All original observations should be in the adjustment model, so that the smearing effect of the mean operator can be removed. The height differences and the outlier and the random errors are exactlythe same as in the classical approach. The obtained MSRs and standard deviations of the methods are given in Tables 5 and 6.
Table 5 - MSRs and standard deviations of the Tests for outlier and robust methods between 3σ and 6σ for the new approach.
The number of Outliers
Method (%) 0 (%) 1 (%) 2
Baarda 97 78.7±13.2 62.2±12.9
Pope 94 68.0±23.0 32.9±26.6
Danish 88 80.4±26.7 72.5±24.1
Table 6- MSRs and standard deviations of the Tests for outlier and robust methods between 6σ and 12σ for the new approach.
The number of Outliers
Method (%) 1 (%) 2
Baarda 97.2±14.2 97.4±12.4
Pope 94.8±19.3 93.7±17.1
Danish 87.9±29.4 88.2±27.4
Huber 92.1±22.0 91.8±19.9
The MSRs of the new approach are greater than the ones of the classical approach. There is a huge improvement for small and large magnitude intervals. Since the original observations are considered in the adjustment model the smearing effects of the estimation mean value is removed. Moreover, the Baarda, Pope, Danish and Huber methods in the new approach can be detected the good observations (Type I error) as outliers at the rates of the 3%, 6%, 12% and 9%, respectively. It is a risk for outlier detection.
5. CONCLUSION
The observations in geodetic networks are measured repetitively andthen the means value of them are calculated and these valuesare used in the adjustment model. If the observations do not contain any outlier there is not any problem. If the observations include at least one outlier, themean value smears the outliers on the other part of the observation. Therefore, the outlier analysis must be based on the original observations, not on the mean value of them. Ifthe MSRs of the new approach are compared with the MSRs of the classical approachit is clearly seen that thereliabilities of the new approach are significantly greater than the ones of the classical approach. Moreover, if the observations do not have any outlier, Type I error increase. Consequently, the original observations of a geodetic network should be preferred for the outlier detection without using any estimator before the network adjustment to obtain more reliable results.
REFERENCES
BAARDA, W..A Testing Procedure for Use in Geodetic Networks, Publication on Geodesy, New Series 2, no.5., Netherlands Geodetic Commission, Delft, 1968. ERENOGLU, R. C.;HEKIMOGLU, S. Efficiency of Robust Methods and Tests for
Outliers for Geodetic Adjustment Models, Acta.Geod. Geoph.Hung.Vol.45(4): 426-439,2010.
HEKIMOGLU, S.;KOCH, K. R.How Can Reliability of the Robust Methods be Measured?, in Third Turkish German Joint Geodetic Days, Altan and Gründing (Eds), 1-4June,Istanbul, Turkey, 179-196, 1999.
HEKIMOGLU, S.; KOCH, K. R. How Can Reliability of the Test for Outliers Be Measured?, Allg. Vermes.Nachr. 107(7): 247-254, 2000.
HEKIMOGLU, S.; BERBER, M. Effectiveness of Robust Methods in Heterogeneous Linear Models, Journal of Geodesy 76: 706–713, 2003. HEKIMOGLU, S. Do Robust Methods Identify Outliers More Reliably Than
Conventional Test for Outlier?,Zeitschriftfür Vermessungwesen, 2005/3, 174-180, 2005.
HEKIMOGLU, S.; ERENOGLU, R. C. Effect of Heteroscedasticity and Heterogeousness on Outlier Detection for Geodetic Networks, Journal of Geodesy, 81(2): 137-148, 2007.
HEKIMOGLU, S.; ERDOGAN, B.; ERENOGLU, R. C.;HOSBAS, R. G. Increasing the Efficacy of the Tests for Outliers for Geodetic Networks,
Acta.Geod.Geoph. Hung., 46(3):291-308, 2011.
HEKIMOGLU S.; ERDOGAN B.Application of Median-Equation Approach for Outlier Detection in Geodetic Networks, Boletim de CienciasGeodesicas, Vol. 19, Issue 4, pp. 548-557, 2013.
HUBER, P. J. Robust Estimation of a Location Parameter, Ann Math Statist 35: 73– 101, 1964.
HUBER, P. J. RobustSstatistics. John Wiley and Sons. Inc., New York, 1981. KOCH, K. R. Parameter Estimation and Hypothesis Testing in Linear Models,2nd
Ed. Springer-Verlag, Berlin, 1999.
KRARUP, T.; JUHL, J.;KUBIK, K. Götterdaemmerung over Least Squares Adjustment, In: Procedings 14th congress of int. soc.photogr. Hamburg, 1980. POPE, A. J. The Statistics of Residuals and the Detection of Outliers, NOAA
Technical Report, NOS 65, NGS 1, Rockville, MD, 1976.
ROUSSEEUW, P. J.;LEROY, A. M. Robust Regression and Outlier Detection, John Wiley and Sons, Inc., New York, 1987.
SCHWARZ, C. R.;KOK, J. J. Blunder Detection and Data Snooping in LS and Robust Adjustment, J. Surv. Eng. 119(4):128-136, 1993.
XU, P. L. Sign-Constrained Robust Least Squares, Subjective Breakdown Point and the Effect of Weights of Observations on Robustness, Journal of Geodesy
79:146-159, 2005.
YOUCAI, H. On the Design of Estimators with High Breakdown Points for Outlier Identification in Triangulation Networks, Bull. Geod.69:292 – 299, 1995.