http://dx.doi.org/10.1590/S1982-21702014000300041
PHOTOGRAMMETRIC APPROACH IN DETERMINING
BEAM-COLUMN CONNECTION DEFORMATIONS
Enfoque fotogramétrico para a determinação da deformação na conexão de colunas-de-viga
ALI KOKEN1
MEHMET ALPASLAN KOROGLU2
HAKAN KARABORK3 AYHAN CEYLAN3
1 Department of Civil Engineering, Selcuk University
42075 Konya/Turkey
2Department of Civil Engineering, Necmettin Erbakan University
42060 Konya/Turkey
3 Department of Geomatics Engineering, Selcuk University
42075 Konya/Turkey
([email protected];[email protected]; [email protected]; [email protected])
ABSTRACT
Keywords: Photogrammetry; Beam-Column Connection; Rotation.
RESUMO
De acordo com os avanços em tecnologia, técnicas de cálculo de deslocamentos estão sempre se desenvolvendo. A Fotogrametria tem se tornado a ferramenta preferida em algumas novas disciplinas com os avanços dos métodos de processamento de imagem. Neste estudo, os autores usaram duas técnicas de medidas distintas para determinar os ângulos de rotação em conexões de colunas-de-vigas, as quais estão sujeitas a cargas cíclicas reversíveis. O primeiro destes é método é amplamente usado, o método convencional em experimentos mecânicos estruturais, onde transformações diferenciais de variáveis lineares são usados (LVDTs), e o segundo é a técnica de medição fotogramétrica. Os ângulos de rotação foram determinados usando esta técnica num total de 10 experimentos de conexão coluna-de-viga de aço. Após ma discussão dos procedimentos dos métodos mencionados, os resultados foram apresentados. Foi osbservado que os ângulos de rotção medidos por cada método foram muito semelhantes, Conclui-se que a técnica de medição fotogramétrica poderia ser usada como alternativa para os métodos convencionais, onde as transformações direfenciais de variáveis lineares (LVDTs) são usadas.
Palavras-chave: Fotogrametria; Conexões de coluna-de-viga; Rotação.
1. INTRODUCTION
The mechanical behavior of steel beam-column connections affects the internal force distributions and deformations of steel frame structures. The internal forces in two-dimensional frames (axial force, shear force, and the bending moment) are transferred to structural members via member connections. The deformations in the connections due to axial and shear forces are relatively small and negligible when compared to the deformations due to rotations(CHEN and LUI, 1991). Therefore, the rotations in member connections are of high importance in the mechanical performance of the frame.
The rotational capacities of the member connections were obtained from the experimental data of the relevant studies in the technical literature. Many studies have been conducted to determine the rotational capacities of different beam-column connection configurations around the world (TSAI et al. 1995; YARDIMCI et al. 1996; YORGUN and BAYRAMOGLU 2001; GARLOCK et al. 2003;SHI et al. 2007). In these experimental studies, Linear Variable Differential Transformers (LVDTs) (either EPC or LVDT), which were positioned in the beams and the columns, were utilized to determine the deformations in the member connections. With the help of these data, researchers have created different formulations to obtain rotation angles in connections (YORGUN and BAYRAMOGLU 2001; Chen et al. 2001; Li et al. 2002).
very large, and also in fire experiments. Gordon and Lichti (2004) used topographic laser scanners to obtain deformations that occur in various loading configurations in three different sets of experiments. In the study, they verified the vertical deformations in wood and steel beams and also in a wood bridge that were measured using conventional methods utilizing the topographic laser scanning technique. Gordon and Lichti (2007) measured the vertical displacement of two beamsby terrestrial laser scanners (TLSs). They had the bending test on both timber and concrete beams. They proved that laser scanners are an attractive alternative or additionalmeasurement technique to the traditional methods, not only for beams in both laboratory and field environments, but also for the other structural deformation situations. Ceylan and Gümüş (2011) determined the values and directions of the deformations by using a topographic laser scanner. The results of this study were consistent with the results obtained by conventional methods. Deflections in a concrete beam subjected to flexural load-testing were measured by Lichti et al. 2012 with range camera. Chounta and Ioannidis (2012) applied an automatic photogrammetric process for monitoring the dynamic behavior of concrete beams when exposed to mechanical strain during a loading test. They calculated 3D point coordinates by a photogrammetric intersection solution. In 2012, Valenca et al. first obtained the creep deformation in a large-span reinforced concrete beam, then steel beam-column connections, and lastly the deformations in a pedestrian bridge using photogrammetric methods. Valenca made the measurement by setting 60 static and 70 dynamic targets on beam-column connections of two intermediate columns. The authors attached almost all of the dynamic targets on the web and flange of the column, which were focused on the deformation of the column. After taking 1450 readings in the connection, the authors determined the RMS (root mean square) of the three-dimensional displacement as 0.003 mm. Qi and Lichti (2012) measured dynamic deformation in concrete beam with range cameras. They compared the results with laser displacement sensors and showed that beam movements with small amplitude (4mm) and low frequency (1Hz) can be recovered from the time series with sub-millimeter accuracy. Mustaffar et al. (2012) also measured structural beams and columns under various loads by taking some series of imagesby digital cameras. They had donea full-scale load tests on structural components. The measures of structural beam and column displacements were analyzed using digital close range photogrammetric technique. Photogrammetric outputs were compared against the results obtained from the LVDTs to validate the deformation and displacement of beam and columns. Kwak et al. (2013) achieved submillimeter accuracy for the calculation of both vertical deflections and horizontal displacements to unite two methodologies of photogrammetric reconstruction— image-matching-based reconstruction and model-based image fitting.
beam to column connection of steel frame. This cheap and easy technique is used firstly on measuring the rotation capacity of steel frame beam to column connections in the literature for cycling tests.
In this study, the feasibility of the photogrammetric technique as an alternative to conventional measurement methods was discussed in the steel frame beam-column connection of a corner steel beam-column, which was subjected to reversible cyclic loading. While only the deformations in the member connections can be determined by using LVDTs, with photogrammetric methods, it is possible to obtain three-dimensional deformation values in any part of beams or columns. For this purpose, the deformation measurements in beam-column connections were conducted by both LVDT-based conventional method and the photogrammetric measurement technique. The results of both measurements were then compared.
2. MATERIALS AND METHODOLOGY
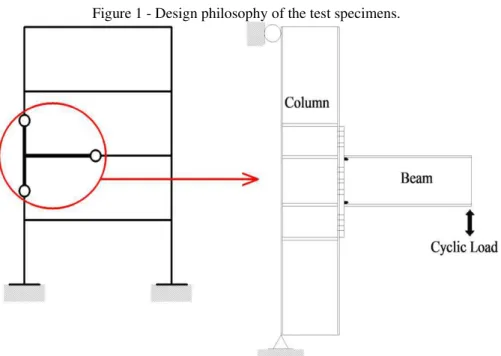
The test specimens were manufactured to represent the connection of a steel structure with moment frame (Figure 1). Hinge supports were used at the column ends and the specimens were subjected to reversible cyclic loading.
Figure 1 - Design philosophy of the test specimens.
2.1 Test Specimen Specifications
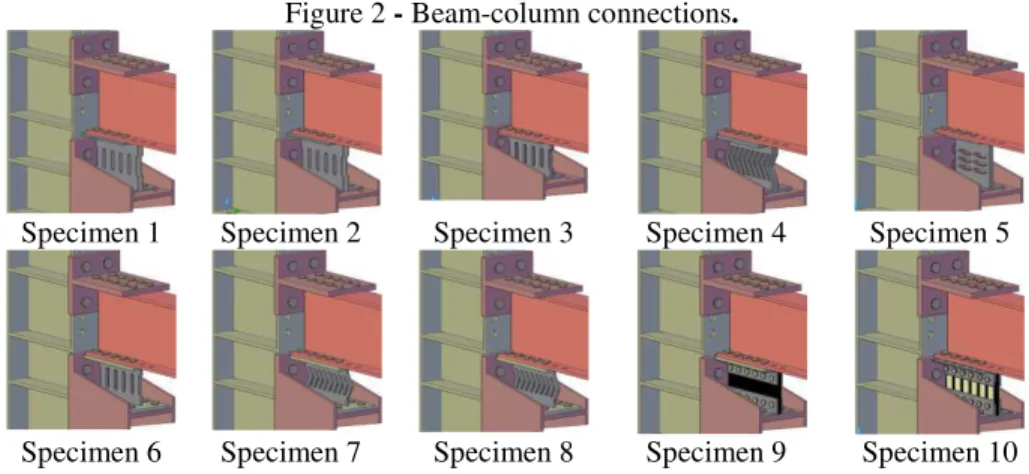
Figure 2 - Beam-column connections.
Specimen 1 Specimen 2 Specimen 3 Specimen 4 Specimen 5
Specimen 6 Specimen 7 Specimen 8 Specimen 9 Specimen 10
The displacements were verified in all experiments. Loading controls were made in compliance with FEMA-351and based on the cycles in the study of Pachoumis et al. 2010. The cycle-rotation graph is presented below in Figure 3.
Figure 3 - Loading used in experiments.
2.2 Measurement Method Used In Experiments
• Conventional measurement technique, which is commonly used in structural engineering experiments. The measurements were done by placing LVDTs on the test specimens.
• Photogrammetric methods, which is based on evaluating the photographs taken during the experiment from a predetermined location.
2.3 Conventional Measurement Technique via LVDT
The same method was used to measure the rotations in the member connections of the test specimens. In order to measure the displacements, electronic LVDTs were used. Displacement data read by LVDTs were transferred to the data acquisition system via cable. Similarly, the load applied to the system was read from the load cell. LVDTs were calibrated before every experiment. Also all LVDTs were rigidly connected to a rigid platform. This process was repeated for every experiment.
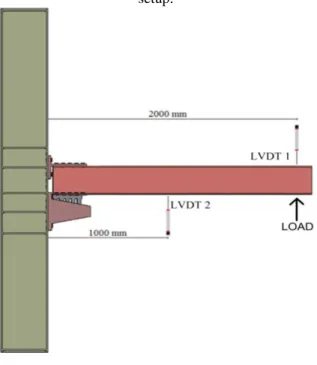
The measurement used in steel frame systems is presented in Figure 4. The vertical displacement at the end of the beam was measured by LVDT 1, and the vertical displacement at mid-span was measured by LVDT 2. Since the column’s top and bottom ends were fixed, they did not move. Also a load cell located at the end of the beam measured the load applied to the beam.
2.4 Photogrammetric Measurement Method
In addition to the conventional method, photogrammetric measurement methods were also used in order to determine the displacement in the experiments. Photogrammetry is the art and science of determining the position and shape of objects from photographs, the result of photogrammetric measurements may be numbers (i.e. coordinates of object points in a three-dimensional coordinate system), plots (i.e. maps and plans with planimetric detail and contour lines, together with other graphic representation of objects), and images (primarily rectified photographs) (KRAUS, 1993).
In each of the experiments, after each cycle, photographs were taken from different angles. Photographs were taken using a Samsung ES70 digital camera. Focal length of the camera was 5mm and sizes of the photographs were 4000x3000 pixels.
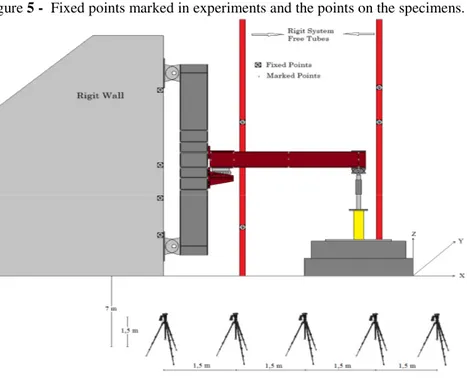
In order to conduct photogrammetric measurements, the coordinates of eight fixed points (control points) were determined prior to the experiment. Four fixed points were marked on the rigidwall, and the others four were marked on two systems of free rigid steel tubes. Therefore, these control points hadn’t been changed their location during the experiments.Then based on these fixed coordinates, the points of which deformations can be measured are marked (Figure 5).
The X, Y, and Z coordinates of these control points were repeatedly measured with an electronic distance measurement (EDM) instrument and their averages were calculated. The precision for the control points was mx= my= mz = ± 1 mm.
The photographs were analyzed by the photogrammetric method in PhotoModeler software. An adjustment process was provided in bundle adjustment method with the help of eight control points. Once the adjustment process was completed, 3D coordinates of the marked points were ascertained, and with the help of the 3D coordinates, the angles were calculated on the XZ plane.
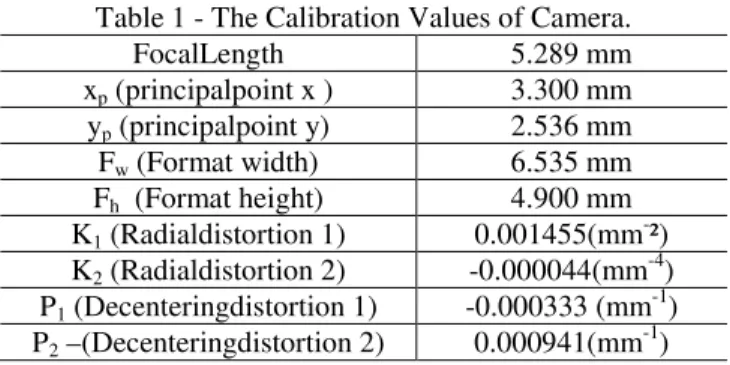
The digital camera was calibrated using PhotoModeler software. The calibration values were given in Table 1.
Table 1 - The Calibration Values of Camera.
FocalLength 5.289 mm
xp (principalpoint x ) 3.300 mm
yp (principalpoint y) 2.536 mm
Fw (Format width) 6.535 mm
Fh (Format height) 4.900 mm
K1 (Radialdistortion 1) 0.001455(mm-²)
K2 (Radialdistortion 2) -0.000044(mm-4)
P1 (Decenteringdistortion 1) -0.000333 (mm-1)
P2 –(Decenteringdistortion 2) 0.000941(mm-1)
Five pictures were taken from a distance of 7 meters for all cycles of all experiments. The camera was placed on a tripod, 1.5m above ground, in five positions, as given in Figure 5. Two to five images were used in the adjustment process. Root Mean Square Error (RMSE)was generally obtained within ± 1mm accuracy from the results of the adjustment process. Measured points were marked on figure 5.
2.5 Calculation of rotation values
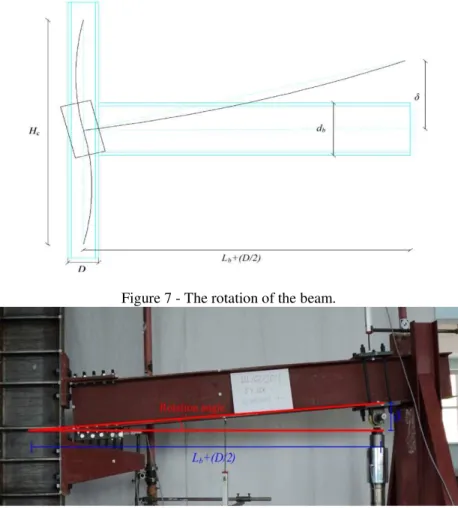
Rotation is the angular deformation due to increasing external loads in a connection or joint. Rotational capacity of a system is the maximum rotation (elastic + plastic) that can occur in that system. This can be called total rotation. Plastic rotation capacity is the maximum value of plastic rotation that a system can resist. Total rotation ( ) is calculated as the ratio of beam end displacement ( ) to the distance between beam end and column axis ( /2). A deformed beam-column connection can be seen in Figure 6. In Figure 6, is the distance between beam end, where the load is applied, and the flange of the column.
In the conducted experiments, total rotations were calculated using Equation 1. The displacement, which was read from the LVDT and labeled P1, was divided by the distance between the centerline of the column and load location on the beam to obtain total rotation for each experiment. The rotation of the beam can be clearly seen in Figure 7.
Figure 6 - Deformed shape of a beam-column connection.
Figure 7 - The rotation of the beam.
3. RESULTS
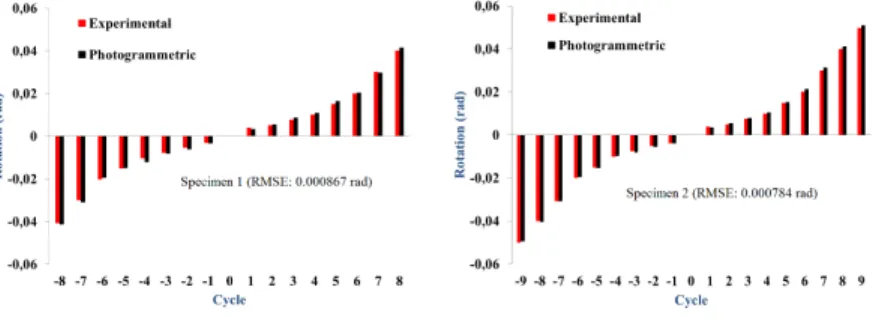
beam-column connection were conducted. Two separate methods were used to determine the displacements. Using these methods, the rotation values at the joint/connection of the specimens were obtained. Rotation values for every specimen calculated from each method are presented in Figure 8. Rotation values for Specimen 1 to Specimen 10 are given in Figure 8-a., Figure 8-b., Figure 8-c., Figure 8-d., Figure 8-e., Figure 8-f., Figure 8-g., Figure 8-h.,Figure 8-i., Figure 8-j. respectively.For all experiments rotation values were measured in all cycles and compared against the results obtained from the LVDTs. Results showed the differences obtained between the photogrammetric technique and results obtained from the LVDTs were not significant. Rotation values are evaluatedby usingsquare root of the mean squared error (RMSE).
The RMSE is calculated as square root of the mean squared error (ε);
ε=Xi-Xj; (2)
∑ (3)
whereXiis the rotation calculated by the help of photogrammetry, Xj is the rotation
calculated by the help of conventional methods and n is the number of the experiments here.
The RMSE values of rotation, which were obtained using each method, were calculated as 0.000867 rad, 0.000784 rad, 0.000864 rad, 0.000958 rad, 0.000677 rad, 0.000922 rad, 0.000438 rad, 0.000965 rad, 0.000760 rad, and 0.000917 rad, respectively. As can be seen from the results, the minimum and maximum RMSE values were 0.000438 rad and 0.000965 rad, respectively.
The values shown in Figure 8-a, Figure 8-b, Figure 8-c, Figure 8-d, Figure 8-e, Figure 8-f, Figure 8-g, Figure 8-h, Figure 8-i, Figure 8-jwere calculated using Equation 1 for each specimen using both methods. The displacements measured by LVDTs, which were placed on the specimen prior to the experiment, were digitized and organized. These displacements were obtained for each loading. In addition to this, the same displacements were observed using the photogrammetric method. In the photogrammetric method, the photographs were taken using a digital camera, which was calibrated in every step of the experiment.It was observed that the angles of rotation, which were obtained from each method, were very close to each other. In the calculations, it was seen that the RMS values obtained from electronic LVDTs and photogrammetric measurement method have a range between 0.000438 rad and 0.000965 rad.These values clearly indicate small differences in measures of deflection.
In this study ten beam to column connections were investigated with both electronic LVDTs and photogrammetric measurent methods in the literature for the first time. For Specimen 1, Specimen 4, Specimen 9, sixteen cycles and for Specimen 2, Specimen 3, Specimen 5, Specimen 6, Specimen 7, Specimen 8 and Specimen 10eighteen cycles were measured with both electronic LVDTs and photogrammetric measurement method. So, (16*3) for Specimen 1, Specimen 4, Specimen 9 and (18*7)for Specimen 2, Specimen 3, Specimen 5, Specimen 6, Specimen 7, Specimen 8 and Specimen 10 totally 174 cycles were measured. The RMSE valuesfor all 174 measurements,small differenceprecision of rotation valuesshow thatphotogrammetricmethodology instead of electronic LVDTs.
When the two methods were compared, it was evident that the photogrammetric measurement method was quite simple (easy) and fast in comparison to using LVDTs. When using LVDTs for displacement measurement, it is mandatory to use 1-2 LVDT per desired displacement measurement. For this reason, in experiments where many displacement measurements are needed, the number of LVDTs that should be used is substantially high. This elongates the preparation period and sometimes it is impossible to place the LVDTs. On the contrary, in the photogrammetric measurement method, not only the connections but also the whole system is photographed, all of the displacements in the system can be determined easily. In the photogrammetric measurement method, since there are intrusive aspects such as marking and placing LVDTs, the behavior of the specimen can be fully observed and recorded.In conclusion, photogrammetric measurement method may prevent the limitations of LVDTs.
4. CONCLUSION
In this study, an attempt was made to obtain the displacements/rotations in ten beam-column connections that are subjected to reversible cyclic loads using both LVDTs and the photogrammetric measurement method.
displacements and rotations in the beam-column connections.The performanceof the photogrammetric measurement method was confirmed using data collected during all 174 cycling steps. The results were compared with two different methodologies, and they showed compatibleresults under 0.000965 rad RMSE. Using the proposed method instead of LVDTs eliminates expensive and laborious task of LVDT preparation and placing. Also no sensor will be damaged during the experiments. 3D measurements of all points will be measured by photogrammetric method unlike 1D measurement limitation of LVDTs. Moreover, limited range of measurement disadvantage will be prevented by this method. Finally, photogrammetric measurement method which offers the advantages of a multi-purpose, inexpensive and effective full field three dimensional measurement technique can be used in all conditions during the cycling tests instead of LVDTs.
5. REFERENCES
CEYLAN, A. ; M. Gümüş. Determination of Deformations as a Result of Seismic Loadings on Two-Dimensional Reinforced Concrete Frame via Terrestrial Laser Scanners. Experimental Techniques.DOI: 10.1111/j.1747-1567.2011.00789.x, 2011
CHEN, H. ; SHI, Y.J.; WANG Y.Q.; LI Z.F. Experimental research on beam-column connections under low-cycle loading. Proceedings of Sixth Pacific Structural Steel Conference, PSSC'01, Beijing, China; p. 787–92. 2001. CHEN, W.F.;LUI, E.M. Stability design of steel frames. 1st ed. Boca Raton: CRC
Press; 1991.
CHOUNTA I. AND IOANNIDIS C., High Accuracy Deformation Monitoring of a Concrete Beam using Automatic Photogrammetric Techniques, Knowing to manage the territory, protect the environment; Evaluate the Cultural Heritage, Rome, Italy, 6-10 May 2012
FEMA 351.Recommended seismic evaluation and upgrade criteria for existing welded steelmoment frame buildings. Washington (DC); 2000.
GARLOCK, M. M.; RICLES, J. M.; SAUSE, R. Cyclic load tests and analysis of bolted top and-seat angle connections. J StructEng, 129(12):1615–25., 2003 GORDON, S. ;LICHTI, D.,Terrestrial laser scanners with a narrow field of view:
the effect on 3D resection solutions. Survey Review, No. 37, 292, pp. 448 – 468.2004.
GORDON, S. And LICHTI, D. Modeling Terrestrial Laser Scanner Data for Precise Structural Deformation Measurement. J.Surv. Eng., 133(2), 72–80. 2007. KWAK, E.; DETCHEV, I.; HABIB, A.. EL-BADRY, M.; and HUGHES, C.
”Precise Photogrammetric Reconstruction Using Model-Based Image Fitting for 3D Beam Deformation Monitoring.” J. Surv. Eng., 139(3), 143–155. 2013. KRAUS, K. Photogrammetry. Volume 1, Ümmler, Bonn.1993
Conference on Advances in Steel Structures, ICASS'02, Hongkong, China, 1. Advances in Steel Structures; p. 213–20.2002.
LICHTI, D.; JAMTSHO, S.; EL-HALAWANY. S.; LAHAMY, H.; CHOW, J.; CHAN, T.; and EL-BADRY, M. Structural Deflection Measurement with a Range Camera. J. Surv. Eng., 138(2), 66–76. 2012.
MUSTAFFAR M.; SAARI R.; ABU BAKAR S.; MOGHADASI M.; MARSONO K. The Measurement Of Full Scale Structural Beam-Column Connection Deformation Using Digital Close Range Photogrammetry Technique, Malaysian Journal of Civil Engineering 24(2):148-160 (2012).
PACHOUMİS, D. T. ; GALOUSSİS, E. G.; KALFAS, C.N.;AFTHİMİOU, I.Z. Cyclic performance of steel moment-resisting connection swith reduced beam sections — experimental analysis and finite element model simulation. Engineering Structures 32(9): 2683-2692.2010.
QI, X.; and D. LICHTI. Monitoring dynamic concrete beam deformation with range cameras. In FIG Working Week 2012, Knowing to Manage the Territory, Protect the Environment, Evaluate the Cultural Heritage, Rome, Italy, pp. 1-13, 2012.
SHI, Y.J.; SHI, G.; WANG,Y. Q. Experimental and theoretical analysis of the moment rotation behaviour of stiffened extended end-plate connections. J Constr Steel Res ;63:1279–93.2007
TSAI, K. C.; WU, S.; POPOV, E. P. Experimental performance of seismic steel beam-column moment joints. J Struct Eng;121:925–31.1995
VALENCA, J.; JÚLIO, E. .N. B. S.; ARAUJO, H. J. et al. Applications of Photogrammetry to Structural Assessment. Experimental Techniques,36(5), pp.71-81, 2012
YARDIMCI, N.; YORGUN, C.; ARDA, T. S. Test on beam–column strong and weak axis connections. Comput. Struct.;61(3):393–9.1996
YORGUN, C.; BAYRAMOGLU, G. Cyclic tests for welded-plate sections with end-plate connections. J Constr Steel Res;57:1309–20.2001