ACPD
9, 4769–4804, 2009NO2 DOAS
measurements at Tenango del Aire
M. L. Melamed et al.
Title Page
Abstract Introduction
Conclusions References
Tables Figures
◭ ◮
◭ ◮
Back Close
Full Screen / Esc
Printer-friendly Version
Interactive Discussion
Atmos. Chem. Phys. Discuss., 9, 4769–4804, 2009 www.atmos-chem-phys-discuss.net/9/4769/2009/ © Author(s) 2009. This work is distributed under the Creative Commons Attribution 3.0 License.
Atmospheric Chemistry and Physics Discussions
This discussion paper is/has been under review for the journalAtmospheric Chemistry and Physics (ACP). Please refer to the corresponding final paper inACPif available.
Detection of pollution transport events
southeast of Mexico City using
ground-based visible spectroscopy
measurements of nitrogen dioxide
M. L. Melamed1, R. Basaldud1, R. Steinbrecher2, S. Emeis2, L. G. Ru´ız-Su ´arez1,
and M. Grutter1,*
1
Centro de Ciencias de la Atm ´osfera, Univ. Nacional Aut ´onoma de M ´exico, M ´exico D.F., M ´exico
2
Institute for Meteorology and Climate Research, Atmospheric Environmental Research (IMK-IFU), Forschungszentrum Karlsruhe GmbH, Garmisch-Partenkirchen, Germany
*
now at: Institut f ¨ur Meteorologie und Klimaforschung, Karlsruhe, Germany
Received: 19 December 2008 – Accepted: 12 January 2009 – Published: 24 February 2009 Correspondence to: M. L. Melamed (megan.melamed@gmail.com)
ACPD
9, 4769–4804, 2009NO2 DOAS
measurements at Tenango del Aire
M. L. Melamed et al.
Title Page
Abstract Introduction
Conclusions References
Tables Figures
◭ ◮
◭ ◮
Back Close
Full Screen / Esc
Printer-friendly Version
Interactive Discussion
Abstract
This work presents ground based differential optical absorption spectroscopy (DOAS) measurements of nitrogen dioxide (NO2) during the MILAGRO field campaign in March
2006 at the Tenango del Aire research site located to the southeast of Mexico City. The DOAS NO2 column density measurements are used in conjunction with ceilometer,
5
meteorological and surface nitrogen oxides (NOx) and total reactive nitrogen (NOy)
measurements to show a more comprehensive view of air pollution results when a research site has both surface and remote sensing instruments. An in depth analysis of 13 March 2006 demonstrates how DOAS NO2, surface NO2and ceilometer data can
be used to determine the extent of mixing of the pollution layer. In addition, we show the 10
effectiveness of how DOAS measurements can be used to observe pollution sources that may reside above the mixing layer, such as the presence of lightning produced NO2as seen on 28 March 2006.
1 Introduction
Megacities (cities with a population greater than 10 million) play a critical role in local, 15
regional and global air pollution. One megacity of primary interest is Mexico City, the world’s second largest city with an estimated population of 22 million within an area of 7500 km2. Mexico City is located in the sub-tropics at 19◦N and 99◦W at 2240 m a.s.l. in a flat basin surrounded by mountains on three sides. The primary sources of pollu-tion in Mexico City are transportapollu-tion, industrial processes and domestic related activ-20
ities. The high-density population, the unique geographical setting and multiple emis-sion sources lead to high pollution episodes on a regular basis in Mexico City. These episodes have serious immediate and longer-term impacts on human health and the environment.
Recent research has begun to unravel the complexity of the air pollution problem in 25
ACPD
9, 4769–4804, 2009NO2 DOAS
measurements at Tenango del Aire
M. L. Melamed et al.
Title Page
Abstract Introduction
Conclusions References
Tables Figures
◭ ◮
◭ ◮
Back Close
Full Screen / Esc
Printer-friendly Version
Interactive Discussion
as well. Since 1986, an automated network for atmospheric monitoring in Mexico City (Red Automatica de Monitoreo Ambiental or RAMA) has been measuring sur-face mixing ratios of ozone (O3), nitrogen oxides (NOx), carbon monoxide (CO), sulfur
dioxide (SO2) and particulate matter (PM10) (http://www.sma.df.gob.mx/simat). Me-teorological data has been available since 1948 from the National Meteorology Ser-5
vice (http://smn2.cna.gob.mx). In addition to these continuous measurements, several large-scale, intensive field campaigns have augmented the data-base of air pollution and meteorological profiles. These include the Mexico City Air Quality Initiative (MARI 1990–1993), the Investigaci ´on sobre Materia Particulada y Deterioro Atmosferico-Aerosol and Visibility Research (IMADA-AVER 1997) and the Mexico City Metropoli-10
tan Area (MCMA 2003) experiment (Molina and Molina, 2002). In response to previ-ous studies the Megacity Initiative: Local and Global Research Observations (MILA-GRO 2006) campaign took place during March of 2006. The goal of MILA(MILA-GRO 2006 was to use a team of international researchers to conduct measurements of gas phase and aerosol air pollutants in the Mexico City metropolitan area in order to study the 15
transport and transformation of the measured air pollutants on local, regional and global scales (http://www.eol.ucar.edu/projects/milagro/).
The MILAGRO 2006 campaign had three primary surface research sites (T0, T1 and T2) to study the transport of pollution from the city center to the northeast. To date, many articles have been published from these three surface research sites (Doran 20
et al., 2007; DeCarlo et al., 2008; Moffet et al., 2008; Querol et al., 2008; Stone et al., 2008; Thornhill et al., 2008; Hennigan et al., 2008, and references therein). Another research site located to the southeast of the city representing a background site was Tenango del Aire located at 19◦09′18′′N and 98◦51′50′′W at 2377 m. Figure 1 shows the location of the T0, T1, T2 and Tenango del Aire research sites. Tenango del Aire re-25
ACPD
9, 4769–4804, 2009NO2 DOAS
measurements at Tenango del Aire
M. L. Melamed et al.
Title Page
Abstract Introduction
Conclusions References
Tables Figures
◭ ◮
◭ ◮
Back Close
Full Screen / Esc
Printer-friendly Version
Interactive Discussion
(DOAS) nitrogen dioxide (NO2) column density measurements and show a more com-prehensive analysis of urban air pollution results when a measurement site has both surface and remote sensing instruments.
2 Instrumentation and data anaylsis
The Tenango del Aire research site included DOAS measurements of NO2, a ceilome-5
ter to determine the mixing layer height (MLH), surface meaurements of nitrous oxide (NO), nitrogen oxides (NOx), reactive nitrogen (NOy) and surface meteorological data
(temperature, humidity, wind direction and wind speed).
2.1 DOAS instrumentation and method
Scattered sunlight in the zenith view direction was collected with a small-sized tele-10
scope connected to a 600µm diameter optical fiber. The optical fiber feeds the col-lected zenith sky sunlight to an Ocean Optics S2000 Miniature Fiber Optic Spectrom-eter with a TR-2 Thermoelectric Temperature Regulator. The S2000 is a commercially purchased crossed Czerny-Turner fixed grating spectrometer with a one-dimensional (2048 pixel) charged coupled device (CCD) array, a 1200 line mm−1 grating and a 15
50µm entrance slit width resulting in an optical resolution of 1.07 nm
full-width-half-maximum (FWHM) over the wavelength range from 418 to 731 nm. The integration time for zenith sky spectra was optimized to get a maximum signal under all conditions. The visible zenith sky spectra are analyzed using the differential optical absorption spectroscopy (DOAS) method that has been extensively discussed by Platt (1994), 20
Sanders (1996), Marquard et al. (2000). The DOAS method uses a Beer-Lambert type of equation to describe the attenuation of radiation by molecular absorbers between a foreground and background spectrum,
IF G(λ)
IBG(λ) =P(λ)exp − m
X
i=0
Sm′ σm′ (λ)
!
ACPD
9, 4769–4804, 2009NO2 DOAS
measurements at Tenango del Aire
M. L. Melamed et al.
Title Page
Abstract Introduction
Conclusions References
Tables Figures
◭ ◮
◭ ◮
Back Close
Full Screen / Esc
Printer-friendly Version
Interactive Discussion
whereIF G(λ) is the foreground spectrum andIBG(λ) is the background spectrum. The background spectrum is a noon-time spectrum measured in clear skies and is char-acterized by the column densities of the absorbers in the non-polluted atmosphere. The foreground spectrum is a measured spectrum taken at a different time than the background spectrum. The polynomial, P(λ), is used to describe the broad molec-5
ular absorption features and Rayleigh, aerosol and cloud scattering. The difference in molecular absorption between the foreground and background spectra is given by the sum of the differential molecular absorption cross sections of the species, σm′ (λ), times their differential slant column densities (DSCD),Sm′ . To approximately account for the wavelength smoothing performed by the instrument, the molecular absorption 10
cross sections are convolved by the slit function of the spectrometer used to measure the foreground and background spectra. It is important to note that since the back-ground spectrum is taken from the back-ground and is not an extra-atmospheric spectrum of the sun,Sm′ , is the difference in the slant column density of the absorber of interest betweenIF G(λ) amdIBG(λ) and is not an absolute column measurement.
15
A critical step in the DOAS method is converting the DSCD to a vertical column density (VCD) by applying an appropriate air mass factor (AMF) that accounts for the increased optical path length through the atmosphere of the foreground spectrum rel-ative to the vertical optical path length (Perliski and Solomon, 1993). To first approxi-mation, the AMF of NO2column density measurements for solar zenith angles (SZA) 20
less than∼80◦ is the secant of the SZA (Solomon et al., 1987). To determine the AMF for large SZA or for photons that are scattered multiple times due to the presence of clouds and aerosols often requires radiative transfer models. However, the retrieval of the oxygen collision complex (O4) can provide important information in regards to
the optical path length of the photons that have been scattered multiple times. The 25
atmospheric O4 mixing ratio is proportional to the square of the oxygen (O2) mixing ratio and any non-pressure-related change in the absorption of visible light due to O4is
ACPD
9, 4769–4804, 2009NO2 DOAS
measurements at Tenango del Aire
M. L. Melamed et al.
Title Page
Abstract Introduction
Conclusions References
Tables Figures
◭ ◮
◭ ◮
Back Close
Full Screen / Esc
Printer-friendly Version
Interactive Discussion
Platt, 1979; Greenblatt et al., 1990). It is important to note that since O4 is an O2−O2
collision complex, the O4absorption cross section has the units cm5molecules−2
. The O4“column densities” will be expressed with respect to the quadratic O2concentration
in the units molecules2cm−5. Since these units are not traditional units for a molecular absorption cross section nor a column density, the O4 quantities will use the symbol 5
DSCD∗throughout the text to denote this specialty.
In this study, the retrieved NO2DSCDs are converted to VCDs by applying an AMF
of the secant of the SZA to account for the increase in absorption by NO2 due to an enhanced optical path length through the stratospheric NO2layer at large SZA, Fig. 4.
The resulting NO2VCD represents the enhancement in the NO2VCD due to pollution
10
related events or increases in the optical path length due to multiple scattering by clouds and aerosols. The O4DSCD∗ are then used to give insight into the source and
cause of the NO2 VCD enhancements. This is done by calculating an AMF for O4
according to Melamed et al. (2008), where the O4AMF,AO
4, is defined as
AO
4 =
S′O∗
4+S
∗
BG,O4
V∗
O4
, (2)
15
whereS′∗
O4 is the retrieved O4DSCD∗, S∗BG,O4 is the calculated O4 SCD∗ in the
back-ground spectrum andV∗O
4 is the calculated O4VCD
∗at the Tenango del Aire research
site. If the vertical distribution of NO2and O4were identical then the O4AMF could be
applied to the retrieved NO2DSCDs. However, since the vertical profiles of NO2 and O4 differ, the O4 AMF is used in this study to qualitatively restrain the interpretation of
20
the enhancements of the NO2VCDs.
NO2 DSCDs are retrieved in the visible spectral window of 407–505 nm. In addi-tion to NO2, the other atmospheric absorbers included in the retrieval are O3and O4.
The high-resolution laboratory absorption cross section for O3 at 223 K (Voigt et al.,
2001), O4 at 296 K (Greenblatt et al., 1990) and NO2 at 293 K (Voigt et al., 2002) are
25
ACPD
9, 4769–4804, 2009NO2 DOAS
measurements at Tenango del Aire
M. L. Melamed et al.
Title Page
Abstract Introduction
Conclusions References
Tables Figures
◭ ◮
◭ ◮
Back Close
Full Screen / Esc
Printer-friendly Version
Interactive Discussion
Ring cross section derived according to Melamed et al. (2008) from the Kurucz et al. (1984) solar spectrum. A “shift and stretch” is applied to the foreground spectrum to align it in wavelength with the laboratory cross sections. The broad absorption and attenuation features are accounted for by including a second order polynomial. The DOAS shift, stretch, polynomial coefficients and DSCDs are solved for using the 5
Levenberg-Marguardt nonlinear least squares fitting algorithm (Lavenberg, 1944; Mar-quardt, 1963). The same background spectrum was used for the entire campaign and was taken on 18 March 2006 at 12:43 p.m. CDT when the SZA was the lowest for the entire day at 20◦. This background spectrum was chosen because it was taken under clear skies at a low SZA and when the surface NO2mixing ratio was small, 1.5 ppb. An
10
example NO2DOAS retrieval is shown in Fig. 2. The estimated error in the NO2DOAS retrievals are±1.50×10¹⁵molecules cm−2.
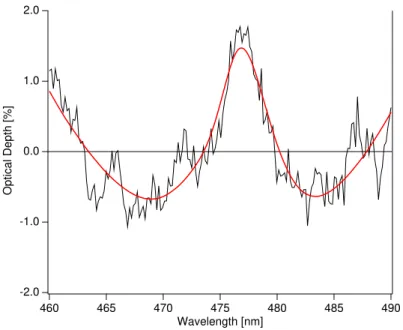
The O4 DSCD∗s are retrieved in a similar wavelength region as the NO2 retrievals
since photons in different wavelength regions can exhibit different optical path lengths, (Solomon et al., 1987; Platt et al., 1997). The O4 DSCD∗s are retrieved in the 460–
15
490 nm wavelength region. The O4retrievals include the following: a “shift and stretch”,
a second order polynomial and the Ring, NO2and O3cross sections used in the NO2 retrievals. The same background spectrum that was used in the NO2DOAS retrievals
is used for the O4 retrievals. An example O4 DOAS retrieval is shown in Fig. 3. The
estimated error in the O4DOAS retrievals is±1.06×10 42
molecules2cm−5. 20
2.2 Ceilometer instrument and analysis
The ceilometer is a Vaisala double-lens ceilometer (M ¨unkel et al., 2004). It measures the optical attenuated backscatter intensity at 0.855µm averaged over 15 s. This spe-cial wavelength has been chosen because the absorption by water vapor is much lower here than at 0.910µm; a wavelength for which laser diodes are easily available. 25
ACPD
9, 4769–4804, 2009NO2 DOAS
measurements at Tenango del Aire
M. L. Melamed et al.
Title Page
Abstract Introduction
Conclusions References
Tables Figures
◭ ◮
◭ ◮
Back Close
Full Screen / Esc
Printer-friendly Version
Interactive Discussion
is 7.5 m. Apart from the very strong backscatter from clouds (that is what the instrument had originally been designed for) and fog, weaker gradients in the backscatter intensity are mainly determined by the number and the size spectrum of aerosol particles float-ing in the air. Reliable analysis of the vertical profile of particle-induced backscatter can be made from heights above∼140 m. Below that height the overlap between the 5
emitted beam and the field-of-view of the receiver is smaller than 30%. The overlap is zero for heights below 60 m. Any signal received from distances below 60 m is gen-erated by multiple scattering and scattering of light at dust and dirt particles on the weather protection glass of the transmitter into the field-of-view of the receiver. A slight contamination of the glass thus results in a signal amplitude decrease for distances 10
above 60 m, but a signal amplitude increase for distances below 60 m (Emeis et al., 2007).
The MLH is retrieved using a refined approach of the retrieval by Sch ¨afer et al. (2004), which is described in detail by Emeis et al. (2007). This retrieval algorithm is based on an analysis of the minima of the vertical gradients of the aerosol backscatter 15
intensity (i.e. the greatest decreases in the backscatter intensity with height) recorded by the ceilometer.
Prior to the determination of gradient minima the overlap and range corrected atten-uated backscatter profiles have to be averaged over time and height to suppress noise generated artefacts. Between 140 m and 500 m height sliding averaging is done over 20
15 min and a height interval∆hof 80 m. In the layer between 500 and 2000 m ∆hfor vertical averaging is extended to 160 m. Two additional parameters have been intro-duced to further reduce the number of false hits. The minimum accepted attenuated backscatter intensity right below a lifted inversion is set to 200×10−9m−1sr−1 in the lower layer and 250×10−9m−1sr−1 in the upper layer. Additionally the vertical gradi-25
ent value of a lifted inversion must be more negative than−0.30×10⁻⁹m−1sr−1in the lower layer and more negative than−0.30×10⁻⁹m−1sr−1in the upper layer.
IfB(z) denotes the measured attenuated backscatter intensity in the heightzabove
ACPD
9, 4769–4804, 2009NO2 DOAS
measurements at Tenango del Aire
M. L. Melamed et al.
Title Page
Abstract Introduction
Conclusions References
Tables Figures
◭ ◮
◭ ◮
Back Close
Full Screen / Esc
Printer-friendly Version
Interactive Discussion
a gradient minimum is characterized by a change of sign from minus to plus of the second derivative of B(z). The height interval under examination is searched from bottom to top for these gradient minima. There is a gradient minimum in the heightz if the second derivative ofB(z) one range gate below z is not positive, if the second derivative of B(z) in the heightz is positive and if the false hit conditions mentioned 5
above are fulfilled. The MLH from optical remote sensing is taken as the lowest height found by this procedure.
The retrieval algorithm for MLH fails in case of strong mist and fog and especially during rainfall because then the backscatter intensity is determined by the water or rain droplets only.
10
2.3 Surface mixing ratio measurements
NOx, NO and NOy surface concentrations were measured using a TEI 42C chemiluinescence monitor (Thermo Fisher Scientific Inc, 81 Wyman Street, Waltham, MA 02454) with several monitoring ranges spanning from 0–5 ppb and from 0–200 ppb with a linearity of +/−1% of full scale reading. The lower detectable concentration 15
is 50 ppt. When in NOy mode, an additional Mo catalitic converter is used on top of
the mobile unit and a short PFA Teflon inlet was used to mimize wall losses of nitric acid, HNO3 (McClenny, 2000). All oxidized nitrogen species are converted to NO and measured as such in the TEI 42C instrument.
In the following analysis, the surface NO2 mixing ratio is calculated from the NOx
20
and NO measurements ([NO2]=[NOx]-[NO]). On 21 March the NOx and NO surface instrument switched to measuring NOy and therefore the surface mixing ratio of NO2
ACPD
9, 4769–4804, 2009NO2 DOAS
measurements at Tenango del Aire
M. L. Melamed et al.
Title Page
Abstract Introduction
Conclusions References
Tables Figures
◭ ◮
◭ ◮
Back Close
Full Screen / Esc
Printer-friendly Version
Interactive Discussion
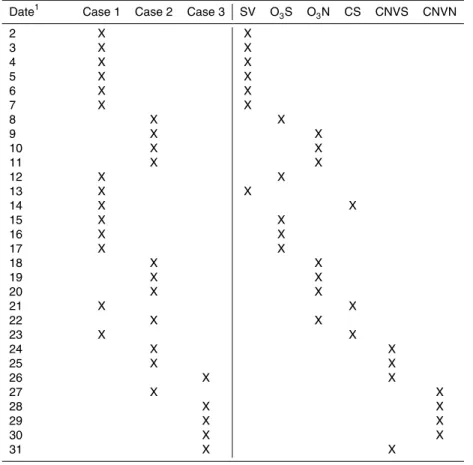
3 Results and discussion
The Tengango del Aire data set is divided into three case studies based on surface wind direction, surface NO2 and NOy concentrations and DOAS NO2 VCD measurements
as shown in Table 1. The three different cases are compared with the basin-scale wind analysis conducted by de Foy et al. (2008).
5
Case 1 days are dominated by northerly winds during the morning. Since the re-search site is located to the southeast of the city center, the surface mixing ratio and DOAS measurements detect various pollution plumes being transported through the research site when northerly winds exist. On the majority of the Case 1 days, the wind direction shifts mid- to late-afternoon from northerly to southerly. According the basin-10
scale wind transport analysis conducted by de Foy et al. (2008), the Case 1 days are classified as South Venting (SV), O3-South (O3S), or Cold Surge (CS) episodes. SV,
O3S and CS days were all dominated by northerly winds.
Case 2 days are all dominated by southerly winds. The surface mixing ratio and DOAS NO2 measurements do not detect any significant increase in NO2 throughout
15
these days as the air to the south of the Tenango del Aire research site is relatively clean. The majority of Case 2 days are classified as O3-North (O3N) episodes, which
are dominated by southerly winds throughout the entire day (de Foy et al., 2008). Case 3 days exhibit mainly southerly winds but the wind direction tends to be more variable throughout the day compared to the Case 1 and Case 2 days. In the mornings, 20
the surface mixing ratio and DOAS NO2 measurements do not detect any significant
increase in air pollution. However, in the afternoon, the DOAS measurements indicate large enhancements in the NO2VCD while the surface NO, NOxand NOymixing ratios
show no corresponding increase. Case 3 days are classified as “convection-north” (CNVN) or “convection-south” (CNVS) episodes that are characterized by mostly clear 25
skies in the morning, followed by afternoon showers and exhibited either a stronger north or south transport in the afternoon (de Foy et al., 2008).
ACPD
9, 4769–4804, 2009NO2 DOAS
measurements at Tenango del Aire
M. L. Melamed et al.
Title Page
Abstract Introduction
Conclusions References
Tables Figures
◭ ◮
◭ ◮
Back Close
Full Screen / Esc
Printer-friendly Version
Interactive Discussion
and the importance of having both surface mixing ratio and remote sensing measure-ments at urban air pollution research sites in order to gain a more comprehensive understanding of air pollution is discussed. DOAS measurements are dependent on sufficient sunlight in order to make mesurements. Therefore, the following days are analyzed from 07:45 to 17:45 local time (CDT) for SZA<80◦.
5
3.1 Case 1 – 13 March 2006
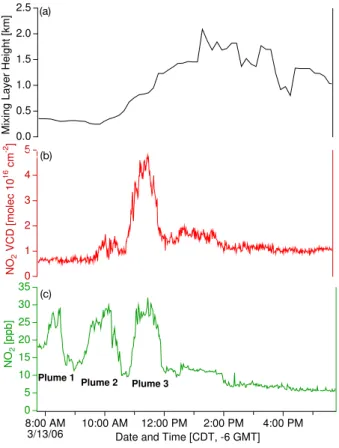
A typical Case 1 day is 13 March 2006. On this day, northerly surface winds persisted at Tenango del Aire between 08:00 and 14:00 CDT. At 14:00, the wind direction shifts to southerly, Fig. 5. During the six hour period of northerly winds, the surface NO2 measurements indicate three distinct plumes transported through the research site, 10
Fig. 6. At 14:00 when the wind direction changes to southerly, the surface NO2mixing
ratio decreases and the humidity increases as relatively clean air from the south is transported through the Tenango del Aire research site.
The first NO2 Plume occurred early in the morning from 07:43 to 08:42 CDT and
had a maximum surface NO2 mixing ratio of 29 ppb. The mixing layer height (MLH) is 15
low during this Plume with an average height of 312±7 m. As can be seen in the NO2
surface mixing ratio measurements, Plume 1 has two distinct peaks. The first peak occurs when the wind direction changed from southerly to northerly. The average wind speed during the first peak is less than 1 m s−1. During the second peak of Plume 1, the wind direction is from the north, northeast and the wind speed increases from 20
0.2 m s−1to 2.2 m s−1. Due to the shift in the wind direction, it is likely that peak two of Plume 1 is actually the same air mass being transported through the research site for a second time due to the change in the wind direction. The width of the second peak should therefore be narrower than the width of the first peak since the wind speed was significantly higher during the second peak. Figure 6 indicates that the second peak is 25
indeed narrower than the first peak. The DOAS NO2 measurements do not detect the
ACPD
9, 4769–4804, 2009NO2 DOAS
measurements at Tenango del Aire
M. L. Melamed et al.
Title Page
Abstract Introduction
Conclusions References
Tables Figures
◭ ◮
◭ ◮
Back Close
Full Screen / Esc
Printer-friendly Version
Interactive Discussion
A second Plume from the north was transported through the Tenango del Air re-search site from 09:13 to 10:34 CDT. The average wind direction during Plume 2 was 12±8◦ and the average wind speed was 3.3±0.8 m s−1. The maximum surface NO2
mixing ratio was 30 ppb. The MLH begins to develop during Plume 2 increasing from 300 m to 500 m. Plume 2 is detected in the DOAS measurements due to an increase 5
of NO2molecules in the atmosphere. As can be seen in Fig. 6, the NO2VCD reaches
a maximum of 2.0×10¹⁶molecules cm−2.
A third NO2 plume is transported through the Tenango del Aire research site from 10:45 to 11:58 CDT. The average wind direction during Plume 3 was still out of the north at 4±18◦ and the average wind speed was 3.8±1.0 m s−1. During the passage 10
of Plume 3, the MLH continued to increase to 1200 m and the maximum surface NO2 mixing ratio was 32 ppb. Although the maximum surface NO2 mixing ratio of Plume 3
is only slightly greater than the maximum surface NO2 mixing ratio in Plume 2, the
DOAS NO2 VCD is much greater than the DOAS NO2 VCD in Plume 2 with a maxi-mum column density of 4.8×10¹⁶molecules cm−2. The column density measurements 15
provide the total burden of the molecules in the atmosphere. Therefore the DOAS NO2
VCD should increase between Plumes 2 and 3 as the number of NO2 molecules in
the atmosphere increases due to increased emissions from morning traffic. The sur-face NO2mixing ratio stayed more or less equal because the total number of the NO2
molecules occupied more space due to the increase in MLH between Plumes 2 and 3. 20
This highlights the difference between surface and column density measurement and the importance of having both measurement techniques at an urban research site.
After Plume 3, a smaller enhancement in the surface NO2 mixing ratio and DOAS
VCD measurements was observed. At 14:00 CDT when southerly winds dominated, both the surface mixing ratio and the column density of NO2 decreased as relatively
25
clean air was transported to the research site from the south. The winds were southerly for the rest of the day and no enhancements in the surface nor the DOAS NO2 mea-surements were detected. The surface NO2 mixing ratios indicate a background level
ACPD
9, 4769–4804, 2009NO2 DOAS
measurements at Tenango del Aire
M. L. Melamed et al.
Title Page
Abstract Introduction
Conclusions References
Tables Figures
◭ ◮
◭ ◮
Back Close
Full Screen / Esc
Printer-friendly Version
Interactive Discussion
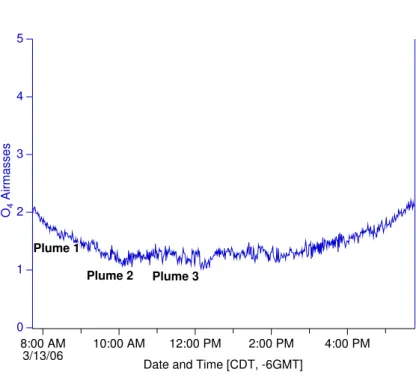
The O4 AMF did not significantly increase during Plume 2 nor Plume 3 indicating the enhancements seen in the DOAS NO2 VCD are due to an increase in pollution
rather than an increased optical path length caused by multiple scattering by aerosols or clouds, Fig. 7. This conclusion is supported by the following comparison between the DOAS NO2VCDs and the surface NO2mixing ratio measurements.
5
Using the MLH from the ceilometer data, the DOAS NO2VCD can be used to
esti-mate a mixing ratio assuming vertical homogeneity within the layer,
NO2(ppb)=
NO2VCD∗1e9
¯
AZB , (3)
where NO2VCD is the measured DOAS NO2VCD in molecules cm−2, ¯Ais the average number of air molecules in the ML in molecules cm−3 andZ
B is the MLH in m. If the 10
ML is well mixed and the DOAS NO2 VCD enhancement is located within the well
mixed ML, then the calculated DOAS NO2mixing ratio should equal the surface NO2
mixing ratio. Using Eq. (3), the DOAS NO2 VCD are converted to a mixing ratio for Plumes 2 and 3. Figure 8 shows the measured surface and the calculated NO2mixing
ratios agree well thus indicating that the ML is well mixed and the DOAS NO2 VCD
15
enhancement is due to an increase in pollution in the ML and not an increase in the optical path length of the photons.
3.2 Case 2 – 18 March 2006
18 March 2006 represents a Case 2 day, which were dominated by southerly winds and no significant enhancements in surface mixing ratio nor DOAS column densities 20
of NO2 were observed. On this day at the Tenango del Aire research site, the
ACPD
9, 4769–4804, 2009NO2 DOAS
measurements at Tenango del Aire
M. L. Melamed et al.
Title Page
Abstract Introduction
Conclusions References
Tables Figures
◭ ◮
◭ ◮
Back Close
Full Screen / Esc
Printer-friendly Version
Interactive Discussion
this conclusion indicating the average surface NO2mixing ratio for the entire days was 2.88±1.93 ppb and never reached above 12 ppb. Between 07:45 and 09:45 CDT two small plumes can be identified in the surface NO2 measurements. These low lying
plumes are likely aged plumes either from Mexico City or from other urban areas to the south or southwest being transported through the Tenango del Aire research site as 5
the wind direction shifted. In addition, throughout the day the surface measurements show narrow NO2enhancements. The source of the NO2in these peaks is most likely local and would not create any change in the DOAS NO2 VCD. Therefore, the DOAS
NO2VCD measurements show no enhancements throughout the entire day.
3.3 Case 3 – 28 March 2006 10
Case 3 days are classified by de Foy et al. (2008) as either CNVN or CNVS days, depending on the stronger component of transport in the late afternoon. These days occurred after humid conditions from a cold surge on 23 March 2006 persisted, leading to afternoon convection and rainfall (de Foy et al., 2008). Based on the meteorological data and the surface NOymeasurements, a Case 3 day appears to be very similar to a
15
Case 2 day in that the dominate wind direction is from the south and no major enhance-ments were observed in the surface NOy measurements. The large difference is that on all Case 3 days significant enhancements in the NO2DOAS VCD were observed in the afternoon that were not detected by the surface measurements.
An example Case 3 day is 28 March 2006, a CNVS day. On this day the average 20
wind direction was from the southwest at 212±43◦ and the average wind speed was 3.2±1.3 m s−1, Fig. 11. The surface NOy mixing ratio measurements show no
signif-icant plumes throughout the day except for a low layer passing through the research site in the morning that coincides with the change in the wind direction in the morning from northerly to southerly, which was also observed on 13 and 18 March Fig. 12. Two 25
enhancements in the DOAS NO2 VCD were detected in the afternoon, a large one
ACPD
9, 4769–4804, 2009NO2 DOAS
measurements at Tenango del Aire
M. L. Melamed et al.
Title Page
Abstract Introduction
Conclusions References
Tables Figures
◭ ◮
◭ ◮
Back Close
Full Screen / Esc
Printer-friendly Version
Interactive Discussion
The following analysis will show that the NO2enhancements were likely due to a com-bination of an increased optical path length from multiple scattering within a cloud and an enhancement in NO2due to lightning produced NO.
Figure 13 shows the DOAS O4AMF for 28 March 2006. A large enhancement in the O4AMF and hence the optical photon path length was detected starting at 12:50 CDT
5
and continuing until 14:50 CDT. In addition to an increased O4 AMF, the intensity of
the photons reaching the spectrometer decreases, indicating that the large enhance-ment in the optical path length is due to multiple scattering within thick clouds passing over the Tenango del Aire research site. The ceilometer data supports this conclusion detecting a cloud present above the Tenango del Aire research site from about 13:00 10
to 14:00 CDT and another cloud from 14:00 to 15:00 CDT, Fig. 14. The cloud height between 13:00 and 14:00 CDT was ∼200 m a.g.l. and the height of the precipitating cloud between 14:00 and 15:00 CDT was∼500 m a.g.l. The algorithm for the retrieval of the the MLH fails during periods of rainfall, which are indicated by the pink circles in Fig. 14. Therefore, the MLH curve in Fig. 12 is not indicated past 12:30 CDT due to the 15
presence of rain droplets.
The increase in the O4 AMF during the first cloud was from 1.0 to 4.5 air masses. This increase in the O4AMF due to multiple scattering within the cloud accounts for the
majority of the increase in the DOAS NO2VCD, but not all of it. A portion of the DOAS
NO2 VCD enhancement is therefore due to an actual increase in the column density 20
of NO2 due to lightning produced NO or an uptake of NO2 into convective clouds from
their surroundings, (Pickering et al., 1992; Solomon et al., 1999; Langford et al., 2004, and references therein). Lightning was detected in the vicinity of the Tenango del Aire research site on the afternoon of 28 March by the World Wide Lightning Location Network (WWLLN) suggesting that the NO2within the cloud could be due to lightning
25
ACPD
9, 4769–4804, 2009NO2 DOAS
measurements at Tenango del Aire
M. L. Melamed et al.
Title Page
Abstract Introduction
Conclusions References
Tables Figures
◭ ◮
◭ ◮
Back Close
Full Screen / Esc
Printer-friendly Version
Interactive Discussion
4 Conclusions
DOAS NO2VCD measurements were made during March 2006 as part of the
MILA-GRO field campaign at the Tenango del Aire research site located to the southeast of Mexico City. Based on the DOAS NO2 VCD measurements, in conjunction with
sur-face meteorological and NO, NOx and NOy mixing ratio measurements, the data set
5
was divided into three case studies. Case 1 days are characterized by northerly winds for the majority of the day, which transports several plumes from the north through the Tenango del Aire research site that are detected by both DOAS and surface NO2
mea-surements. Case 2 days are characterized by southerly winds for the entire day. The air to the south is relatively clean and no major enhancements in the DOAS nor the surface 10
NO2 measurements are observed. Case 3 days appear to be very similar to Case 2
days in that the dominate wind direction was southerly and no major enhancements in the surface NOy measurements were observed. However, during the afternoon on Case 3 days, the DOAS NO2measurements detect large NO2enhancements that are
not observed in the surface NOymeasurements.
15
The combination of surface monitors and DOAS column density measurements, in conjunction with ceilometer and meteorological data, give the possibility to differentiate between localized and aged plumes, provide important information about the extent of mixing in the pollution layer and detected NO2 enhancements above the MLH. The analysis of a Case 1 day, 13 March 2006, highlights the difference between DOAS 20
column measurements and surface mixing ratio measurements. DOAS column density measurements observe the total burden of molecules in the atmosphere while surface mixing ratio measurements provide a localized concentration. Therefore, as shown in the analysis of 13 March 2006, surface mixing ratios across a variety of plumes can remain constant even though the DOAS column density measurements detect large 25
changes in the total burden of NO2molecules in the atmosphere.
ACPD
9, 4769–4804, 2009NO2 DOAS
measurements at Tenango del Aire
M. L. Melamed et al.
Title Page
Abstract Introduction
Conclusions References
Tables Figures
◭ ◮
◭ ◮
Back Close
Full Screen / Esc
Printer-friendly Version
Interactive Discussion
the estimated DOAS mixing ratio if NO2is vertically homogeneous within the ML. This concept was tested using the DOAS NO2 column density measurements on 13 March
2006. The analysis shows the NO2 molecules in two plumes transported through the
Tenango del Aire research site were well mixed.
The analysis of Case 3 days demonstrates the ability of DOAS measurements to 5
determine the influence of pollution sources in the Mexico City basin that may reside above the ML. In addition to NO2 produced from NO formed by lightning, other pollu-tion sources that may reside above the ML are biomass burning and volcanic emission. Yokelson et al. (2007) suggests as much as 25% of NOxemissions in the Mexico City
area during March 2006 were produced from mountain fires but much of these emis-10
sions could pass above surface monitors and not be detected. Raga et al. (1999) showed that sulfur dioxide emissions from the volcano Popocat ´epetl have a large influ-ence on particulate sulfate matter in Mexico City but this influinflu-ence is often not noticed until the following day when the volcanic SO2emissions have been mixed into the ML. DOAS measurements of NO2 and SO2 could provide important information regrading
15
these pollution sources.
Acknowledgements. This material is based upon work supported by the National
Sci-ence Foundation International Research Fellowship Program under Grant No. 0653087, the SEMARNAT-CONACYT Grant No. C01-0116 and the MCMA 2006 project.
The authors acknowledge Ricard Torres Jard ´on and Alejandro Torres for the operation of the
20
mobile laboratory at the Tenango del Aire research site.
References
de Foy, B., Fast, J. D., Paech, S. J., Phillips, D., Walters, J. T., Coulter, R. L., Martin, T. J., Pekour, M. S., Shaw, W. J., Kastendeuch, P. P., Marley, N. A., Retama, A., and Molina, L. T.: Basin-scale wind transport during the MILAGRO field campaign and comparison to
25
ACPD
9, 4769–4804, 2009NO2 DOAS
measurements at Tenango del Aire
M. L. Melamed et al.
Title Page
Abstract Introduction
Conclusions References
Tables Figures
◭ ◮
◭ ◮
Back Close
Full Screen / Esc
Printer-friendly Version
Interactive Discussion
DeCarlo, P. F., Dunlea, E. J., Kimmel, J. R., Aiken, A. C., Sueper, D., Crounse, J., Wennberg, P. O., Emmons, L., Shinozuka, Y., Clarke, A., Zhou, J., Tomlinson, J., Collins, D. R., Knapp, D., Weinheimer, A. J., Montzka, D. D., Campos, T., and Jimenez, J. L.: Fast airborne aerosol size and chemistry measurements above Mexico City and Central Mexico during the MILAGRO campaign, Atmos. Chem. Phys., 8, 4027–4048, 2008,
5
http://www.atmos-chem-phys.net/8/4027/2008/. 4771
Doran, J. C., Barnard, J. C., Arnott, W. P., Cary, R., Coulter, R., Fast, J. D., Kassianov, E. I., Kleinman, L., Laulainen, N. S., Martin, T., Paredes-Miranda, G., Pekour, M. S., Shaw, W. J., Smith, D. F., Springston, S. R., and Yu, X.-Y.: The T1-T2 study: evolution of aerosol properties downwind of Mexico City, Atmos. Chem. Phys., 7, 1585–1598, 2007,
10
http://www.atmos-chem-phys.net/7/1585/2007/. 4771
Emeis, S., Jahn, C., M ¨unkel, C., Muensterer, C., and Sch ¨afer, K.: Multiple atmospheric layer-ing and mixlayer-ing-layer height in the Inn valley observed by remote senslayer-ing, Meteorologische Zeitschrift, 16, 415–424, 2007. 4776
Fraser, A., Goutail, F., McLinden, C. A., Melo, S. M. L., and Strong, K.: Lightning-produced
15
NO2observed by two ground-based UV-visible spectrometers at Vanscoy, Saskatchewan in August 2004, Atmos. Chem. Phys., 7, 1683–1692, 2007,
http://www.atmos-chem-phys.net/7/1683/2007/. 4783
Greenblatt, G. D., Orlando, J. J., Burkholder, J. B., and Ravishankara, A. R.: Absorption-Measurements of Oxygen between 330 nm and 1140 nm, J. Geophys. Res.-Atmos., 95,
20
18 577–18 582, 1990. 4774
Hennigan, C. J., Sullivan, A. P., Fountoukis, C. I., Nenes, A., Hecobian, A., Vargas, O., Peltier, R. E., Case Hanks, A. T., Huey, L. G., Lefer, B. L., Russell, A. G., and Weber, R. J.: On the volatility and production mechanisms of newly formed nitrate and water soluble organic aerosol in Mexico City, Atmos. Chem. Phys., 8, 3761–3768, 2008,
25
http://www.atmos-chem-phys.net/8/3761/2008/. 4771
Kurucz, R., Furenhild, I., Brault, J., and Testermann, L.: Solar Flux from 296 nm to 1300 nm, National Solar Observation Atlas, Harvard Univertisty, Cambridge, Massachusetts, 240 pp., 1984. 4775
Langford, A. O., Portmann, R. W., Daniel, J. S., Miller, H. L., and Solomon, S.: Spectroscopic
30
ACPD
9, 4769–4804, 2009NO2 DOAS
measurements at Tenango del Aire
M. L. Melamed et al.
Title Page
Abstract Introduction
Conclusions References
Tables Figures
◭ ◮
◭ ◮
Back Close
Full Screen / Esc
Printer-friendly Version
Interactive Discussion
Lavenberg, K.: A Method for the Solution of Certain Problems in Least Squares, Quart. Appl. Math., 2, 164–168, 1944. 4775
Marquard, L. C., Wagner, T., and Platt, U.: Improved air mass factor concepts for scattered radiation differential optical absorption spectroscopy of atmospheric species, J. Geophys. Res.-Atmos., 105, 1315–1327, 2000. 4772
5
Marquardt, D.: An Algorithm for Least-Squares Estimation of Nonlinear Parameters, SIAM J. Appl. Math., 11, 431–441, 1963. 4775
McClenny, W.: Recommended Methods for Ambient Air Monitoring of NO, NO2, NOy and indi-vidual NOz species, US Environmental Protection Agency, Traingle Park, NC 27711, Tech. rep., 2000. 4777
10
Melamed, M. L., Langford, A. O., Daniel, J. S., Portmann, R. W., Miller, H. L., Eubank, C. S., Schofield, R., Holloway, J., and Solomon, S.: Sulfur dioxide emission flux measurements from point sources using airborne near ultraviolet spectroscopy during the New England Air Quality Study 2004, J. Geophys. Res.-Atmos., 113, D02305, doi:10.1029/2007JD008923, 2008. 4774, 4775
15
Moffet, R. C., de Foy, B., Molina, L. T., Molina, M. J., and Prather, K. A.: Measurement of am-bient aerosols in northern Mexico City by single particle mass spectrometry, Atmos. Chem. Phys., 8, 4499–4516, 2008,
http://www.atmos-chem-phys.net/8/4499/2008/. 4771
Molina, L. T. and Molina, M. J. (Eds.): Air Quality in the Mexico Megacity: An Integrated
Ass-20
esment, vol. 2 of Alliance for Global Sustainability Bookseries, Kluwer Academic Publishers, Dordrecht, 384 pp., 2002. 4771
M ¨unkel, C., Emeis, S., M ¨uller, W., and Sch ¨afrer, K.: Aerosol concentration measurements with a lidar ceilometer: results of a one year measuring campaign, vol. 5235 of Remote Sensing of Clouds and the Atmosphere VIII, Proc. SPIE, Bellingham, WA USA, 486–496, 2004. 4775
25
Perliski, L. and Solomon, S.: On the Evaluation of Air Mass Factors for Atmospheric Near-Ultraviolet and Visible Absorption Spectroscopy, J. Geophys. Res.-Atmos., 96, 10 363– 10 374, 1993. 4773
Perner, D. and Platt, U.: Detection of Nitrous-Acid in the Atmosphere by Differential Optical-Absorption, Geophys. Res. Lett., 6, 917–920, 1979. 4773
30
ACPD
9, 4769–4804, 2009NO2 DOAS
measurements at Tenango del Aire
M. L. Melamed et al.
Title Page
Abstract Introduction
Conclusions References
Tables Figures
◭ ◮
◭ ◮
Back Close
Full Screen / Esc
Printer-friendly Version
Interactive Discussion
Platt, U.: Differential optical absorption spectroscopy (DOAS), in Air Monitoring by Spectro-scopic Techniques, vol. 27-84 of Chemical Analysis: A series of monographs on analytical chemistry and its applications, John Wiley & Sons, INC., New York, sigrist, m.w., 27–84, 1994. 4772
Platt, U., Marquard, L., Wagner, T., and Perner, D.: Corrections for zenith scattered light DOAS,
5
Geophys. Res. Lett., 24, 1759–1762, 1997. 4775
Querol, X., Pey, J., Minguilln, M. C., Prez, N., Alastuey, A., Viana, M., Moreno, T., Bernab, R. M., Blanco, S., Crdenas, B., Vega, E., Sosa, G., Escalona, S., Ruiz, H., and Artano, B.: PM speciation and sources in Mexico during the MILAGRO-2006 Campaign, Atmos. Chem. Phys., 8, 111–128, 2008,
10
http://www.atmos-chem-phys.net/8/111/2008/. 4771
Raga, G. B., Kok, G. L., Baumgardner, D., Baez, A., and Rosas, I.: Evidence for volcanic influence on Mexico City aerosols, Geophys. Res. Lett., 26, 1149–1152, 1999. 4785
Sanders, R. W.: Improved analysis of atmospheric absorption spectra by including the temper-ature dependence of NO2, J. Geophys. Res.-Atmos., 101, 20 945–20 952, 1996. 4772
15
Sch ¨afer, K., Emeis, S., Rauch, C., M ¨unkel, C., and Voigt, S.: Determination of mixing-layer heights from ceilometer data, vol. 5571 of Remote Sensing of Clouds and the Atmosphere IX, Proc. SPIE, Bellingham, WA USA, 248–259, 2004. 4776
Solomon, S., Schmeltekopf, A. L., and Sanders, R. W.: On the Interpretation of Zenith Sky Absorption-Measurements, J. Geophys. Res.-Atmos., 92, 8311–8319, 1987. 4773, 4775
20
Solomon, S., Portmann, R. W., Sanders, R. W., Daniel, J. S., Madsen, W., Bartram, B., and Dutton, E. G.: On the role of nitrogen dioxide in the absorption of solar radiation, J. Geophys. Res.-Atmos., 104, 12 047–12 058, 1999. 4783
Stone, E. A., Snyder, D. C., Sheesley, R. J., Sullivan, A. P., Weber, R. J., and Schauer, J. J.: Source apportionment of fine organic aerosol in Mexico City during the MILAGRO
experi-25
ment 2006, Atmos. Chem. Phys., 8, 1249–1259, 2008, http://www.atmos-chem-phys.net/8/1249/2008/. 4771
Thornhill, D. A., de Foy, B., Herndon, S. C., Onasch, T. B., Wood, E. C., Zavala, M., Molina, L. T., Gaffney, J. S., Marley, N. A., and Marr, L. C.: Spatial and temporal variability of particulate polycyclic aromatic hydrocarbons in Mexico City, Atmos. Chem. Phys., 8, 3093–3105, 2008,
30
http://www.atmos-chem-phys.net/8/3093/2008/. 4771
Fourier-ACPD
9, 4769–4804, 2009NO2 DOAS
measurements at Tenango del Aire
M. L. Melamed et al.
Title Page
Abstract Introduction
Conclusions References
Tables Figures
◭ ◮
◭ ◮
Back Close
Full Screen / Esc
Printer-friendly Version
Interactive Discussion
transform spectroscopy, J. Photochem. Photobiol. A, 143, 1–9, 2001. 4774
Voigt, S., Orphal, J., and Burrows, J. P.: The temperature and pressure dependence of the absorption cross-sections of NO2in the 250–800 nm region measured by Fourier-transform spectroscopy, J. Photochem. Photobiol. A, 149, 1–7, 2002. 4774
Yokelson, R. J., Urbanski, S. P., Atlas, E. L., Toohey, D. W., Alvarado, E. C., Crounse, J. D.,
5
ACPD
9, 4769–4804, 2009NO2 DOAS
measurements at Tenango del Aire
M. L. Melamed et al.
Title Page
Abstract Introduction
Conclusions References
Tables Figures
◭ ◮
◭ ◮
Back Close
Full Screen / Esc
Printer-friendly Version
Interactive Discussion
Table 1.Tenango del Aire days by case.
Date1 Case 1 Case 2 Case 3 SV O3S O3N CS CNVS CNVN
2 X X
3 X X
4 X X
5 X X
6 X X
7 X X
8 X X
9 X X
10 X X
11 X X
12 X X
13 X X
14 X X
15 X X
16 X X
17 X X
18 X X
19 X X
20 X X
21 X X
22 X X
23 X X
24 X X
25 X X
26 X X
27 X X
28 X X
29 X X
30 X X
31 X X
1
ACPD
9, 4769–4804, 2009NO2 DOAS
measurements at Tenango del Aire
M. L. Melamed et al.
Title Page
Abstract Introduction
Conclusions References
Tables Figures
◭ ◮
◭ ◮
Back Close
Full Screen / Esc
Printer-friendly Version
Interactive Discussion
ACPD
9, 4769–4804, 2009NO2 DOAS
measurements at Tenango del Aire
M. L. Melamed et al.
Title Page
Abstract Introduction
Conclusions References
Tables Figures
◭ ◮
◭ ◮
Back Close
Full Screen / Esc
Printer-friendly Version
Interactive Discussion
-0.8 -0.4 0.0 0.4 0.8
Optical Depth [%]
505 500
495 490
485 480
475 470
Wavelength [nm]
ACPD
9, 4769–4804, 2009NO2 DOAS
measurements at Tenango del Aire
M. L. Melamed et al.
Title Page
Abstract Introduction
Conclusions References
Tables Figures
◭ ◮
◭ ◮
Back Close
Full Screen / Esc
Printer-friendly Version
Interactive Discussion
-2.0 -1.0 0.0 1.0 2.0
Optical Depth [%]
490 485
480 475
470 465
460
Wavelength [nm]
Fig. 3.The retrieved optical depth (red line) and the retrived optical depth plus the residual of the nonlinear least squares fit (black line) of O4. The∼2% absorption corresponds to 4.7×1043 molecules2 cm−5
measured on 28 March 2008 during a thunderstorm. Please note O4 is an O2-O2collision complex and therefore the retrieved O4values are reported with respect to the quadratic of the O2concentrations in units molecules2cm−5
ACPD
9, 4769–4804, 2009NO2 DOAS
measurements at Tenango del Aire
M. L. Melamed et al.
Title Page
Abstract Introduction
Conclusions References
Tables Figures
◭ ◮
◭ ◮
Back Close
Full Screen / Esc
Printer-friendly Version
Interactive Discussion
5
4
3
2
1
0
NO
2
[molec 10
16 cm -2 ]
8:00 AM 3/18/06
10:00 AM 12:00 PM 2:00 PM 4:00 PM Date a Time [CDT, -6 GMT]
NO2 DSCD NO2 VCD
ACPD
9, 4769–4804, 2009NO2 DOAS
measurements at Tenango del Aire
M. L. Melamed et al.
Title Page
Abstract Introduction
Conclusions References
Tables Figures
◭ ◮
◭ ◮
Back Close
Full Screen / Esc
Printer-friendly Version
Interactive Discussion
10
8
6
4
2
0
Wind Speed [m s
-1 ]
8:00 AM 3/13/06
10:00 AM 12:00 PM 2:00 PM 4:00 PM Date and Time [CDT, -6 GMT]
360
270
180
90
0
Wind Direction [degrees]
35
30
25
20
15
10
5
0
Temperature [˚C]
8:00 AM 3/13/06
10:00 AM 12:00 PM 2:00 PM 4:00 PM
Date and Time (Local, -6 GMT)
100 80 60 40 20 0
Humidity [%]
(a)
(b)
ACPD
9, 4769–4804, 2009NO2 DOAS
measurements at Tenango del Aire
M. L. Melamed et al.
Title Page
Abstract Introduction
Conclusions References
Tables Figures
◭ ◮
◭ ◮
Back Close
Full Screen / Esc
Printer-friendly Version
Interactive Discussion 5
4
3
2
1
0
NO
2
VCD [molec 10
16 cm -2]
8:00 AM
3/13/06 10:00 AM 12:00 PM 2:00 PM 4:00 PM
Date and Time (Local, -6 GMT) 35
30 25 20 15 10 5 0
NO
2
[ppb]
8:00 AM
3/13/06 10:00 AMDate and Time [CDT, -6 GMT]12:00 PM 2:00 PM 4:00 PM
Plume 1
Plume 2 Plume 3 2.5
2.0
1.5
1.0
0.5
0.0
Mixing Layer Height [km]
8:00 AM 3/13/06
10:00 AM 12:00 PMHeight (m)2:00 PM 4:00 PM
(a)
(b)
(c)
ACPD
9, 4769–4804, 2009NO2 DOAS
measurements at Tenango del Aire
M. L. Melamed et al.
Title Page
Abstract Introduction
Conclusions References
Tables Figures
◭ ◮
◭ ◮
Back Close
Full Screen / Esc
Printer-friendly Version
Interactive Discussion
5
4
3
2
1
0 O4
Airmasses
8:00 AM
3/13/06 10:00 AM 12:00 PM 2:00 PM 4:00 PM Date and Time [CDT, -6GMT]
Plume 1
Plume 2 Plume 3
ACPD
9, 4769–4804, 2009NO2 DOAS
measurements at Tenango del Aire
M. L. Melamed et al.
Title Page
Abstract Introduction
Conclusions References
Tables Figures
◭ ◮
◭ ◮
Back Close
Full Screen / Esc
Printer-friendly Version
Interactive Discussion
50
40
30
20
10
0
NO
2
[ppbv]
8:00 AM
3/13/06 10:00 AMDate and Time [CDT, -6 GMT]12:00 PM 2:00 PM 4:00 PM Measured in situ NO
2 Calculated NO2 concentration from MLH and DOAS Measurements
Plume 1
Plume 2
Plume 3
ACPD
9, 4769–4804, 2009NO2 DOAS
measurements at Tenango del Aire
M. L. Melamed et al.
Title Page
Abstract Introduction
Conclusions References
Tables Figures
◭ ◮
◭ ◮
Back Close
Full Screen / Esc
Printer-friendly Version
Interactive Discussion
10
8
6
4
2
0
Wind Speed [m s
-1 ]
8:00 AM
3/18/06 10:00 AMDate and Time [CDT, -6 GMT]12:00 PM 2:00 PM 4:00 PM
360
270
180
90
0
Wind Direction [degrees]
35
30
25
20
15
10
5
0
Temperature [˚C]
8:00 AM 3/18/06
10:00 AMDate and Time (Local, -6 GMT)12:00 PM 2:00 PM 4:00 PM
100 80 60 40 20 0
Humidity [%]
(a)
(b)
ACPD
9, 4769–4804, 2009NO2 DOAS
measurements at Tenango del Aire
M. L. Melamed et al.
Title Page
Abstract Introduction
Conclusions References
Tables Figures
◭ ◮
◭ ◮
Back Close
Full Screen / Esc
Printer-friendly Version
Interactive Discussion
5
4
3
2
1
0
NO
2
VCD [molec 10
16
cm
-2 ]
8:00 AM
3/18/06 10:00 AMDate and Time (Local, -6 GMT)12:00 PM 2:00 PM 4:00 PM 6:00 PM
2.0
1.5
1.0
0.5
0.0
Mixing Layer Height [km]
8:00 AM
3/18/08 10:00 AMDate and Time [6 CDT, -6 GMT]12:00 PM 2:00 PM 4:00 PM
50
40
30
20
10
0
NO
2
[ppbv]
8:00 AM
3/18/06 10:00 AMDate and Time [CDT, -6 GMT]12:00 PM 2:00 PM 4:00 PM
(a)
(b)
(c)
ACPD
9, 4769–4804, 2009NO2 DOAS
measurements at Tenango del Aire
M. L. Melamed et al.
Title Page
Abstract Introduction
Conclusions References
Tables Figures
◭ ◮
◭ ◮
Back Close
Full Screen / Esc
Printer-friendly Version
Interactive Discussion
10
8
6
4
2
0
Wind Speed [m s
-1 ]
8:00 AM 3/28/06
10:00 AM 12:00 PM 2:00 PM 4:00 PM Date and Time [CDT, -6 GMT]
360
270
180
90
0
Wind Direction [degrees]
35
30
25
20
15
10
5
0
Temperature [˚C]
8:00 AM 3/28/06
10:00 AMDate and Time (Local, -6 GMT)12:00 PM 2:00 PM 4:00 PM 6:00 PM
100 80 60 40 20 0
Humidity [%]
(a)
(b)
ACPD
9, 4769–4804, 2009NO2 DOAS
measurements at Tenango del Aire
M. L. Melamed et al.
Title Page
Abstract Introduction
Conclusions References
Tables Figures
◭ ◮
◭ ◮
Back Close
Full Screen / Esc
Printer-friendly Version
Interactive Discussion
35 30 25 20 15 10 5 0
NO
Y
[ppb]
8:00 AM
3/28/06 10:00 AMDate and Time [CDT, -6 GMT]12:00 PM 2:00 PM 4:00 PM 10
8
6
4
2
0
NO
2
VCD [molec 10
16 cm -2 ]
2:00 PM 3/28/06 Date and Time (Local, -6 GMT)
2.0
1.5
1.0
0.5
0.0
Mixing Layer Height [km]
2:00 PM 3/28/06 Date and Time (Local, -6 GMT) (a)
(c) (b)
ACPD
9, 4769–4804, 2009NO2 DOAS
measurements at Tenango del Aire
M. L. Melamed et al.
Title Page
Abstract Introduction
Conclusions References
Tables Figures
◭ ◮
◭ ◮
Back Close
Full Screen / Esc
Printer-friendly Version
Interactive Discussion
3000
2500
2000
1500
1000
500
0
Intensity [a.u.]
8:00 AM 3/28/06
10:00 AM 12:00 PM 2:00 PM 4:00 PM Date and Time [CDT, -6 GMT] 5
4
3
2
1
0
O4
Air Masses
ACPD
9, 4769–4804, 2009NO2 DOAS
measurements at Tenango del Aire
M. L. Melamed et al.
Title Page
Abstract Introduction
Conclusions References
Tables Figures
◭ ◮
◭ ◮
Back Close
Full Screen / Esc
Printer-friendly Version
Interactive Discussion