ACPD
14, 14109–14157, 2014Scattering phase function of cirrus and the atmospheric state
A. J. Baran et al.
Title Page
Abstract Introduction
Conclusions References
Tables Figures
◭ ◮
◭ ◮
Back Close
Full Screen / Esc
Printer-friendly Version Interactive Discussion
Discussion
P
a
per
|
Discus
sion
P
a
per
|
Discussion
P
a
per
|
Discussion
P
a
per
|
Atmos. Chem. Phys. Discuss., 14, 14109–14157, 2014 www.atmos-chem-phys-discuss.net/14/14109/2014/ doi:10.5194/acpd-14-14109-2014
© Author(s) 2014. CC Attribution 3.0 License.
This discussion paper is/has been under review for the journal Atmospheric Chemistry and Physics (ACP). Please refer to the corresponding final paper in ACP if available.
On the relationship between the
scattering phase function of cirrus and
the atmospheric state
A. J. Baran1, K. Furtado1, L.-C. Labonnote2, S. Havemann1, J.-C. Thelen1, and F. Marenco1
1
Met Office, Exeter, UK
2
Université des Sciences et Technologies de Lille, Lille, France
Received: 27 March 2014 – Accepted: 1 April 2014 – Published: 2 June 2014
Correspondence to: A. J. Baran ([email protected])
Published by Copernicus Publications on behalf of the European Geosciences Union.
ACPD
14, 14109–14157, 2014Scattering phase function of cirrus and the atmospheric state
A. J. Baran et al.
Title Page
Abstract Introduction
Conclusions References
Tables Figures
◭ ◮
◭ ◮
Back Close
Full Screen / Esc
Printer-friendly Version Interactive Discussion
Discussion
P
a
per
|
Discus
sion
P
a
per
|
Discussion
P
a
per
|
Discussion
P
a
per
|
Abstract
This is the first paper to investigate the relationship between the scattering phase func-tion of cirrus and the relative humidity with respect to ice (RHi), using space-based
solar radiometric angle-dependent measurements. The relationship between RHi, and the complexity of ice crystals has been previously studied using data from aircraft field 5
campaigns and laboratory cloud chambers. However, to the best of our knowledge, there have been no studies to date that explore this relationship, through the use of re-motely sensed space-based angle-dependent solar radiometric measurements. In this paper, a case study of semi-transparent cirrus is used to explore the possibility of such a relationship. Moreover, for the first time, RHi fields predicted by a high-resolution 10
numerical weather prediction (NWP) model are combined with satellite retrievals of ice crystal complexity. The NWP model was initialised at midnight, on the 25 January 2010, and the mid-latitude RHi field was extracted from the NWP model at 13:00 UTC. At about the same time, there was a Polarization and Anisotropy of Reflectance for At-mospheric science coupled with Observations from a Lidar (PARASOL) overpass, and 15
the PARASOL swath covered the NWP model predicted RHi field. The cirrus case was located over Scotland, and over the North Sea. From the satellite channel based at 0.865 µm, the directionally averaged and directional spherical albedos were retrieved between the scattering angles of about 80◦ and 130◦. An ensemble model of cirrus ice crystals is used to predict phase functions that vary between phase functions that 20
exhibit optical features (called pristine), to featureless phase functions. For each of the PARASOL pixels, the phase function that best minimised differences between the spherical albedos was selected. This paper reports a positive correlation between the scattering phase function and RHi. That is, the pristine and completely featureless
phase functions are found to be correlated with RHi<100 %, and RHi>100 %, respec-25
ACPD
14, 14109–14157, 2014Scattering phase function of cirrus and the atmospheric state
A. J. Baran et al.
Title Page
Abstract Introduction
Conclusions References
Tables Figures
◭ ◮
◭ ◮
Back Close
Full Screen / Esc
Printer-friendly Version Interactive Discussion
Discussion
P
a
per
|
Discus
sion
P
a
per
|
Discussion
P
a
per
|
Discussion
P
a
per
|
Furthermore, the NWP model prediction of the cirrus cloud-top height and its vertical extent is also found to be in good agreement with aircraft-based lidar measurements.
1 Introduction
Cirrus or pure ice crystal cloud usually forms at temperatures of less than about−40◦C, and at altitudes greater than about 6 km (Wylie et al., 1999; Baran, 2012; Guignard et 5
al., 2012). The extent to which ice crystals can grow and form complex shapes is dependent on the environmental temperature, pressure, and RHi (Marshall and Lan-gleben 1954; Nakaya 1954; Hallett and Mason 1958; Mason 1971; Heymsfield 1977; Liou 1986; Lynch 2002; Bailey and Halett 2004; Bailey and Hallett 2009; Pfalzgraff
et al., 2010; Ulanowski et al., 2013). In cirrus clouds, the supersaturations with re-10
spect to ice can range between about 150 % to−50 % (Krämer et al., 2009). However, more recent studies of RHi in mid-latitude cirrus, report values of about 60 % to 120 %
(Gayet et al., 2011; Ulanowski et al., 2013), with the latter values being the more typical. With such a range of possible supersaturation values reported by previous authors, the range of ice crystal complexity, within the same cirrus cloud, is likely to be significant 15
(Bailey and Hallett, 2009). In this paper, ice crystal complexity can mean polycrystals, which may be compact or highly irregular, and ice aggregates, and these ice aggre-gates may also have low aspect ratios (i.e., the ratio between the projected area of the non-spherical particle and the projected area of the circumscribing circle of the same maximum dimension as the non-spherical particle). The monomers that make-up the 20
polycrystal or aggregate may also be surface roughened on their facets and/or contain air cavities, within their volumes.
The role of ice supersaturation in forming complex ice crystals has most recently been studied by Bailey and Hallett (2009), Pfalzgraff et al. (2010) and Ulanowski et al. (2013). In the cloud chamber study by Pfalzgraffet al. (2010), it was reported that 25
surface roughness was at its greatest when supersaturations were near zero. More-over, Walden et al. (2003) observed surface roughness on precipitating ice crystals
ACPD
14, 14109–14157, 2014Scattering phase function of cirrus and the atmospheric state
A. J. Baran et al.
Title Page
Abstract Introduction
Conclusions References
Tables Figures
◭ ◮
◭ ◮
Back Close
Full Screen / Esc
Printer-friendly Version Interactive Discussion
Discussion
P
a
per
|
Discus
sion
P
a
per
|
Discussion
P
a
per
|
Discussion
P
a
per
|
der conditions of near-zero supersaturation at the South Pole. Other laboratory studies by (Bacon et al., 2003; Malkin et al., 2012; Ulanowski et al., 2013) show that ice crys-tals, under ice supersaturated conditions, can become surface roughened, through the development of prismatic grooves or dislocations on the ice crystal surface. However, as pointed out by Bacon et al. (2003) and others, the temperature and RHi variables
5
do not uniquely determine the number of monomers that make-up the polycrystal or surface roughness. This is because ice crystal complexity and surface roughness may also depend on how the ice crystals were initiated, and thus may depend on the chem-ical composition of the initiating ice nuclei. A recent paper by Ulanowski et al. (2013) reported that for a few cases of mid-latitude cirrus, formed in Oceanic air, slightly higher 10
values of ice crystal complexity were found than was the case for mid-latitude cir-rus formed in Continental air (i.e., a polluted air mass). However, in the same study, no correlation was found between ice crystal complexity and instantaneous measure-ments of RHi. As pointed out by Ulanowski et al. (2013), this lack of correlation could be due to the instantaneous measurements being obtained at a single point in time, 15
whereas the ice crystals, on which the measurements were based, may have gone through different histories of supersaturation, and so for each measurement, the his-tory of supersaturation-exposure can never be known. On the other hand, controlled laboratory studies by Ulanowski et al. (2013) of ice crystal analogues, show that under high levels of ice supersaturation, the ice crystals formed can be very complex relative 20
to the regular ice crystals grown under conditions of low ice supersaturation. This latter laboratory study of Ulanowski et al. (2013) is consistent with the findings of Bailey and Hallett (2009).
Theoretical light scattering studies by (Schmitt and Heymsfield 2010; Macke et al., 1996a, b; Yang and Liou 1998; Yang et al., 2008) have shown that the processes of 25
rough-ACPD
14, 14109–14157, 2014Scattering phase function of cirrus and the atmospheric state
A. J. Baran et al.
Title Page
Abstract Introduction
Conclusions References
Tables Figures
◭ ◮
◭ ◮
Back Close
Full Screen / Esc
Printer-friendly Version Interactive Discussion
Discussion
P
a
per
|
Discus
sion
P
a
per
|
Discussion
P
a
per
|
Discussion
P
a
per
|
ened ice crystals having lower asymmetry parameter values relative to their smooth counterparts. The asymmetry parameter is one of the parameters of importance to cli-mate models, since it affects how much incident solar irradiance is reflected back to space (Stephens and Webster 1981; Yang and Liou 1998; Yang et al., 2008; Ulanowski et al., 2006; Baran, 2012). Therefore, it is important to constrain this parameter through 5
observation using a variety of instruments such as those used in the studies by (Gayet et al., 2002, 2011; Field et al., 2003; Garrett et al., 2003; Mauno et al., 2011; Ulanowski et al., 2013; Van de Diedenhoven et al., 2013). Other methods of removing or dimin-ishing halos involve introducing air concavities from the basal ends of hexagonal ice crystals, or to embed spherical air bubbles within the ice crystal volume. The former 10
method removes the 46◦ halo and reduces the 22◦ halo (Macke et al., 1996b; Yang et al., 2008), and the latter method produces featureless phase functions, through mul-tiple scattering between spherical air inclusions (Labonnote et al., 2001; Baran and Labonnote, 2007; Xie et al., 2009). Although recent cloud chamber and theoretical ray-tracing studies by Neshyba et al. (2013) and Shcherbakov (2013), respectively, have 15
shown that surface roughness may not necessarily completely remove the 22◦halo, it is as yet unclear, as to whether the results obtained in the laboratory are scalable to the real atmosphere. Indeed, in situ studies on the occurrence of the 22◦ halo show that it is a rare event (Field et al., 2003; Gayet et al., 2011; Ulanowski et al., 2013). Clearly, further laboratory studies of ice crystals are needed, which combines angular 20
scattering measurements at visible wavelengths with a detailed analysis of ice crystal habit, surface roughness and the degree of concavity, all obtained, as functions of time. The dimension of time is important to include as this would be a useful constraint to apply to theoretical studies of ice crystal growth and complexity (Barrett et al., 2012).
Radiometric angle-dependent observations of the transmitted and reflected intensi-25
ties from cirrus tend to suggest that featureless phase functions best represent those measurements obtained from below and/or above the cloud (Foot 1988; Baran et al., 1999, 2001; Doutriaux-Boucher et al., 2000; Jourdan et al., 2003; Baran, 2012; Cole et al., 2013, and references contained therein). Aircraft-based instruments such as the
ACPD
14, 14109–14157, 2014Scattering phase function of cirrus and the atmospheric state
A. J. Baran et al.
Title Page
Abstract Introduction
Conclusions References
Tables Figures
◭ ◮
◭ ◮
Back Close
Full Screen / Esc
Printer-friendly Version Interactive Discussion
Discussion
P
a
per
|
Discus
sion
P
a
per
|
Discussion
P
a
per
|
Discussion
P
a
per
|
Polar Nephelometer (PN), which is described by Gayet et al. (1997), have been used to measure the angular scattered intensity of naturally-occurring single ice crystals, at scattering angles between about 15◦and 162◦, at the wavelength of 0.80 µm. Clearly, the PN measured polar angle range encompasses the halo regions of 22◦ and 46◦. Therefore, obtaining the ratio of the ice crystal scattered energy at the polar angle of 5
22◦to that at 18.5◦(the latter being an angle at which no halo is formed by prismatic ice crystals) would be a quantitative measure of the presence of the 22◦ halo. Halo ratios greater than one are likely to be associated with pristine ice crystals, whilst halo ratios less than one are likely to be associated with irregular ice crystals. Using a mid-latitude cirrus case, Gayet et al. (2011) used the halo ratio to relate the occurrence of halos 10
to instantaneous measurements of RHi. The study found that at the trailing edge of the cirrus-band, at a temperature of−55◦C, the halo ratio<1, but at the leading edge of the cirrus-band, the halo ratio >1, at a temperature of −27◦C. The study did not find any systematic evidence for a relationship between the halo ratio and ice super-saturation, a finding that is consistent with Ulanowski et al. (2013). However, Gayet et 15
al. (2011) did find that halo ratios>1 were more likely to be found at supersaturation values of around 100 %, and no halo ratios>1 were found at the highest supersat-uration values, which approached 120 %. Moreover, in the recent study by Ulanowki et al. (2013), a negative correlation is reported between the occurrence of halos and estimated ice crystal complexity. The measure of ice crystal complexity was derived 20
from in situ observations of spatial light scattering patterns from single particles ob-tained in several cases of mid-latitude cirrus. The in situ findings of Gayet et al. (2011) and laboratory studies of Ulanowski et al. (2013) are consistent with previous studies (i.e., Bailey and Hallett, 2009, and references therein), which tend to show that more complex ice crystals are associated with relatively high values of RHi.
25
ACPD
14, 14109–14157, 2014Scattering phase function of cirrus and the atmospheric state
A. J. Baran et al.
Title Page
Abstract Introduction
Conclusions References
Tables Figures
◭ ◮
◭ ◮
Back Close
Full Screen / Esc
Printer-friendly Version Interactive Discussion
Discussion
P
a
per
|
Discus
sion
P
a
per
|
Discussion
P
a
per
|
Discussion
P
a
per
|
of ice crystal complexity is related to the atmospheric state. This relationship could then be used to predict appropriate ice scattering properties for some given atmospheric state, rather than assuming the same scattering properties for all states that are found in a climate model, which is what is done at the present time. The most recent report of the Intergovernmental Panel on Climate Change (IPCC, 2013) stated that the coupling 5
between clouds and the atmosphere was one of the largest uncertainties in predicting climate change. This uncertainty may well be reduced if appropriate parameterizations could be found between ice crystal scattering properties and the atmospheric state.
In this paper, for a case of mid-latitude cirrus, the relationship between the scattering phase function and RHi is further studied, by combining with space-based multi-angle 10
total reflectance measurements an NWP prediction of the RHi field. The paper is split into the following sections. Section 2 describes the NWP model, and the aircraft-based instruments used in this study. Section 3 describes the single-scattering properties of ice crystals on which the satellite retrievals are based, and a brief description of the radiative transfer model is also given. The retrieval methodology is described in Sect. 4 15
and results are discussed in Sect. 5. Section 6 presents the conclusions of this study.
2 The cirrus case, numerical weather prediction model and aircraft instrumen-tation
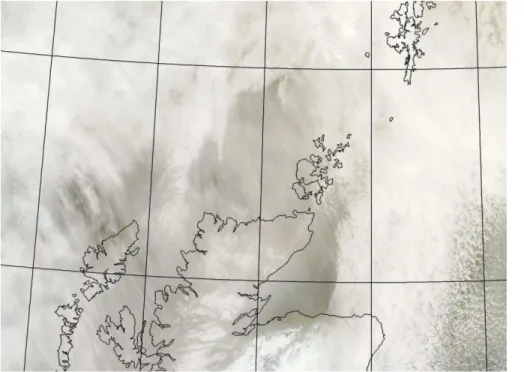
The cirrus case occurred on 25 January 2010 offthe North and East coast of Scotland, and it is shown in Fig. 1. The figure shows a high-resolution MOderate Imaging Spectro-20
radiometer (MODIS) composite image (Platnick et al., 2003) of semi-transparent cirrus obtained at 13:30 UTC. The semi-transparent cirrus can be clearly seen around the North and East Coast of Scotland, whilst further to the East, lower level water cloud underlying the cirrus can be seen. At about the same time, as the image shown in Fig. 1 was taken the FAAM (Facility for Airborne Atmospheric Measurements) BAe-146 25
aircraft was measuring the same high-cloud field.
ACPD
14, 14109–14157, 2014Scattering phase function of cirrus and the atmospheric state
A. J. Baran et al.
Title Page
Abstract Introduction
Conclusions References
Tables Figures
◭ ◮
◭ ◮
Back Close
Full Screen / Esc
Printer-friendly Version Interactive Discussion
Discussion
P
a
per
|
Discus
sion
P
a
per
|
Discussion
P
a
per
|
Discussion
P
a
per
|
The FAAM aircraft is an atmospheric research facility, which is jointly owned by the Met Office and the National Environment Research Council (NERC). The cirrus case shown in Fig. 1 was sampled by the aircraft as part of the ‘Constrain’ field programme (Cotton et al., 2013). The aircraft sampled the cirrus between the latitudes of about 58◦N and 59◦N, and between the longitudes of about 2.5◦W and 4.5◦W. The air-5
craft in situ instrumentation measured the temperatures of the cloud-top and base to be about−55◦C and −30◦C, respectively. The aircraft began sampling the cloud at 11:55:06 UTC, and finished the sampling at 15:49:44 UTC. During this sampling time, the aircraft flew three straight and level runs above the cloud, each of about 10 minutes duration, commencing at 13:19:00 UTC, 13:27:42 UTC, and at 15:21:42 UTC, respec-10
tively. From the aircraft a dropsonde (measures vertical profiles of temperature, pres-sure, and relative humidity with respect to water) was released at 13:30:00 UTC. In this study, use is made of the aircraft data from the earlier two runs, and the dropsonde measurements, which most closely coincided with the PARASOL overpass. Note also, that there was an 8 minute interval between the two earlier straight and level runs, dur-15
ing which time the aircraft was manoeuvring into position. In this paper, use is made of observations from two instruments deployed on the aircraft. The two instruments were the active Leosphere ALS450 elastic backscatter lidar and the passive Airborne Research Interferometer Evaluation System (ARIES).
The nadir-pointing lidar operates at 0.355 um with an integration time of 2 s and a 20
vertical resolution of 1.5 m (Marenco et al., 2011). Further averaging of the signals has been done at post-processing, bringing the temporal resolution to 10 s (equivalent at aircraft science speed to a 1.5–2 km footprint) and the vertical resolution to 45 m. The volume extinction coefficient is computed from the lidar returns using the Fernald-Klett method described in (Fernald 1984; Klett 1985), assuming a lidar ratio of 20 sr.
25
ACPD
14, 14109–14157, 2014Scattering phase function of cirrus and the atmospheric state
A. J. Baran et al.
Title Page
Abstract Introduction
Conclusions References
Tables Figures
◭ ◮
◭ ◮
Back Close
Full Screen / Esc
Printer-friendly Version Interactive Discussion
Discussion
P
a
per
|
Discus
sion
P
a
per
|
Discussion
P
a
per
|
Discussion
P
a
per
|
The nadir-pointing ARIES and lidar data used here are from the straight and level runs above the cirrus.
The RHi field of the cirrus case, shown in Fig. 1, has been simulated using the Met
Office high-resolution numerical weather prediction model (NWP). The NWP simulation of the RHi field was obtained using a high-resolution limited area model nested inside
5
a suite of coarser resolution models. The high-resolution domain had a horizontal grid spacing of approximately 1 km and received hourly lateral boundary conditions from a 4 km model on a larger domain. The 4 km model was nested inside a 12 km domain, which was in turn driven by an N216 global model forecast. The 1 km grid was centred on (58.60◦N, −6.45◦W) with 1024 points East-to-West and 744 points North-to-South 10
and a zonal and meridional grid spacing of 0.0135 degrees. The model time step was 50 s and the vertical level set comprised 70 levels, with a grid spacing of approximately 250 m at the altitudes of interest for this study.
The model is non-hydrostatic and employs the semi-Lagrangian advection scheme. In terms of model-physics, the model is broadly comparable to the version of Met Of-15
fice operational UKV forecasting system that was used operationally until the autumn of 2011 (Lean et al., 2008). However, in an attempt to represent the simulated cloud system as well as possible, the following changes were made to the ice cloud micro-physics. Firstly, the ice particle size distribution (PSD) parameterisation was changed so as to be consistent with the PARASOL radiative retrievals (see Sect. 3 for details). 20
Secondly, the mass-diameter relation of the ice crystals was taken directly from the Constrain in situ measurements (Cotton et al., 2013), and is therefore a “best-estimate” of this property for the simulated cloud system. For this paper, the NWP model was ini-tialized at midnight on 25 January 2010, and the RHi forecast field was extracted from
the model on the same day but at the 13:00 UTC time step. 25
At about the same time as the NWP model RHi field was extracted there was a PARASOL overpass at about 12:50 UTC. PARASOL has its central channels located at 0.443 µm, 0.490 µm, 0.565 µm, 0.670 µm, 0.763 µm, 0.765 µm, 0.865 µm, 0.910 µm and 1.02 µm. In this study, use is made of the instrument’s 0.865 µm channel, due to the
ACPD
14, 14109–14157, 2014Scattering phase function of cirrus and the atmospheric state
A. J. Baran et al.
Title Page
Abstract Introduction
Conclusions References
Tables Figures
◭ ◮
◭ ◮
Back Close
Full Screen / Esc
Printer-friendly Version Interactive Discussion
Discussion
P
a
per
|
Discus
sion
P
a
per
|
Discussion
P
a
per
|
Discussion
P
a
per
|
sea surface at this wavelength being almost black. PARASOL can view the same nadir-pixel at up to 14 viewing directions, at scattering angles between approximately 70◦and 180◦, and each pixel has a resolution of 5.3 km×6.3 km. The range of scattering angles sampled by PARASOL depends on the sun-satellite geometry, latitude of the pixel, and the position of the pixel on the satellite track (i.e., east or west). Given the latitude and 5
time of the year of the case considered here, the range of scattering angles viewed by PARASOL was between about 80◦and 130◦, and the total number of viewing directions for each pixel was between 7 and 8. The solar zenith angle at the time of the PARASOL overpass was 75◦ and the solar azimuth angle was 187◦. The PARASOL analysis is performed on a pixel-by-pixel basis. Moreover, it should also be noted here that the 10
NWP model field of RHi is averaged over approximately the same area as each of the PARASOL pixels. In the next section, the ice crystal model, single-scattering properties and radiative transfer models are briefly described and defined, respectively.
3 Ice crystal model and definitions of single-scattering properties
3.1 Ice crystal model and the particle size distribution function (PSD)
15
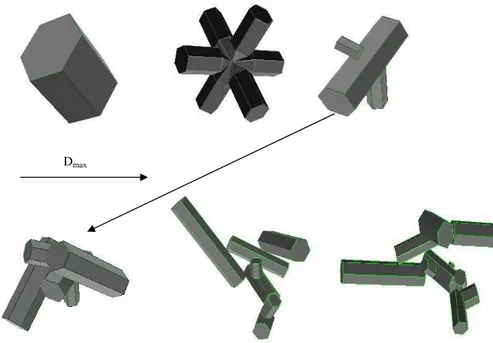
The model of ice crystals used in this study has been developed by Baran and Labon-note (2007), and it is called the ensemble model of cirrus ice crystals. The model has previously been fully described by Baran and Labonnote (2007), but a brief description is given here, and the model is shown in Fig. 2. The model consists of six elements. The first element is the hexagonal ice column of aspect ratio unity, and the second ele-20
ment is the six-branched bullet-rosette. Thereafter, hexagonal monomers are arbitrarily attached, as a function of ice crystal maximum dimension, forming three, five, eight and ten monomer polycrystals. The ensemble model has previously been shown to predict the volume extinction coefficient, ice water content (IWC), and column integrated IWC, as well as the optical depth of mid-latitude and tropical cirrus to within current exper-25
ACPD
14, 14109–14157, 2014Scattering phase function of cirrus and the atmospheric state
A. J. Baran et al.
Title Page
Abstract Introduction
Conclusions References
Tables Figures
◭ ◮
◭ ◮
Back Close
Full Screen / Esc
Printer-friendly Version Interactive Discussion
Discussion
P
a
per
|
Discus
sion
P
a
per
|
Discussion
P
a
per
|
Discussion
P
a
per
|
replicated one day of PARASOL cirrus observations of total reflectance, between the scattering angles of about 60◦ and 180◦ (Baran and Labonnote, 2007). It was further shown by Baran and Labonnote (2007) that the second randomised member of the en-semble model, randomized in such a way as to produce featureless scattering matrix elements, replicated one day of the global linear polarized reflectance measurements 5
at close to cloud-top.
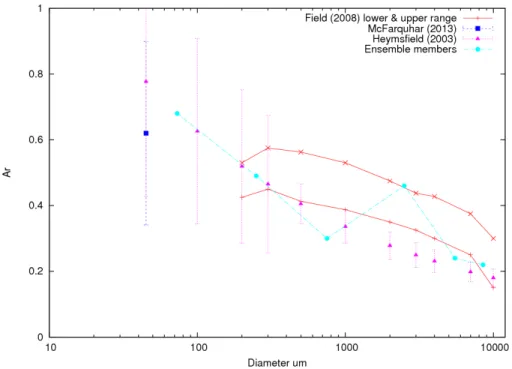
To demonstrate why the ensemble model can replicate in situ estimates of the vol-ume extinction coefficient to within current experimental uncertainties, here the model predictions of the area ratio are compared against in situ estimates of naturally-occurring area ratios. The area ratio, Ar, is a useful measure of particle non-sphericity 10
using in situ observations obtained from two-dimensional imaging probes. It is defined as the ratio of the projected area of a non-spherical particle to the area of a circum-scribing circle of the same maximum dimension as the non-spherical particle. The averaged,hAri, area ratio value predicted by each member of the ensemble is shown in Fig. 3, and in the figure, the predicted values are compared against in situ estimates 15
of Ar. The in situ observations shown in Fig. 3 are obtained from a number of aircraft
field campaigns that took place in the Arctic, mid-latitudes and tropics (Heymsfield and Miloshevich 2003; Field et al., 2008; McFarquhar et al., 2013). The Arvalues from
Mc-Farquhar et al. (2013) were obtained in the Arctic at ice crystal maximum dimensions between about 35 µm and 60 µm, and the averaged-values ofhAriwere reported to be 20
between 0.65 to 0.58, but with a standard deviation of ±45 %. These averaged val-ues were found for 80 % of the estimates compiled by McFarquhar et al. (2013). The in situ estimates of Ar from Heymsfield and Miloshevich (2003) are a synthesis of all the mid-latitude data (Eq. 2 from Heymsfield and Miloshevich 2003) compiled in that paper, and those estimates were prescribed an uncertainty of±50 % for ice crystals 25
less than 3000 µm, the uncertainty reducing to±25 %, for sizes greater than 3000 µm. The data from Field et al. (2008) were obtained in the tropics at ice crystal maximum dimensions between about 200 µm and 10000 µm, and in Fig. 3, the upper and lower bounds on the data from Field et al. (2008) are shown, but on those bounds, there is
ACPD
14, 14109–14157, 2014Scattering phase function of cirrus and the atmospheric state
A. J. Baran et al.
Title Page
Abstract Introduction
Conclusions References
Tables Figures
◭ ◮
◭ ◮
Back Close
Full Screen / Esc
Printer-friendly Version Interactive Discussion
Discussion
P
a
per
|
Discus
sion
P
a
per
|
Discussion
P
a
per
|
Discussion
P
a
per
|
an uncertainty of±30 %. Estimates of Arfor ice crystal maximum dimensions between 20 and 100 µm were reported by Nousiainen et al., (2011) to be between 0.84 and 0.70 using tropical data, and the Arratios in that paper were based on models of Gaussian
Random spheres (Muinonen 2000).
To compare members of the ensemble model against the in situ derived estimates 5
of Ar, the maximum dimension is defined as follows. The maximum dimension of the
hexagonal column is literally its maximum dimension (McFarquhar et al., 2013). The maximum dimension of the six-branched bullet-rosette, and other members of the en-semble, is defined as the maximum distance across the particle when projected onto a two-dimensional plane (Heymsfield and Miloshevich 2003; Field et al., 2008). The area 10
ratio (Ar) of the second member of the ensemble model shown in Fig. 2 assumes it to be in random orientation, which is a reasonable assumption since for the bullet-rosette there is little difference between the projected areas, if the particle is in random or pre-ferred orientation due to its symmetry. All other members of the ensemble are assumed to be horizontally oriented along their maximum dimension, with respect to the incident 15
radiation. The oriented members are randomly oriented about their other two angles in three-dimensional space, with respect to the polar angle, to obtain an average of the projected areas, and it is these averages that are plotted in Fig. 3. In calculating the averaged Ar values, the effect of shadowing is taken into account for each of the
aggregated ensemble members. Figure 3 shows that the Ar ratio calculated for each 20
member of the ensemble model is within the current experimental range of possible Ar
values reported in the literature. The area ratio of the five monomer aggregate at about 2500 µm is larger relative to the other ice aggregates. This is due to the other aggre-gate members of the ensemble model being more longitudinally elonaggre-gated. Figure 3 shows why the model, as demonstrated by previous studies, can predict the volume 25
Cur-ACPD
14, 14109–14157, 2014Scattering phase function of cirrus and the atmospheric state
A. J. Baran et al.
Title Page
Abstract Introduction
Conclusions References
Tables Figures
◭ ◮
◭ ◮
Back Close
Full Screen / Esc
Printer-friendly Version Interactive Discussion
Discussion
P
a
per
|
Discus
sion
P
a
per
|
Discussion
P
a
per
|
Discussion
P
a
per
|
rently, the members of the ensemble model are distributed into six equal size intervals of the PSD. However, this distribution of the predicted area throughout the PSD can change, given further information on the most general weights to apply to the model.
In this study, the PSD assumed is the moment estimation parameterization of the PSD developed by Field et al. (2007), hereinafter referred to as F07. The F07 parame-5
terization relates the 2nd moment (i.e., IWC) to any other moment via a polynomial fit to the in-cloud temperature. The parameterization is based on 10 000 in situ measure-ments of the PSD, and the measuremeasure-ments were filtered using the method of Field et al. (2006) to reduce artefacts of ice crystal shattering at the inlet of the microphysical probes (Korolev et al., 2011), and the PSD was truncated at an ice crystal maximum 10
dimension of 100 µm. The in situ observations were obtained from the mid-latitudes and Tropics, at in-cloud temperatures between about −60◦C and 0◦C. The parame-terization does not ignore ice crystals less than 100 µm, but assumes that these ice crystals follow an exponential PSD. For ice crystal sizes greater than 100 µm, the pa-rameterization uses a gamma function, which was found to best-fit the in situ measured 15
PSDs. The parameterization adds together the exponential and gamma function to re-construct the full PSD, given the IWC and in-cloud temperature. It has been previously shown that the F07 parameterization is a good fit to in situ measurements of tropical and mid-latitude PSDs (Baran et al., 2011a; Furtado et al., 2013). Since the parame-terization fundamentally relates the 2nd moment of the PSD to any other moment via 20
the in-cloud temperature, to estimate representative PSDs, a mass-dimensional rela-tionship is required. In this paper, the ensemble model predicted mass-dimensional re-lationship is used to generate the F07 PSDs. The ensemble model mass-dimensional relationship was previously derived by Baran et al. (2011b) and in that paper, it was shown that the ensemble model predicts that ice crystal mass of each particle is given 25
by 0.04 D2, where D is the maximum dimension of each ice crystal, and the mass is in SI units. The ensemble model mass-dimensional relationship is within the upper un-certainty of the Constrain derived mass-dimensional relationship reported in Cotton et al. (2013), and it is therefore, representative of naturally-occurring ice crystal mass.
ACPD
14, 14109–14157, 2014Scattering phase function of cirrus and the atmospheric state
A. J. Baran et al.
Title Page
Abstract Introduction
Conclusions References
Tables Figures
◭ ◮
◭ ◮
Back Close
Full Screen / Esc
Printer-friendly Version Interactive Discussion
Discussion
P
a
per
|
Discus
sion
P
a
per
|
Discussion
P
a
per
|
Discussion
P
a
per
|
3.1.1 The single-scattering properties
Incident unpolarized sunlight is assumed to irradiate a collection of randomly oriented non-spherical particles, each of which possesses a plane of symmetry. The single-scattering properties that are applied to the PARASOL measurements are calculated using the Monte-Carlo ray tracing method, which was developed and made gener-5
ally available by Macke et al. (1996a). Each member of the ensemble is randomized, using the method of distortion, and maximum randomizations are achieved using dis-tortion and embedding, within the volume of the ice crystals, spherical air bubbles (Shcherbakov et al., 2006). The method of distortion involves randomly tilting the nor-mal vector to the surface of the ice crystal, at the ice-air interface, with respect to its 10
original direction. In this way, at each refraction-reflection event, the directions of the ray paths are changed with respect to their original direction, with the result that feature-less scattering matrix elements are predicted. The values of distortion can be between 0 and 1, where 0 represents unperturbed scattering matrix elements and these retain scattering features, such as halo and ice bows. As the distortion is increased to higher 15
values, the optical features are removed, to produce featureless scattering matrix el-ements. The distortion method attempts to replicate the complex processes that may occur on and within ice crystals, which could lead to featureless phase functions. Other authors refer to distortion as “micro-scale surface roughness.” However, this description of surface roughness may not be accurate as surface roughness can take on different 20
forms (Mason 1971; Pfalzgraffet al., 2010; Bacon et al., 2003; Malkin et al., 2012). For instance, a theoretical electromagnetic study by Liu et al. (2013) has shown that at high values of idealized surface roughness, the method of distortion does not accurately re-produce the scattering phase function. In this study, the method of distortion is merely used to randomize the ice crystal so that featureless scattering phase functions are 25
produced.
spher-ACPD
14, 14109–14157, 2014Scattering phase function of cirrus and the atmospheric state
A. J. Baran et al.
Title Page
Abstract Introduction
Conclusions References
Tables Figures
◭ ◮
◭ ◮
Back Close
Full Screen / Esc
Printer-friendly Version Interactive Discussion
Discussion
P
a
per
|
Discus
sion
P
a
per
|
Discussion
P
a
per
|
Discussion
P
a
per
|
ical air bubbles, to achieve the maximum randomization of the ice crystals to produce featureless phase functions. The upper distortion value of 0.4 was chosen as this was found to best-fit one day of global POLDER-2 measurements of the total reflectance and linearly polarized reflectance (Baran and Labonnote, 2006). For the most ran-domized case of assuming a distortion value of 0.4 and including the ice crystal with 5
spherical air bubbles, the phase functions are calculated using the modifications by Shcherbakov et al. (2006) applied to the ray tracing model of Macke et al. (1996a). The statistics describing the tilt angles were shown by Shcherbakov et al. (2006) to be best represented by using Weibull statistics, where the Weibull distribution is de-fined by the scale (i.e., the distortion as described above) and shape parameters. This 10
finding was based on cloud chamber measurements of the angular scattered intensity from a collection of ice crystals, at a visible wavelength, and comparisons between measurements and ray-tracing results showed that the Weibull statistics were the bet-ter match to the measurements. Moreover, the choice of Weibull statistics is consistent with independent cloud chamber results found by Neshyba et al. (2013). For the most 15
randomized case considered in this paper, the Weibull statistics are assumed to have the following scale and shape parameter values of 0.4 and 0.85, respectively, and for the spherical air bubble inclusions, a mean free path of 200 µm is assumed (Baran and Labonnote 2007). The chosen values describing the Weibull statistics are also consis-tent with the values derived from independent cloud chamber measurements reported 20
in Neshyba et al. (2013).
To interpret the PARASOL measurements the scattering phase function is required. The bulk-averaged scattering phase function,hP11(θ)i, is given by the following equa-tion,
hP11(θ)i=
R
Csca q
P11 θ,q
n q
dq
R
Csca q
n q
dq (1)
25
where the vector (q) in Eq. (1) represents the elements of the ensemble model as a function of maximum dimension,n(q) is the F07 parametrized PSD, and Csca(q) is the
ACPD
14, 14109–14157, 2014Scattering phase function of cirrus and the atmospheric state
A. J. Baran et al.
Title Page
Abstract Introduction
Conclusions References
Tables Figures
◭ ◮
◭ ◮
Back Close
Full Screen / Esc
Printer-friendly Version Interactive Discussion
Discussion
P
a
per
|
Discus
sion
P
a
per
|
Discussion
P
a
per
|
Discussion
P
a
per
|
scattering cross-section of each of the ensemble model members. To generate the F07 PSDs, the IWC and in-cloud temperature are assumed to have the values of 0.01 gm−3 and−50◦C, respectively.
The bulk-averaged asymmetry parameter, hgi, is calculated using the following equation,
5
hgi=
R
g q
Csca q
n q
dq
R
Csca qn qdq (2)
where the parameters in Eq. (2) have been previously defined. Another parameter of importance in calculating the total cloud reflectance is the single-scattering albedo,ω0, which is the ratio of the scattered radiation to that totally attenuated in the hemisphere of all directions. Here, the wavelength of 0.865 µm is considered, at such a weakly 10
absorbing wavelength, the value ofω0will be close to unity.
The bulk-averaged volume extinction coefficient,hβexti, is calculated from the
follow-ing equation,
hβexti=
Z
Cext q
n q
dq (3)
where Cext(q) is the extinction cross-section of each member of the ensemble model, 15
calculated as a function of its maximum dimension.
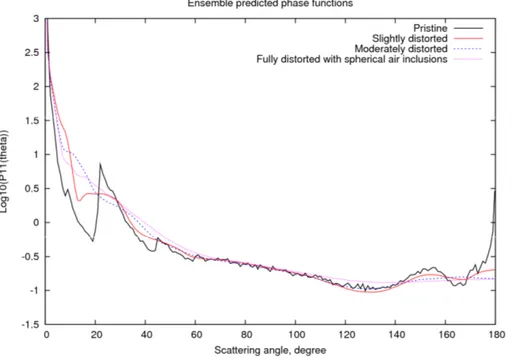
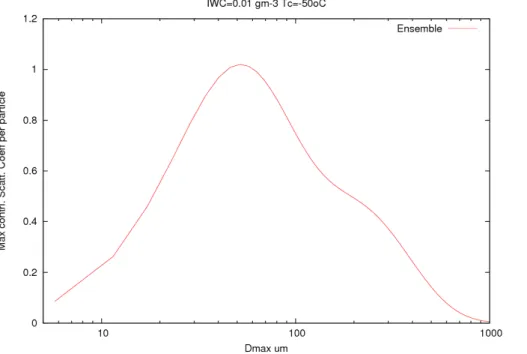
Figure 4 shows the bulk-averaged ensemble model predicted scattering phase func-tions, calculated at the wavelength of 0.865 µm, assuming distortion values of 0, 0.15 (slightly distorted), 0.25 (moderately distorted), and 0.4 plus spherical air bubble inclu-sions (fully distorted with spherical air bubble incluinclu-sions). The complex refractive index 20
of ice at 0.865 µm has the value of 1.304+2.400×10⁻⁷I, where I is the imaginary part of the index (Warren and Brandt, 2008). The total optical properties (i.e.,hgiand ω0)
ACPD
14, 14109–14157, 2014Scattering phase function of cirrus and the atmospheric state
A. J. Baran et al.
Title Page
Abstract Introduction
Conclusions References
Tables Figures
◭ ◮
◭ ◮
Back Close
Full Screen / Esc
Printer-friendly Version Interactive Discussion
Discussion
P
a
per
|
Discus
sion
P
a
per
|
Discussion
P
a
per
|
Discussion
P
a
per
|
above. The figure shows that the maximum contribution to the scattering cross-section occurs at a maximum dimension of about 50 µm. Defining the size parameter,x, as
πD/λ, whereλis the incident wavelength, gives a value of x of about 182. This value ofxmeans that the Monte-Carlo ray-tracing method is within the range ofxwhere the method is applicable (Yang and Liou 1996).
5
Figure 4 shows that as the distortion parameters are gradually increased, the halo and ice bow features gradually diminish, and for the most randomized case, the scat-tering phase function becomes featureless and almost flat at backscatscat-tering angles. At the scattering angles of relevance to this study, the figure shows that discrimination between the model phase functions should be possible using the viewing geometry of 10
PARASOL.
To retrieve the total reflectance using PARASOL, a radiative transfer model is re-quired, here the model developed by de Haan et al. (1986) is used and its application to PARASOL has been fully described by Labonnote et al. (2001). The radiative trans-fer model assumes a plane-parallel cloud, but it is fully inclusive of multiple scattering. 15
Also taken into account are layers of aerosol below the cloud and Rayleigh scattering above and below the cloud is also taken into account. At the wavelength of 0.865 µm, the PARASOL retrieval algorithm assumes that the sea surface has a reflectance value of 0.000612 and a wind speed of 7 ms−1; see Buriez et al. (2001) for further details about the PARASOL retrieval algorithm. In the next section, the retrieval methodology 20
is described.
4 Methodology
The methodology of retrieving the Spherical albedo using PARASOL multi-directional measurements of total reflectance has been previously described by (Doutriaux-Boucher et al., 2000; Buriez et al., 2001; and Labonnote et al., 2001), but a brief de-25
scription of the retrieval is given here. The total reflectance of the cloud is specified by the vertical volume extinction coefficient, the vertical extent of the cloud, and the
ACPD
14, 14109–14157, 2014Scattering phase function of cirrus and the atmospheric state
A. J. Baran et al.
Title Page
Abstract Introduction
Conclusions References
Tables Figures
◭ ◮
◭ ◮
Back Close
Full Screen / Esc
Printer-friendly Version Interactive Discussion
Discussion
P
a
per
|
Discus
sion
P
a
per
|
Discussion
P
a
per
|
Discussion
P
a
per
|
scattering phase function. The cloud optical depth is therefore given by the integral of the vertical extinction over the vertical depth of the cloud. Since the cloud is essentially over a non-reflecting surface, the only directional information is provided by the as-sumed scattering phase function. It has been previously shown by Doutriaux-Boucher et al. (2000) that there is a one-to-one relationship between the cloud optical depth 5
and the cloud spherical albedo (i.e., integral of the plane albedo over all incoming di-rections, where the plane albedo is a function of solar zenith angle alone), if the surface below the cloud is black. The cloud optical depth is retrieved, under the assumption of a plane-parallel homogeneous layer, by matching the simulated cloud reflectance to the measured cloud reflectance at each scattering angle. If the phase function were a per-10
fect representation of the cloud, then the retrieved cloud optical depth will be the same at each scattering angle. Therefore, the retrieved spherical albedo would also be the same at each scattering angle. If the assumed phase function were a poor represen-tation of the cloud, then this would result in a directional dependence on the spherical albedo, which would be unphysical. This retrieval methodology forms the basis of this 15
paper, and it has been applied by other studies that have utilized PARASOL measure-ments to test ice cloud scattering phase functions, see for example (Doutriaux-Boucher et al., 2000; Labonnote et al., 2001; Baran et al., 2001; Knapp et al., 2005; Baran and Labonnote 2006).
As previously stated, the retrievals of spherical albedo are performed on a pixel-by-20
pixel basis, and the data products derived from the PARASOL observations are only used if the following four conditions are met: (i) for each 6 km×6 km pixel the cloud fraction is unity, (ii) the total number of view angles ≥7, (iii) the difference between the minimum and maximum sampled scattering angle is greater than 50◦, and (iv) only pixels over the sea are considered. The total number of PARASOL pixels that meet 25
ACPD
14, 14109–14157, 2014Scattering phase function of cirrus and the atmospheric state
A. J. Baran et al.
Title Page
Abstract Introduction
Conclusions References
Tables Figures
◭ ◮
◭ ◮
Back Close
Full Screen / Esc
Printer-friendly Version Interactive Discussion
Discussion
P
a
per
|
Discus
sion
P
a
per
|
Discussion
P
a
per
|
Discussion
P
a
per
|
the model phase function were a perfect representation of the cloud. The retrievals of
S(θ) depend on the assumed scattering phase function, the vertical volume extinction coefficient andω0.
The averaged spherical albedo,hSi, for each pixel is defined by,
hSi= 1 N
j=N
X
j=1
Sj(θ) (4)
5
where N is the total number of viewing directions, which for the case considered in this paper is between 7 and 8. To find the phase function that best minimizes the spherical albedo differences, the root mean square error (rmse) is found for each pixel, which is given by
rmse= v u u u t
N
P
j=1∆
S2
N (5)
10
where in Eq. (5),∆S=hSi −S(θ), and the other terms have been previously defined. In the sections that follow, the model phase functions shown in Fig. 4 and the total optical properties given in Table 1 are applied to the PARASOL measurements, on a pixel-by-pixel basis, to retrieve the phase function that best minimises Eq. (5). Results 15
of this analysis are then used to explore possible relationships between ice crystal randomization and RHi.
5 Results
5.1 Validating the NWP model field of RHi
Before exploring the possible relationship between RHi and the scattering phase func-20
ACPD
14, 14109–14157, 2014Scattering phase function of cirrus and the atmospheric state
A. J. Baran et al.
Title Page
Abstract Introduction
Conclusions References
Tables Figures
◭ ◮
◭ ◮
Back Close
Full Screen / Esc
Printer-friendly Version Interactive Discussion
Discussion
P
a
per
|
Discus
sion
P
a
per
|
Discussion
P
a
per
|
Discussion
P
a
per
|
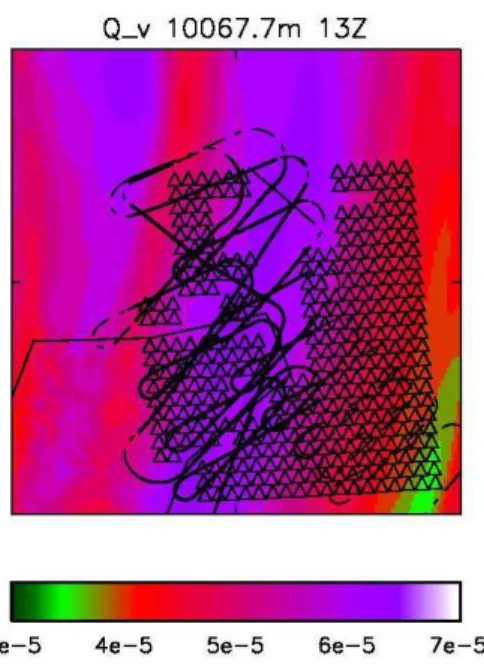
accurate for the purposes of this paper. Firstly, Fig. 6 shows the NWP model predicted water vapour mixing ratio field and the location of the PARASOL pixels, and the po-sition of the aircraft within that field. The aircraft popo-sitions were predominantly located around the areas of semi-transparent cirrus, with no cloud beneath, as shown by Fig. 1. Figure 6 shows that there is considerable variation in the water vapour field at about 5
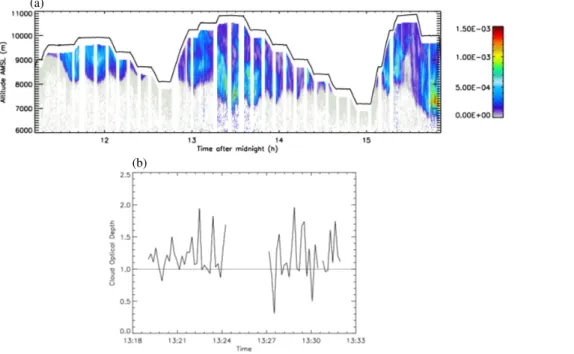
the cloud-top, around the North and East of Scotland. As a consequence of this varia-tion, there will be a sufficient change in the RHi field at the cloud-top as a function of position, to relate retrieval results to the model field. From Fig. 6 we note that the NWP model predicted the cloud-top to be in the vicinity of 10 km for the region of interest. Figure 7 (a) shows the aircraft-mounted lidar estimate of the volume extinction coef-10
ficient as a function of altitude, and the bottom panel shows the derived lidar optical depth as a function of time. Figure 7a shows that the lidar estimated cloud-top altitude was at about 10 km, at approximately 13:21 UTC, which is in good agreement with the NWP model prediction.
To validate the NWP model prediction of the RHi field use is now made of the
aircraft-15
mounted ARIES measurements, which are applied to obtain retrievals of RHi. The
re-trieval of RHi from the ARIES measurements is achieved using the Havemann-Taylor Fast Radiative Transfer Code (HTFRTC) (Havemann 2006; Havemann et al., 2009) and the retrieval method of Thelen et al. (2012). Moreover, the ARIES-based retrieval of RHw (relative humidity with respect to water) is validated against the dropsonde 20
measurements of RHw. The HTFRTC is a principal component based radiative
trans-fer model and is fully inclusive of the atmosphere and exact multiple scattering. The ARIES spectrum was averaged over 10 spectra and was de-noised using principal components, which act as a low-pass filter. For this case, European Centre for Medium-Range Weather Forecasting (ECMWF) atmospheric profiles are applied as the back-25
ACPD
14, 14109–14157, 2014Scattering phase function of cirrus and the atmospheric state
A. J. Baran et al.
Title Page
Abstract Introduction
Conclusions References
Tables Figures
◭ ◮
◭ ◮
Back Close
Full Screen / Esc
Printer-friendly Version Interactive Discussion
Discussion
P
a
per
|
Discus
sion
P
a
per
|
Discussion
P
a
per
|
Discussion
P
a
per
|
model background fields. The treatment of error by OE assumes that the errors are de-scribed by a Gaussian distribution. Here the background errors in the temperature, RH and IWC are assumed to be typically±0.4 K,±10 %, and±50 %, respectively. Given the errors, ARIES measurements, and simulated measurements using HTFRTC, OE uses a minimization procedure to find the most likely atmospheric state that best de-5
scribes the measurement set, given the retrieved parameters or state vector. Currently, the state vector in the HTFRTC retrieval method (Thelen et al., 2012) is composed of the temperature profile, the relative humidity profile, homogeneous cirrus IWC, surface temperature, and surface emissivity. The temperature and relative humidity profiles are retrieved at all 70 levels of the Met Office operational suite of models. The comparisons 10
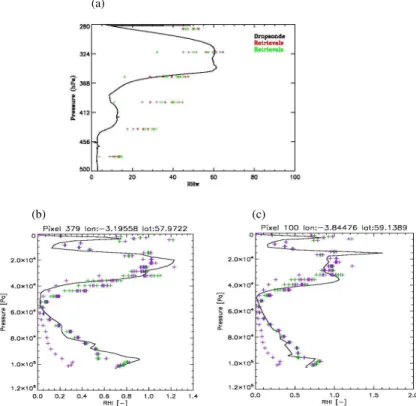
between the ARIES retrieval of RHwand the dropsonde measurements are shown in Fig. 8a. The ARIES retrieval of RHi and the NWP model prediction of RHi are shown
for two different locations in Fig. 8b and c.
Figure 8a shows that the ARIES-based retrieval of RHwin the presence of cirrus is in good agreement with the dropsonde measurements at the altitude of the cloud, where 15
the retrievals are represented by the plus signs. The two different colours represent the retrievals based on the two different aircraft runs above the cirrus that were previously described. Each of the runs was 10 min in length. There were approximately eight ARIES retrievals per run. Figure 8b shows the ARIES-based retrieval of RHi at the
latitude 57.97◦N and the longitude 3.195◦W, which corresponds to the lower left of 20
Fig. 6. The full line in the figure represents the NWP model predicted RHi profile,
and the retrievals are represented by the plus signs. The figure shows that the NWP model represents the vertical structure of RHi rather well, with little deviation from the retrievals. The model and retrievals show values of RHi reaching values of about
120 %. Figure 8c shows the same as Fig. 8b but at the latitude of 59.14◦N and longitude 25
3.84◦W, which corresponds to the upper left of Fig. 6. Figure 8c shows a similar result to Fig. 8b, but interestingly the model and retrieved RHi, at this particular location, are
less than 100 %. At a pressure of 1.50×10⁴Pa, there is a spike in the model RHi field,
but this is not supported by the retrievals and is probably due to numerical instability
ACPD
14, 14109–14157, 2014Scattering phase function of cirrus and the atmospheric state
A. J. Baran et al.
Title Page
Abstract Introduction
Conclusions References
Tables Figures
◭ ◮
◭ ◮
Back Close
Full Screen / Esc
Printer-friendly Version Interactive Discussion
Discussion
P
a
per
|
Discus
sion
P
a
per
|
Discussion
P
a
per
|
Discussion
P
a
per
|
at that level, caused most likely, by the very low values of the water vapour mixing ratio at that level. Figure 8b and c validates the NWP model prediction of RHi, and,
thus, this model can be used to compare against the PARASOL retrievals of ice crystal randomization. Moreover, the model predicted cloud-top and base are consistent with the lidar results shown in Fig. 7a. Figure 8b and c show that the NWP model predicted 5
cloud-top is at about 2.0×10⁴Pa (∼10 km), and the cloud-base is at about 4.0×10⁴Pa (∼7 km), respectively. The NWP model predicted cloud depth is therefore about 3 km, which is also in good agreement with the lidar derived maximum cloud depth shown in Fig. 7a at 13:21 UTC, when the aircraft was above the cloud-top.
5.1.1 Retrieval of ice crystal randomization and its relationship to RHi 10
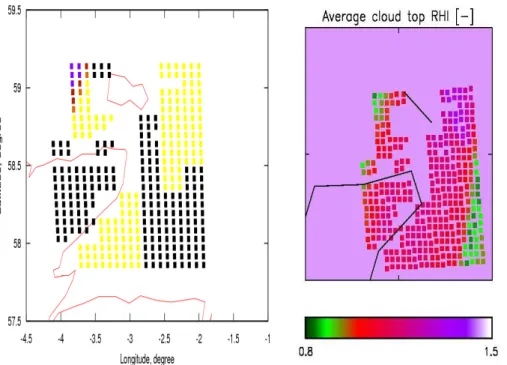
In this section, the methodology described in Sect. 4 is used to estimate the ensemble model phase function which best minimises the rmse of the spherical albedo diff er-ences on a pixel-by-pixel basis. The ensemble model phase functions used here were previously described in Sect. 3.1.1, and are shown in Fig. 4. The results from the phase function estimations per pixel are shown in Fig. 9a. The total number of retrievals shown 15
in Fig. 9a is 354; however, 190 of these retrievals contained no discrimination between ice crystal models. These null results are shown as black squares in the figure. A com-parison between Fig. 9a and Fig. 1 show that the null results generally occurred over land or in the presence of multi-layer cloud. The yellow squares in Fig. 9a correspond to the most randomized phase function (i.e., distortion=0.4 with spherical air bubble 20
inclusions), and the number of pixels associated with this colour is 152, which from the figure, is clearly the most common. However, 12 of the pixels shown in the top left of the figure are not associated with the most randomized phase function. Rather, these pixels were found to be associated with the pristine phase function (distortion=0), or slightly distorted (distortion=0.15), or moderately distorted (distortion=0.25) phase 25
ACPD
14, 14109–14157, 2014Scattering phase function of cirrus and the atmospheric state
A. J. Baran et al.
Title Page
Abstract Introduction
Conclusions References
Tables Figures
◭ ◮
◭ ◮
Back Close
Full Screen / Esc
Printer-friendly Version Interactive Discussion
Discussion
P
a
per
|
Discus
sion
P
a
per
|
Discussion
P
a
per
|
Discussion
P
a
per
|
and moderately distorted (distortion=0.25) ensemble model phase functions, respec-tively. Therefore, the results shown in Fig. 9 (a) indicate that on a pixel-by-pixel basis, the most randomized ice crystal model phase functions may not always be the best-fit to multi-angular total reflectance measurements. It is interesting to note here that, for the same pixels, the rmse values found for the 12 pixels with less randomized phase 5
functions were on average about 35 of the rmse values found for the most randomized phase functions.
Clearly, in the upper left-hand side of Fig. 9a, there must have been sufficiently strong backscattering features present in the spherical albedo measurements to discriminate between the most randomized and least randomized phase functions. Furthermore, 10
Baran et al. (2012) also found that, for a case of mid-latitude, very high IWC anvil cirrus at near to cloud-top, the PN measured averaged scattering phase function also exhibited strong backscattering features. Clearly, such findings of optical features on the scattering phase function of naturally-occurring ice crystals indicate the need for radiometric or in situ observations to sample the scattered angular intensities over 15
a more complete range of scattering angle than is currently possible. Measuring the forward and backscattering intensities alone is not sufficiently general (Baran et al., 2012). However, the most common retrievals shown in Fig. 9a are representative of the most randomized ice crystals and these have featureless phase functions. For the purposes of retrieving cirrus properties using global radiometric measurements, it is 20
most likely that featureless phase functions are still generally better at representing cirrus radiative properties than their purely pristine counterparts (Foot 1988; Baran et al., 1999, 2001; Baran and Labonnote, 2006; Baum et al., 2011; Cole et al., 2013; Ulanowski et al., 2013).
It is also of interest to note the change in the asymmetry parameter values shown in 25
Table 1. From the pristine ensemble model phase function to the most randomized en-semble model phase function the change in the asymmetry parameter is about 5 %. A change in the asymmetry parameter of 5 % is radiatively important as illustrated by the following example. Given that the instantaneous solar irradiance arriving at the Earth’s
ACPD
14, 14109–14157, 2014Scattering phase function of cirrus and the atmospheric state
A. J. Baran et al.
Title Page
Abstract Introduction
Conclusions References
Tables Figures
◭ ◮
◭ ◮
Back Close
Full Screen / Esc
Printer-friendly Version Interactive Discussion
Discussion
P
a
per
|
Discus
sion
P
a
per
|
Discussion
P
a
per
|
Discussion
P
a
per
|
top-of-atmosphere is about 1370 Wm−2. Under the assumptions of conservative scat-tering and a dark ocean below the cirrus, a change of 5 % in the asymmetry param-eter results in a difference of about 43 Wm−2 in the reflected solar irradiance back to space. This difference of 43 Wm−2 is very significant with regard to the energetics of the Earth’s atmosphere, and indicates why it is important to globally constrain values of 5
the asymmetry parameter (Baran, 2012; Ulanowski et al., 2013; Van de Diedenhoven et al., 2013).
Shown in Fig. 9b is the NWP model predicted RHi field at a cloud-top altitude of
10 km. On comparison with Fig. 9a, it can be seen from Fig. 9b, that the most random-ized phase functions (i.e, yellow squares) correspond to model pixels with RHi>100 %.
10
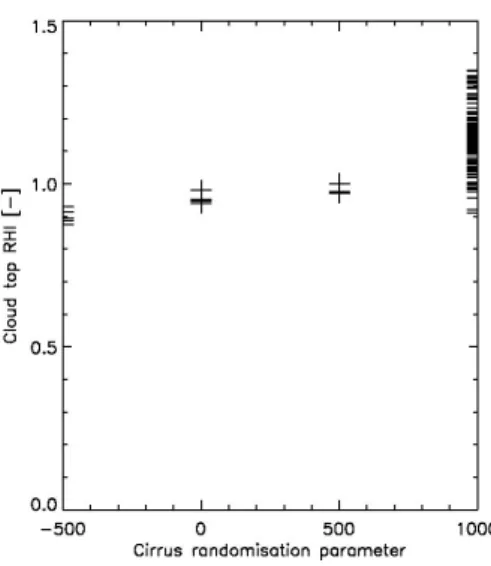
Conversely, the 12 pixels that are best represented by the pristine, slightly or moder-ately distorted phase functions correspond to NWP model pixels with RHi ∼ ≤100 %. Interestingly, at the cloud-top, there is a clear correlation between the NWP model RHi
field and the estimated ice crystal randomization. This correlation is demonstrated by Fig. 10. In that figure, the−500 values represent the pristine ice crystals (distortion=0), 15
whilst the values of 1000 represent the most randomized phase functions (distor-tion=0.4 with spherical air bubble inclusions). The slightly distorted and moderately distorted ensemble model phase functions are represented by the values of 0 and 500, respectively. The results presented in Fig.10 are broadly consistent with the findings of Gayet et al. (2011), which showed that the 22◦ halo feature was associated with 20
RHi≤100 %, whilst featureless phase functions were associated with RHi>100 %. Although the results presented in Fig. 10 demonstrate that, at least for this case and at the cloud-top, there is a correlation between the NWP RHi field and ice
crys-tal randomization. However, this correlation intrinsically assumes that the PARASOL cloud spherical albedo measurements occur at the cloud-top. In reality, solar radiation 25
ACPD
14, 14109–14157, 2014Scattering phase function of cirrus and the atmospheric state
A. J. Baran et al.
Title Page
Abstract Introduction
Conclusions References
Tables Figures
◭ ◮
◭ ◮
Back Close
Full Screen / Esc
Printer-friendly Version Interactive Discussion
Discussion
P
a
per
|
Discus
sion
P
a
per
|
Discussion
P
a
per
|
Discussion
P
a
per
|
To calculate the depth of penetrating radiation at 0.865 µm, a Monte-Carlo radiative transfer model has been used to represent the cirrus layer of relevance to this study. The Monte-Carlo model used here is fully described by Cornet al. (2009). A description of the Monte-Carlo model set-up and definition of the probability of penetration is given in Appendix A. The percent probability of penetration as a function of cloud depth, 5
and optical depth is shown in Fig. 11a and b. Results are shown in the figure for the backscattered and forward scattered radiation in the solar plane, respectively.
It should be noted here that the PARASOL retrievals of optical depth were generally greater than about 1, which is consistent with the independently derived lidar optical depth shown in Fig. 7b. The average value of the lidar optical depth was found to be 10
about 1.2. The lidar vertical profiles of optical depth were obtained when the aircraft was located above the cirrus, at an altitude of almost 11 km, which occurred during the times shown in the figure. There is a gap of about three minutes shown in Fig. 7b, which is the time required for the aircraft to turn and commence the second straight and level run.
15
Figure 11a and b shows that by a depth of 1 km from the cloud-top, the probability of penetration has been approximately halved, for optical depths greater than 0.3. By 1.5 km from the cloud-top, the probability of penetration is generally less than 40 %. The percent probability of penetration shown in Fig. 11a and b is similar. This is because the scattering phase function used in the Monte-Carlo calculations, at backscattering 20
angles, is largely invariant with respect to the scattering angle. This is simply because the scattering phase functions representing the most randomised ice crystals are flat and featureless at backscattering angles.
From Fig. 11a and b, it can be concluded that the PARASOL measurements of the total reflectance is biased towards the cloud-top, but they are not solely relatable to 25
the cloud-top. Therefore, to compare the NWP model RHi field against the estimated ice crystal randomization, the model field must be weighted, to obtain the vertically averaged model RHi field, which can then be compared against the estimated ice
crystal randomization. The vertical resolution of the NWP model is about 250 m, at
ACPD
14, 14109–14157, 2014Scattering phase function of cirrus and the atmospheric state
A. J. Baran et al.
Title Page
Abstract Introduction
Conclusions References
Tables Figures
◭ ◮
◭ ◮
Back Close
Full Screen / Esc
Printer-friendly Version Interactive Discussion
Discussion
P
a
per
|
Discus
sion
P
a
per
|
Discussion
P
a
per
|
Discussion
P
a
per
|
cirrus altitudes, and it can be seen from Fig. 11a and b that the weightings towards the cloud-top should clearly have the largest values. The number of model layers within 1.5 km of the cloud top, which is the distance from within the cloud where most of the reflected radiation originates, is about 5. The weightings applied to obtain the vertically averaged model RHi field were assumed to have the following values of 0.6, 0.3, 0.07,
5
0.02, and 0.01. The resulting correlation between the vertically-averaged NWP model RHi field and estimated ice crystal randomization is shown in Fig. 12.
The figure shows that even after vertically-averaging the RHi field, there is still a
discernible correlation between RHi and ice crystal randomization, which is not
signifi-cantly different from that shown in Fig. 10. The results presented in Fig. 12 do seem to 10
suggest that there should be a correlation between ice crystal randomization and RHi. The results presented within this paper are consistent with the in situ measurements of Gayet et al. (2011) and the laboratory studies of Ulanowski et al. (2013). Clearly, this paper has demonstrated that space-based remote sensing can also be used to investigate relationships between scattering properties of ice crystals and atmospheric 15
state parameters. If more general correlations can be found between the asymme-try parameter and the atmospheric state, then this will have important implications for parameterization of the asymmetry parameter in climate models, since then,g would become a function of RHi and temperature.
Climate model parameterizations of the asymmetry parameter are currently as-20
sumed to be invariant with respect to atmospheric state variables. It is desirable, as argued by Baran et al. (2014b), Baran (2012) and by Baran et al. (2009), to relate gen-eral circulation model prognostic variables directly to ice optical properties, so that the prognostic variables can then be directly related to space-based radiometric measure-ments. Only through directly relating general circulation model prognostic variables to 25