6524
Reconstruction of the Past Climate in Southern
Portugal from Geothermal Data
A. Correia* (University of Evora)
SUMMARY
The study of the past climate in the territory of mainland Portugal using geothermal data started in 1996. From an initial set of about 90 temperature logs obtained Portugal, eight were chosen as good for estimating ground surface temperature (GST) in the past. The main results from the analysis of the collected geothermal data show, on average, that there has been an increase of the atmosphere mean surface temperature of about 1 K since the middle of the nineteenth century. This conclusion agrees with the results obtained from the analysis of air temperature records that were obtained in the Lisbon weather station since 1856. With the objective of improving the reconstruction of GST history in Portugal one of the eight wells (the TGQC-1 well) was cased and is being used for repeated temperature logging since 1997. The results of the temperature measurements repetition indicate that the warming trend continues to the present day, accelerating in the last 10 to 15 years. Since 2005 a geothermal climate change
Introduction
Recent climate changing (warming or cooling) detected in most of the temperature logs obtained in boreholes all over the globe is related with changes in the energy budget at the Earth´s surface which result from an increasing or decreasing of the atmosphere temperature. The variations of the temperature at the surface of the Earth penetrate into the subsurface, with the high-frequency component of the temperature signal progressively filtered out. Therefore, the temperature field at depths that range from tens to several hundreds of meters contains valuable information on the history of the long term ground surface temperature without the effect of short-term variations. Temperature logs obtained by a precise temperature logging in boreholes can be used to reconstruct climate history over several past centuries (Cermak, 1971; Lachenbruch and Marshall, 1986; Lewis, 1992; Beltrami and Harris, 2001). Since 1996 there has been an attempt to study the evolution of the climate in the past for the territory of mainland Portugal. From a set of about 90 temperature logs obtained in wells all over Portugal seven were initially chosen as good for estimating ground surface temperature (GST) in the past (Correia and Safanda, 1999). They were logged from 1989 to 1991 and the depth range of the temperature logs varies between 155 m and 485 m. In 1997 another borehole (the TGQC-1 well) was found and prepared for paleoclimatic studies (Correia and Safanda, 2001). The climate reconstructions were performed using the functional space inversion (FSI) method of Shen and Beck (1992) and the main results reveal a warming of about 1 K since the second half of the nineteenth century to the middle of the 1990s, with and increase in the last 10 to 15 years. These results agree well with the air temperature series obtained since 1856 in the Lisbon weather station (Fig.1): both the GST reconstructions the air temperature records show a warming trend of about 1 K.
Figure 1 – (1) Mean annual air temperature recorded at the Lisbon meteorological station for the period 1856-1997; (2) Average temperature for the entire period; (3) Linear fit to the data set. 1840 1880 1920 1960 2000 time, years 15.0 16.0 17.0 18.0 te m per at ur e, d eg C 1840 1880 1920 1960 2000 15.0 16.0 17.0 18.0 1 2 3 Lisbon, surface air temperature
in the period 1856-1997 1 - annual means 2 - 1856-1997 mean 3 - linear fit
Results of the GST Reconstructions for the TGQC-1 Well
Since 1997 the borehole TGQC-1 has been used for GST reconstructions (Correia and Safanda, 2001). It is cased with PVC to a depth of 200 m and is being used on a regular basis for palaeoclimatic studies. For this well the functional space inversion (FSI) method for GST reconstruction of Shen and Beck (1992) was also used. Fig. 2 shows one of the temperature logs measured in the TGQC-1 well in 1997.
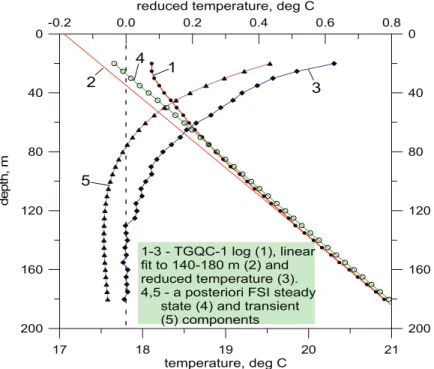
Figure 2 – Temperature log used for GST reconstruction for the TGQC-1 well (Correia and Safanda, 2001). The temperature log (curve 1) was obtained in 1997. The linear fit (curve 2) to its lowermost part (140-180m) was used as an estimate of the steady-state component of the subsurface temperature and the reduced temperature (curve 3) was calculated as the difference between curves 1 and 2. The steady-state (curve 4) and transient (curve 5) components obtained by FSI inversion of the temperature log are shown for comparison. The a priori geothermal model considered for the GST reconstruction for the TGQC-1 well consists of a homogeneous half-space with the following thermal characteristics: the thermal
conductivity is 2.8 Wm-1K-1, the thermal diffusivity is 1.3*10-6 m2s-1 and the radiogenic heat
production is 2*10-6 Wm-3. Since the FSI method allows incorporation of uncertainties in the
data as a priori standard deviations (SD), two a priori SD choices for thermal conductivity
and borehole temperatures (1 Wm-1K-1, 0.05 K) and (0.5 Wm-1K-1, 0.02 K) were used. In
addition, two scenarios for characteristic times of GST correlation were considered: (1) decreasing linearly from 500 to 100 years and (2) from 200 to 10 years in the time period 1000-1990 A.D. (and constant after 1990). The inferred histories (Fig. 3) differ slightly according to the inversion parameters used, but a warming of about 1K, starting at the end of
the 19th century and accelerating in the last 10-15 years, is a common feature to all curves.
The inversion is consistent with a long-term mean prior to the resolved GST history of the last 150-200 years that is similar to, or only slightly higher than (0.1-0.2 K), the GST just before the onset of the recent warming. The FSI method yields an a posteriori estimate of the
steady-17 18 19 20 21 temperature, deg C 0 40 80 120 160 200 dept h, m 0 40 80 120 160 200 -0.2 0.0 0.2 0.4 0.6 0.8
reduced temperature, deg C
1 2 3 4 5 1-3 - TGQC-1 log (1), linear fit to 140-180 m (2) and reduced temperature (3). 4,5 - a posteriori FSI steady state (4) and transient (5) components
state and transient components of the actual temperature log. Their comparison with the linear fit to the log and the reduced temperature is also shown in Fig. 2.
Figure 3 – Ground surface temperature reconstructions from the TGQC-1 temperature log (Fig. 2) by the FSI method for two a priori SD choices of thermal conductivity and measured temperature (1 Wm-1K-1, 0.05 K) or (0.5 Wm-1K-1, 0.02 K), and characteristic times of the GST
correlation decreasing linearly from 500 to 100 years and from 200 to 10 years in the time period 1000-1990 A.D.
Conclusions
The results of the calculations presented here confirm the ability of the FSI method to provide reliable GST history information that is consistent with air temperatures when the disturbing effects are negligible, even from a single borehole. Similar to the results presented by Correia and Safanda (1999), where the joint inversion of five temperature logs from southeast Portugal (about 50-100 km to the southeast of the TGQC-1 hole) were reported, the FSI of the TGQC-1 temperature log also reproduces the amplitude of the long-term warming, which appears to have started at the end of nineteenth century. However, contrary to the joint inversion of those five temperature logs, the inversion of the data from the TGQC-1 borehole indicates an accelerated warming in the last 10-15 years. Calculations show that: (1) the non-linear part of the TGQC-1 temperature log is consistent with the expected response of the subsurface temperature field to the surface air temperature changes measured in Lisbon since 1856 and displays about 1 degree Celsius warming since the end of the nineteenth century; and (2) the estimated long-term pre-observational mean of the surface air temperature in
Lisbon is a few tenths of degree Celsius higher than the average 15.6 oC of the 1856-1900
period and close to the average 16.0 oC of the whole observational period. Repeated logging
of the TGQC-1 borehole in the future has the potential for providing undisturbed data on the
1700 1800 1900 2000 time, year 16.5 17.0 17.5 18.0 18.5 te m pe rat ur e, d eg C 1700 1800 1900 2000 1 2 4 3
GST history yielded by TGQC-1 log for different a priori SDs and characteristic times of correlation 1,2 - (1.0W/(m.K),0.05K)
3,4 - (0.5W/(m.K),0.02K) 1,3 - correl. time 500-100 yrs 2,4 - correl. time 200-10 yrs
16.5 17.0 17.5 18.0 18.5
air and ground surface temperature coupling and on the response of the subsurface temperature field to the changing climate. Research on these two fields is underway.
Acknowledgements
The work presented in this overview is the result of a collaboration of the author and Dr. Jan Safanda of the Geophysical Institute of the Academy of Sciences of the Czech Republic. References
Beltrami, H. and Harris, R.N. (Eds.) [2001] Inference of climate change from geothermal data. Global and Planetary Change, Special Issue, 29 (3-4).
Cermák, V. [1971] Underground temperature and inferred climatic temperature of the past millennium. Palaeogeography, Palaeoclimatololgy, Palaeoecolology, 10, 1-19.
Correia, A. and J. Safanda [1999] Preliminary ground surface temperature history in mainland Portugal reconstructed from borehole temperature logs. Tectonophysics, 306, 269-275.
Correia, A. and J. Safanda [2001] Ground surface temperature history at a single site in southern Portugal reconstructed from borehole temperatures. Global and Planetary Change, 29, 155-165.
Lachenbruch, A.H. and B.V. Marshall [1986] Changing climate: geothermal evidence from permafrost in the Alaskan Arctic. Science, 234, 689-696.
Lewis, T. (Editor) [1992] Climatic change inferred from underground temperatures. Global and Planetary Change, Special Issue, 6 (2-4).
Shen, P.Y. and Beck, A.E. [1992] Paleoclimate change and heat flow density inferred from temperature data in the Superior Province of the Canadian Shield. Global and Planetary Change, 6, 143-165.