• Nenhum resultado encontrado

Adelantado Sánchez, Carlos

N/A
N/A
Protected

Academic year: 2018

Share "Adelantado Sánchez, Carlos"

Copied!
61
0
0

Texto

(1)

INSTITUTO SUPERIOR DE CIÊNCIAS DA SAÚDE

EGAS MONIZ

ERASMUS MUNDUS MASTERS IN FORENSIC SCIENCE

USE OF ASPARTIC ACID RACEMIZATION IN

FINGERPRINTS AS A MOLECULAR CLOCK

Work submitted by

Carlos Adelantado Sánchez

for obtaining the Master's Degree in Forensic Science

Work supervised by

Dr. Alexandre Quintas Rita Soeiro

(2)
(3)

Acknowledgments

This project would not have been possible without the money provided by the Education, Audiovisual and Culture Executive Agency (EACEA) and their help has been of invaluable appreciation. Many thanks to the European Commission for their support in terms of funding.

Thanks to my project supervisors, Dr. Alexandre Quintas and Rita Soeiro, for their assistance throughout these months.

I would also like to thank my parents, María Gracia Sánchez and Manuel Adelantado, for having been there every day to follow my progress during these two intense years.

Thanks, of course, to all my mates, specially from my cohourt (batch 2) but also to batch 1 and batch 3, in each of which I have had the chance to make excellent friends.

I do not forget all the teachers (main and guest lecturers) at the three institutions for having given me the fundamentals to become an attempt of forensic scientist, with a special mention to the nucleus organization (M Paz, Alex and Jose).

Many thanks to all the security personnel at Egas Moniz (Mr. Albino, Mr. Amaro, Mr. João, Mr. Pereira, Mr. Antão, Mr. Gonçalves, Mr. Fialho, Mr. Marcolino, Mr. Fernandes, Mr. Miguel, Mr. Duarte, Mr. Moura and Mr. Moisês) for kindly opening doors for me on weekends and bank holidays to come to work.

(4)

Certificate of originality

This is to certify that I am responsible for the work submitted in this thesis and that the work is original and not copied or plagiarized from any other source, except as specified in the acknowledgements and in references. Neither the thesis nor the original work contained therein has been previously submitted to any institution for a degree.

Signature:

Name: Carlos Adelantado Sánchez

(5)

Abstract

Aspartic acid is the chemical, amongst amino acids, whose racemization process is considered to be the fastest and the most reliable way to conduct an ageing study in some living-being tissues. Racemization is a natural-occurring event in which L-stereoisomer of aspartic acid is converted into D-L-stereoisomer in an equilibrium dependent on factors namely pH, environmental conditions and, most critically, on temperature.

The main objective of the current study is to assess the influence of temperature on kinetics of aspartic acid racemization and to implement this methodology in fingermarks. The hypothesis is that different starting points of deposition of a biological specimen will give rise to significant differences in L-/D- racemization after the sample has been heated, allowing to determine time since deposition of a fingerprint. In this way, it would be possible to find the time since build a molecular clock for fingerprints, consisting of time since deposition of fingermarks based on racemization degree of aspartic acid.

Firstly, a calibration curve was built within the concentrations range expected to be quantified in actual samples both with L-aspartic acid (L-Asp) and D-aspartic acid (D-Asp) separately, Gas Chromatography - Flame Ionization Detector (GC-FID) being the chosen technique and detection mode to set up the calibration experiments.

Secondly, L-aspartic acid standards were treated at different temperatures during different time periods and were analyzed by GC-FID with a chiral column, aimed for detecting D- isomer, providing with information about racemization rate of aspartic acid.

Eventually a downward trend was observed for L-Asp but not for D-Asp and a pseudo-rate constant could be calculated for the former, demonstrating that temperature degrades this chemical. Fingerprints study was not successful to determine aspartic acid racemization but a simple handling of them and an adequate, sensitive response of the chromatographic system could quantify racemization degree.

(6)

Figures list

Figure 1: Chemical composition and functional groups of aspartic acid ... 3

Figure 2: Chemical route of racemization followed by aspartic acid ... 5

Figure 3: General reaction of an amino acid with ECF ... 13

Figure 4: General scheme of trimethylsilyl reagents reaction with some functional groups ... 14

Figure 5: General profile of a chromatogram obtained when analyzing a derivatized L-Asp standard with BSTFA ... 20

Figure 6: General profile of a chromatogram for a L-Asp standard derivatized with ECF ... 22

Figure 7: Chemical structure and comparative between L-Asp and D-Norleucine... 23

Figure 8: Chromatogram peak areas of L-Asp vs. reaction time with ECF ... 24

Figure 9: General profile of a chromatogram when analyzing a L-Asp and a D-Asp standard by GC-FID and derivatization methodology with ECF ... 25

Figure 10: Calibration curves for L-Asp and D-Asp, both derivatized with ECF ... 277

Figure 11: Chromatograms to identify peaks for L-Asp and D-Asp ... 28

Figure 12: Decay trend of L-Asp as a high temperature is applied over time ... 29

Figure 13: D-Asp evolution over time when a high temperature is applied ... 31

(7)

Figure 15: Fingerprint injected into a GC-FID device with a chiral column . ... 355

Figure 16: Chromatograms comparison between a recent and an old fingerprint ... 36

Figure 17: GC-FID device with front view, inside view and injector ... 488

Figure 18: Chirasil L-Val column and HP-5 column installed in the GC-FID device .

499

(8)

Tables list

Table 1: Information about participants in the study ... 18

Table 2: Statistical results of calibration curves for L-Asp and D-Asp ... 266

Table 3: Exponential decay of L-Asp peak areas at different temperatures ... 30

(9)

Abbreviations list

AAR: Aspartic Acid Racemization

BSTFA: N,O-bis(trimethylsilyl)trifluoroacetamide CAS: Chemical Abstracts Service

CE: Capillary Electrophoresis D-Asp: D-Aspartic acid ECF: Ethyl Chloroformate FID: Flame Ionization Detector GC: Gas Chromatography HCl: Hydrochloric acid

HMW: Heavy Molecular Weight proteins HP-5: (5% Phenyl)-methylpolysiloxane

HPLC: High-Performance Liquid Chromatography kAsp: rate constant for aspartic acid racemization

L-Asp: L-Aspartic acid MS: Mass Spectrometry

PA-ACS: analytical grade reagents which meet specific requirements from American

Chemical Society

RPE: R-Phycoerythrin

(10)

Contents

Abstract ... iv

Figures list ... v

Tables list ... vii

Abbreviations list ... viii

1. Introduction ... 1

1.1. Fingerprints composition ... 1

1.2. Analytical determination of fingerprints components ... 2

1.3. Aspartic acid: chemistry and isomers ... 3

1.4. Aspartic acid racemization (AAR) process... 4

1.5. AAR monitoring in tissues – analytical determination ... 6

1.6. Influence of temperature on AAR process ... 12

1.7. Derivatization prior to GC analysis ... 13

1.8. Aims and objectives ... 14

2. Materials and methods ... 15

2.1. Reagents and solutions ... 15

2.2. Derivatization strategies ... 15

2.2.1. BSTFA ... 15

2.2.2. ECF... 16

2.3. Determination by Gas Chromatography - Flame Ionization Detector (GC-FID) 16 2.4. Method optimization ... 17

2.5. Calibration curve obtaining ... 17

2.6. Study of influence of temperature on racemization reaction ... 17

2.7. Fingerprints collection ... 18

2.8. Fingerprint samples handling ... 19

(11)

3. Results and discussion ... 20

3.1. Aspartic acid derivatization ... 20

3.1.1. Non-suitability of BSTFA-based methodology ... 20

3.1.2. Appropriate derivatization with ECF and reaction time optimization ... 21

3.2. Calibration results ... 26

3.3. Kinetic assessment of aspartic acid racemization ... 27

3.3.1. Influence of temperature on L-Asp degradation ... 27

3.4. AAR evaluation in fingermarks ... 35

3.5. Applications in forensic science ... 37

4. Conclusions ... 38

5. Recommendations for further work ... 39

6. References... 40

(12)

1. Introduction

1.1. Fingerprints composition

Fingermarks chemical composition involves a wide range of chemicals and determining them all is not an easy task since fingerprints come from different sources, not only sweat as can be thought (Girod et al., 2012). The five sources in which fingermarks substances can be present are: sebum secretions, apocrine sweat, eccrine sweat, epidermic substances and external environmental conditions (Weyermann et al., 2011).

To determine fingermarks compounds two main aspects must be considered: composition right after deposition and aged composition, that is, degradation of their chemicals as a function of time. It has also been proven that, after deposition of fingerprints onto a surface, there are several factors that affect their composition, namely donor, substrate of deposition, techniques utilized for enhancement and environmental conditions.

Age is one of the main aspects involved in composition change as children and adults do not house the same chemicals on their fingertips. (Antoine et al., 2010). It has been proven that fingerprints between younger and older individuals can be clearly distinguished because cholesterol, cholesteryl esters and long-chain fatty acids are abundant in children fingertips whilst adults show a very low amount of them, hence the first conclusion is that a decrease of these compounds is produced over time.

(13)

Light and temperature are amongst environmental factors that promote a degradation of compounds such as squalene and cholesterol, both of them being completely degraded in 15 days time at room conditions (Amorós et al., 2014) but squalene might not be detected in some cases when 9 days are passed, having stored it under light conditions (Archer et al., 2005).

1.2. Analytical determination of fingerprints components

Typically, chromatography is the most utilized technique to analyze chemicals present in fingerprints and several studies have been conducted to show the advantages and drawbacks of the different chromatographic modalities.

Gas Chromatography - Mass Spectrometry (GC-MS) is the desirable technique due to its extremely low sensitivity, its high resolution and its confirmatory power. On these lines, an innovative study by Croxton et al. (2006) introduced this combination and results provided with thirty-minute chromatograms in which 12 amino acids were fully identified as well as free fatty acids and all peaks belonging to them were separated with acceptable resolution.

(14)

However, High-Performance Liquid Chromatography (HPLC) has been proven to work in a suitable way and it can also be useful to detect certain kind of disease like beta-thalassemia (Khedr, 2010). A potential problem that HPLC shows is its time-consuming feature, which leads to long chromatograms, hence net time analysis becomes a drawback but a shorter time would promote coelution of some amino acids. HPLC can also be employed to seek degradation products of squalene, providing MS is the detection technique or even Thin-Layer Chromatography (TLC) could be useful for screening if there is a previous knowledge about the compounds (Mountfort et al., 2007).

1.3. Aspartic acid: chemistry and isomers

Aspartic acid is one of the 20 amino acids contained in proteins, classified into the group of amino acids with a negatively charged R group due to its carboxyl group in its lateral chain, which is ionized when pH exceeds its pKR (3.65) (Nelson and Cox, 2004).

Like all amino acids (with the exception of glycine), aspartic acid has one stereogenic center which is the reason of its two stereoisomers: L- and D-, the former being the one present in living organisms and subject to racemization during lifetime in a natural-occurring process.

CH2 N

H2 H

O OH

O OH

CH2

H NH2

O OH

O

OH

a b

(15)

D-aspartic acid (D-Asp), despite not being contained into proteins, is normally used as an enhancer of testosterone levels when taken as a supplement in any diet, especially for athletes to improve their performance, though it is not demonstrated either its efficacy or its health benefits (Ładyga and Obmiński, 2013).

1.4. Aspartic acid racemization (AAR) process

One peculiarity of this chemical is its reliability as an age marker when its racemization over time is taking place in every kind of tissues, which has led it to become an excellent compound to monitor when conducting an ageing process. According to a study performed by Arany and Ohtani (2010), aspartic acid seems to be the only appropriate to carry out this sort of experiments as other amino acids namely glutamate and alanine did not show results as accurate as aspartic acid provided, even when considering those amino acids from the soluble peptide fraction. Standard error for aspartic acid seems to be the lowest possible, making studies more precise when determining age. The reason behind this fact is that aspartic acid is the one more prone to suffer racemization, the rest being much slower in this particular sense.

A literature review by Zapico and Ubelaker (2013), summarizes chemical methods to simulate an ageing process with many types of tissues (namely dentin, cementum, white matter of brain or cartilage) performed by several authors in several studies, in which AAR is one of those methods. Another viewpoint is given by Ritz-Timme and Collins (2002), in which a good understanding can be gained about the importance of AAR as a chemical process occurring in proteins and as an effective age marker for proteins.

(16)

Figure 2:Chemical route of racemization followed by aspartic acid with all equilibriums taking place

between stereoisomers and conformations (taken from Cloos and Fledelius, 2000).

In 1958, Kuhn already mentioned a possible correlation between the interconversion of L- and D- stereoisomers of amino acids and the aging process, and several attempts have been recorded over decades as this is an issue that has appealed the interest of scientists since the seventies regarding forensic purposes.

Bada and Protsch (1973) introduced AAR as a suitable alternative to radiocarbon analysis to determine age of fossil bones providing that temperature is the same both for older and younger specimens. Aspartic acid had been demonstrated to show a racemization half-life of 15,000-20,000 years at 20 ºC and even other amino acids namely isoleucine and alanine were shown to racemize at a slower rate (100,000-150,000 years) at 20 ºC.

(17)

D-Asp once 60 years were passed and it was found that 8% of aspartic acid had been racemized to D- stereoisomer. Bada and Schroeder (1975) provided with kinetic aspects about AAR, this being a reversible, first-order reaction depending mostly on pH and temperature.

1.5. AAR monitoring in tissues – analytical determination

Since the seventies, many studies have been conducted to assess AAR in every kind of tissues in living beings and a chronological review can provide with a better understanding about breakthroughs and steps given forward in this field.

Masters et al. (1978) found AAR in human lenses and cataracts both in heavy molecular weight (HMW) and water-insoluble (WI) proteins from these tissues and it was found that D-Asp is directly related to formation of WI, which could be the previous step after aggregation of HMW.

Ritz et al. (1990) developed a method to assess AAR in dentin which presented the advantage of reproducibility, useful for further studies, and it was shown that no specialization in terms of knowledge and skills is needed when conducting an aging study based on AAR. Besides, influence of temperature was not considered as it is not supposed to change in the body of an individual but research should be intended to monitor any likely temperature change, specially regarding weather conditions.

(18)

Typically, aspartic acid is determined by chromatography, mostly GC and HPLC and the former being predominant, and there are many studies dealing with these modalities. Mörnstad et al. (1994) had already proven that reversed phase HPLC could become a suitable technique to quantify D-/L- ratio given a very high reliability of results that could made it comparable to GC in relative terms, taking into account that the latter is costlier even though provides better resolution and sensitivity high enough can be achieved with both. On these lines, Yekkala et al. (2006) developed a fluorescence detection-based HPLC method which was proven to provide with excellent results in terms of D-/L- ratios and correlation coefficients and a more recent study conducted by Garde et al. in 2010 also showed a high correlation between AAR and age, hence HPLC has indeed become an alternative. Sivan et al. (2012) were also utilizing it in order to test racemization process in elastin from both normal and degenerate tissue and D-Asp was found to accumulate to a greater extent in the former rather than in the latter.

As every chemical reaction, AAR is affected by environmental factors and one of them is indeed pH. Ohtani (1995) verified how pH can increase or decrease racemization rate and it was demonstrated, in the light of results, that temperature is a more critical factor that makes the reaction speed up as long as the former increases and there is also a dependence on pH which leads racemization to go faster as the environment is more basic, that is, when pH is higher. This happened to occur only in teeth since bones act as a buffer against pH changes and this study could not demonstrate the reason why an alkaline medium favours racemization, attributing it to differences in collagen composition.

(19)

Quality assurance is indeed an essential aspect to pay attention at and Ritz-Timme et al. (2000), from that concern, attempted to suggest an unified criteria in terms of personal skills and training, experimental design to foresee likely changes in the outcome and detailed guidelines are given when developing the methodology, from sample collection and handling to data treatment. Interlaboratory and intralaboratory assessments are also encouraged but, as this study concludes, these are general guidelines and any institution or laboratory has to apply them to their daily routine according to their necessities.

Ritz-Timme and Collins (2003) proposed an innovative, novel methodology to assess AAR in elastin from human skin, which supposed a promising step forward to determine this parameter in other tissue different from dentin, which had been the most used over last decades. Racemization process happened to occur more slowly than expected but the reason behind this event was the biochemical environment since collagen structure contains tertiary conformations which slow down the formation of succinimide, the limitant step in AAR. It was also demonstrated, in the light of results, that temperature is a critical factor when monitoring racemization as an increase of temperature denatures proteins, making structural complexity of them not a handicap any more for the process, therefore it evolves faster and it is not representative for a living organism. This is a fact also demonstrated in a research by Dobberstein et al. (2008). Hence temperature needs to be controlled every single time when conducting any kind of these experiments.

(20)

Ohtani et al. (2005) wanted to avoid the step of collecting dentin samples from individuals and they decided to attempt the same analyses normally performed on tooth but only with mixtures of aspartic acid standards and a previous knowledge of racemization in dental tissue. Results obtained were as reliable as the ones from a normal study in real tooth samples, hence this would be a good manner to conduct racemization monitoring when unknown samples are no available and there is a need of research.

Alveolar bone was the tissue selected by Ohtani et al. (2007) to study AAR and to separate both enantiomers in a very short period of time (only five minutes) by gas chromatography with a special column. However, the main limitation of this research was the difficulty of performing these analyses in women as the correlation for them was very low unlike in men, in which the method was proven to work appropriately for estimation of age.

(21)

Griffin et al. (2010) assessed the degree of AAR in enamel from different sorts of tooth as it had been shown that this extent was dissimilar in the mere enamel when analyzing dentin from other individuals. This study was not able to explain that variation as acid soluble fraction from enamel provided results which were not as precise as the ones obtained by Ohtani et al. (2005), in a research that was focused on an only individual with different teeth. Key factors of variations in AAR is the time of formation of the particular tooth and temperature since teeth more exposed to the environment will suffer a lower racemization process than the one located deeper, where temperature will be higher.

Thorpe et al. (2010) linked D-aspartic acid accumulation to horses’ collagen and non -collagenous proteins contained in two sorts of tendons and they established half-life of those proteins according to the content of D-Asp. It was also demonstrated how temperature affects AAR in tooth it is normally 33 ºC and, in tendon, is 37 ºC, which makes constant rate double according to calculations performed.

Alkass et al. (2010) introduced for the first time a combination of AAR and radiocarbon analysis to conduct an ageing process and results showed that both techniques did correlate and disadvantages of the former can be outweighed or masked by advantages of the latter. Hence it is possible to determine age of birth and age of death by merging results from both techniques though radiocarbon analysis shows better results as regards precision and accuracy, leaving a promising future for this methodology in coming years.

(22)

Besides, a series of experiments with bear dentine remains in Spanish caves were developed by Torres (de) et al. (2001 and 2002) and a reliable correlation between AAR and date of this kind of remains, caves being an appropriate place to sample since its environment is not subject to contamination and hence there is no decrease in racemization apart from the good, stable thermal conditions inside.

Arany and Ohtani (2011) achieved to perform AAR analysis in bloodstains, which had never been attempted at that point because the main tissues monitored had been tooth and bone, mainly. They obtained a kinetic model to predict racemization bearing in mind that this is a first-order chemical reaction (already demonstrated) and influence of temperature was studied, leading to excellent correlation results for statistical analyses. A novel, reliable methodology was pursued and achieved in this research.

Sakuma et al. (2012) were establishing a comparison between dentin tissue and whole-tooth samples to evaluate in which of them racemization was more noticeable and they found out that the latter shows a higher racemization degree, associating it with the presence of cementum, tooth pulp and enamel (not in dentine) but on the other hand correlation was weaker in whole tooth because of the excellent result in dentine. In spite of everything, both results were statistically significant.

(23)

Rajkumari et al. (2013) decided to conduct a study in order to assess the suitability of HPLC as an analysis technique to determine AAR in dentine tissue, already tested as the best sort of samples for this purpose. It was demonstrated that it is an alternative to GC and can provide results which permit to match racemization with age of an individual and it is remarkable to bear in mind that this process is not affected by gender and jaws in different teeth.

Onstott et al. (2014) have recently given a step forward to attempt to monitor AAR in planktonic organisms from South Africa, showing that they are indeed living organisms since their D/L ratio was very slow and protein turnover and replacement is still ongoing in that kind of cells. Very recently, Torres et al. (2014) have also presented a review about AAR in mammals from historical and prehistorical dates. The most important and factor was demonstrated to be sample handling, faster and more effective than in other methods already tested for aging studies such as electron spin resonance or

14

C.

1.6. Influence of temperature on AAR process

It has been thoroughly demonstrated that temperature is a critical factor on AAR and an increase in the former leads to an increase in the latter. Therefore, rate constant for racemization (kasp) will always raise as temperature does in every kind of tissue. There

are several studies showing that AAR speeds up as temperature increases and, as explained in section 1.5, racemization is enhanced when both a high tempreature and a high pH are applied (Ohtani, 1995). Luzanna et al. (1999) found an increase of 8 times in kAsp when temperature raised from 95 ºC to 120 ºC in fish material. Thorpe et al.

(2010) showed in collagen that kAsp is multiplied by a factor of 2 when temperature

(24)

1.7. Derivatization prior to GC analysis

Chloroformates have been utilized as successful derivatizing reagents in many cases, as stated in a review by Schurig (2011), due to their many advantages: reaction happening at room temperature, ease of method automation, not expensive and no large amounts of organic solvents employed. However, sometimes a by-product is formed depending on the alcohol used as a medium and combination of alcohol with chloroformate (Abe et al., 1996). This can be easily solved if the alkyl of the alcohol is more electronegative than the alkyl of the chloroformate. Another example of this effectiveness is given by Namera et al. (2002). Hušek (1998) summarized in a very explanatory way how chloroformates were employed in amine treatment and they became effective derivatizing reagents for amino acids analyses as well. This same author, in 1995, had already begun using ethyl chloroformate in a very first approach to this kind of organic solvents. Recently propyl chloroformate has been tested as an efficient solvent to recover up to nine amino acids in fingerprints with correlation coefficients higher than 0.96, which means an acceptable reproducibility although the rest could not be detected (Mink et al., 2013).

The reaction taking place between ethyl chloroformate and an amino acid is summarized in this way.

Figure 3: General reaction of an amino acid with ECF to obtain the corresponding volatile ester, in this

(25)

However, Stenerson (2011) showed that silylation is a good alternative in spite of sensitivity levels achieved, not as low as it could be expected. Another drawback, as seen later, is high temperature needed for the reaction to occur, which can lead to sample losses. This is the general reaction taking place for carboxyl and amine group with trimethylsilyl reagents.

Figure 4: General scheme of trimethylsilyl reagents reaction with some functional groups, producing

volatile substituted compounds to be analyzed by gas chromatography (applicable to aspartic acid) (taken

from http://www.wako chem.co.jp/english/labchem/product/analytical/chromato_v8/a45/index.htm).

1.8. Aims and objectives

(26)

2. Materials and methods

2.1. Reagents and solutions

All reagents are shown next together with purity and CAS number in brackets. Hydrochloric acid (37%, 7647-01-0) was obtained from Panreac (Barcelona - Spain), as well as pyridine PA-ACS (110-86-1). L-Asp (reagent grade ≥ 98%, 56-84-8), D-Asp (99%, 51186-58-4) and ethyl chloroformate (≥ 98% (GC), 541-41-3) were obtained from Sigma Aldrich (France, South Korea and Hungary, respectively). DL-norleucine (616-06-8) was supplied by Sigma Chemical CO (St Louis, USA) and BSTFA (99%, 25561-30-2) was obtained from Supelco (Bellefonte, USA). Carlo Erba group was in charge of providing chloroform RPE (67-66-3) from Rodano (Italy) and acetonitrile HPLC-plus gradient (200-835-2), from Chaussée du Vexin (Val de Reuil, France).

A 1 mg/mL stock solution of L-Asp and D-Asp were prepared in water separately and, from this one, three more diluted solutions of 15 µg/mL, 50 µg/mL and 100 µg/mL, all of them in hydrochloric acid (HCl) 0.1 M. Internal standard methodology was chosen for this research and the chemical acting as a internal standard was DL-norleucine, of which a solution 1 mg/mL in water was prepared.

2.2. Derivatization strategies

2.2.1. BSTFA

(27)

2.2.2. ECF

A methodology previously developed by Croxton et al. (2010) was adapted for this research. Three replicates for each of the three concentration levels together with a blank were prepared, hence 10 samples were analyzed by GC-FID. For every single calibration standard, 60 µL of the L-Asp in HCl 0.1 M were placed into a tube at each concentration, for the blank being only HCl 0.1 M with no L-Asp. 3 µL of the internal standard solution (DL-norleucine 1 mg/mL) were added to every single tube followed by a mixture of absolute ethanol, pyridine and ethyl chloroformate (ECF) 32:8:5 (v/v/v), manual stirring after adding the latter and 100 µL of chloroform (containing 1% ECF) were added to this mixture. Two phases were clearly observed after samples vortexed. 1 µL of the organic phase was collected and injected into the GC-FID system.

2.3. Determination by Gas Chromatography - Flame Ionization Detector (GC-FID)

An Agilent 7820A GC System was employed to conduct all analyses. This device is coupled to a Flame Ionization Detector and used a HP-5 column (325 ºC: 30 m x 320 µm x 0.25 µm) for standards and quantifying purposes and a chiral column Chirasil L-Val (200 ºC: 25 m x 250 µm x 0.12 µm) for stereisomers separation and ratio between them. Injection was manual with 1 μL of sample. Programme temperature in the oven was set up as follows: 60 ºC during 1 min, 35 ºC/min up to 290 ºC, holding 3 min and 40 ºC/min up to 300 ºC, with a total duration of 10.89 min for each chromatogram and splitless mode in the case of standards and calibration curve. For separation of stereoisomers the programme was amended as shown: isotherm at 60 ºC during 3 min to ensure a complete solvent elution, 20 ºC/min up to 140 ºC, holding 3 min on top, total duration being 10 min for each chromatogram and split 1:5 in this modality.

(28)

2.4. Method optimization

Method to be followed for the rest of the research was selected amongst BSTFA and ECF as derivatization reagents. Eventually the protocol was the same explained in section 2.2.2. However, agitation happened to be a critical factor and it was necessary to optimize reaction time with ECF. For this reason, different analyses were performed in such a way to allow the reaction to occur and three replicates at 0, 10, 20, 30, 40, 50 and 60 min after adding ECF were prepared, all of them at room temperature, only for 100 µg/mL of L-Asp. Reaction times were measured while stirring automatically at 600 rpm. Once these times were passed, 100 µ L of chloroform containing 1% ECF were added and 1 µL of the organic phase (at the bottom of the tube) was injected into the GC-FID.

2.5. Calibration curve obtaining

To obtain every single calibrator, the procedure mentioned in section 2.4 was followed, once reaction time with ECF was fixed (explained in section 3.1.2). Concentrations were chosen to be in the range of 30-180 µg/mL.

2.6. Study of influence of temperature on racemization reaction

(29)

2.7. Fingerprints collection

Beforehand, an approval was obtained from the ethical commission of this institution and nineteen donors were selected according to key factors such as gender, age and ethnicity. They were requested not to wash their hands one hour prior to collection in order to avoid lipids losses and hence any change on fingertips composition. They all had previously signed an informed consent form and all samples and information about donors were treated as anonymous, assigning a number to each donor. They were asked about age, ethnicity, diet followed, smoking habits, medication taken at that point and cosmetic employed on the collection day. Fingerprints were collected onto a sheet 2 cm x 2 cm in the following way: donors were asked to print once with each of their fingertips on the same surface in order to ensure a proper collection. Samples were collected during a whole evening and were kept individually in envelopes to treat them the following day.

Table 1: Information about participants in the study, separated by gender and taking into account information such as age, ethnicity, diet, smoking habits, medication taken currently and cosmetics applied

on the collection day.

Gender Age Ethnicity Diet Smoking Medication Cosmetics

Male 9 20-29 14 White 10 Omnivore 17 Y 2 Y 6 Y 7

Female 10 30-65 5 Black 5 Vegetarian

(no meat)

2 N 17 N 13 N 12

Middle

Eastern 1

South

Asian 1

Central /

South

(30)

2.8. Fingerprint samples handling

The day after collection, each sheet was cut in smaller pieces and introduced in an Eppendorf tube, in which 500 µL of HCl 6 M were added and every sample was heated at 80 ºC during 24 h. Afterwards, all the liquid content inside each tube was transferred to a new one, all tubes were opened, a bit of parafilm was attached on top and some holes were made by poking the parafilm. Tubes were frozen at -72 ºC during 2 h and, once this time was passed, they were placed into a lyophilizer to stay at vaccum pressure and -50 ºC overnight. The objective of this sample treatment was to denature proteins present in fingerprints and to enhance the presence of free amino acids, which is of interest to detect the presence of aspartic acid.

2.9. Statistical analyses

(31)

3. Results and discussion

3.1. Aspartic acid derivatization

3.1.1. Non-suitability of BSTFA-based methodology

It was noticeable that this procedure was not suitable for the purpose initially established since samples suffered losses partial or total losses. In principle, the reason could be the high temperature applied (100 ºC). In this sense, only 100 µg/mL of L-Asp were employed for assays where temperature was decreased down to 50 ºC and diverse experiences were conducted at different reaction times: 30, 90, 150 and 210 min, three replicates for each reaction time, showing similar problems later than 90 min, when samples began to evaporate. The advantage of this kind of samples is that they can be kept at very low temperatures with no damage in their composition, hence they were kept in a freezer since the GC-FID detector was not working properly in that particular day and they were injected the day after. Nonetheless, though not having complete vaporization of the earlier samples, they did not show any peak in the chromatograms, hence this was an indication that the reaction was not happening. This is a typical chromatogram when this methodology was followed.

(32)

Temperature was increased to 60 ºC and the experiment was repeated only at short times (15 min and 30 min) with three replicates for each reaction time and there were no sample losses but peaks in the chromatogram were absent, therefore the reaction was not occurring at any extent or so low that it was not detectable, showing chromatograms like the previous one shown above. It is also remarkable that solvents employed in this experimental procedure (BSTFA and acetonitrile) are extremely volatile by themselves (45-55 ºC and 81-82 ºC respectively) and they can begin evaporating at the temperatures applied for these experiments. However, it is already reported in literature (Stenerson, 2011; Schummer et al., 2009; Molnár-Perl and Kaltona, 2000) how this method works at high temperatures between 50 ºC up to 150 ºC and solvents are not lost because of the heat applied, so there is a further reason to explain the behaviour of the solution. React vials material might not have been appropriate for this experiment as it was expected that the mixture did not evaporate to any extent after being heated, hence another kind of vial or material should be used for this purpose.

3.1.2. Appropriate derivatization with ECF and reaction time optimization

(33)

Figure 6: General profile of a chromatogram for a L-Asp standard when applying ECF as a derivatization

reagent and manual agitation for a few seconds. Sample injected into a GC-FID device with a HP-5

column.

(34)

CH2 N

H2 H

O OH

O OH

CH2

H NH2

O OH

H H

C H3

a b

Figure 7: Chemical structure and comparative between L-Asp and D-Norleucine.

(35)

Figure 8:Bar graph plotting chromatogram peak areas of L-Asp vs. reaction time with ECF, samples

being analyzed by GC-FID with a HP-5 column.

Areas represent the amount of product originated from the derivatization reaction of L-Asp with ECF and it is reasonable to believe that, from 30 minutes and further ahead, there is no great increase in derivatized amino acid and peak areas will not raise to a great extent, hence reaction time was established in 30 minutes since the reaction was thought to last long enough to produce the maximum amount desired.

When the method was optimized with 30-min reaction, chromatograms obtained showed considerably less peaks than the previous ones commented and this was the methodology followed during the rest of the research. There were still more peaks than the two expected, hence it was necessary to analyze a blank to reject the rest of the peaks, corresponding to a still incomplete derivatization reaction of aspartic acid. An example of the chromatograms profile once methodology was optimized is shown below for both L-Asp and D-Asp.

0 10 20 30 40 50 60 70 80

0 10 20 30 40 50 60

A

re

a

(36)

Figure 9:General profile of a chromatogram when: (a) analyzing a L-Asp and (b) analyzing a D-Asp

standard by GC-FID with a HP-5 column, applying derivatization methodology with ECF. In (a) internal

standard (DL-norleucine) eluted at 6.446 min and L-Asp, at 7.015 min whereas in (b) internal standard

(DL-norleucine) eluted at 6.428 min and D-Asp, at 6.986 min. a

(37)

3.2. Calibration results

The initial idea was to build a calibration curve with a concentration range between 30 µg/mL and 180 µg/mL. However, calibration curve obtained showed a correlation coefficient which was not accurate enough to obtain a reliable calibration. In fact, error bars obtained were very wide at higher concentrations, next to 180 µg/mL. Besides, the lowest concentration could not be lesser than 30 µg/mL because the instrument was able to quantify it and probably at lower levels it would not be possible to obtain a peak, hence the range was narrowed, starting in 30 µg/mL and each point being separated 15 µg/mL. Results are shown next for both stereoisomers together with statistical results.

Table 2: Statistical results of calibration curves for L-Asp and D-Asp, following the general equation of a straight line (y=ax+b), together with correlation coefficient.

Stereoisomer a b R2

L-Asp 0.0078 -0.0232 0.9926

D-Asp 0.0202 0.0471 0.9926

0 0,1 0,2 0,3 0,4 0,5 0,6 0,7 0,8 0,9

0 20 40 60 80 100 120

A

re

a

s

ra

ti

o

Concentration (µg/mL)

(38)

Figure 10:Calibration curves for (a) L-Asp and (b) D-Asp, both derivatized with ECF, concentration

range between 30-105 µg/mL. Areas ratio (y axis) refers to quotient between area of aspartic acid into

area of internal standard (DL-norleucine), obtained by injecting all the calibrators into a GC-FID system

with a HP-5 column.

This calibration curve was intented to quantify L-Asp and D-Asp separately in fingerprints once both stereoisomers were identified in fingermarks but, as explained later on, these isomers could not be identified in fingerprint samples collected due to a likely failure of the chiral column aimed for separating the isomers or the non-sensitive feature of the GC-FID device utilized.

3.3. Kinetic assessment of aspartic acid racemization

3.3.1. Influence of temperature on L-Asp degradation

The main objective was to assess racemization degree of aspartic acid by obtaining the ratio between L- and D- isomers. The chiral column was used for this purpose and a split of 1:5 was selected in this case. The reason for choosing this modality and no splitless (as in the previous section) was that the two peaks expected to appear in chromatograms (D-Asp and L-Asp) were going to elute very close to each other. As

0 0,5 1 1,5 2 2,5

0 20 40 60 80 100 120

A

re

a

s

ra

ti

o

Concentration (µg/mL)

(39)

explained before, a high split guarantees narrow peaks but the split could not be very high for not losing more sample and hence the peaks expected.

Firstly, L-Asp and D-Asp, after being treated and derivatized as stated in previous sections, were injected to identify retention time of each of them and a blank to reject peaks not corresponding to both isomers.

Figure 11: Chromatograms acquired in order to identify peaks corresponding to (a) L-Asp (8.309 min) and (b) D-Asp (8.281 min). Samples injected into a GC-FID device with a chiral column.

a

(40)

After heating different L-Asp standards at 112 ºC, 116 ºC, 120 ºC, being derivatized and injected as explained in previous sections, it could be observed that a downward trend was followed by peak areas. This supports the kinetic behaviour of any chemical being degraded at high temperatures. Nonetheless, the main pitfall observed was that a decrease of L-Asp area was not accompanied by an increase of D-Asp area in the same chromatogram, hence isomers were studied separately. After obtaining peak areas and heights for L-Asp, an exponential decay was observed according to results presented next, both graphs and equations together with correlation coefficients.

Figure 12:Decay trend of L-Asp as a high temperature is applied over time. Peak area (a) and peak

height (b) were obtained after injecting several standards of this chemical into a GC-FID system with a

chiral column. 0 5 10 15 20 25 30 35 40 45 50

0 10 20 30 40

P e a k a re a Time (h) a 112 ºC 116 ºC 120 ºC 0 2 4 6 8 10 12

0 10 20 30 40

(41)

Tabla 3: Exponential decay of L-Asp peak areas at different temperatures after injecting standards of this chemical into a GC-FID system with a chiral column. Equation followed is .

Temperature (ºC) A x R2

112 51.887 -0.506 0.9865

116 23.863 -0.195 0.9729

120 14.074 -0.448 0.8509

Results are not very reliable as there was only one point for each temperature and time. It was not possible to analyze replicates of the standards due to a contamination of the chiral column, likely to have been with water coming from the aqueous phase of the tubes from which 1 µL of the organic phase (at the bottom) was injected. Therefore, a minimum of three replicates should be analyzed to improve the reliability of these results, which however show a clear degradation of L-Asp at a high temperature over time. Besides, starting point of this decay is more noticeable as long as temperature increases since it is easier to degrade more amount of L-Asp with higher temperature in a short time period.

(42)

Figure 13: D-Asp evolution over time when a high temperature is applied. Peak area (a) and peak height (b) are directly proportional to D-Asp concentration and were obtained after injecting several standards of

this chemical into a GC-FID system with a chiral column.

0 5 10 15 20 25 30 35 40 45 50

0 10 20 30 40

P e a k a re a Time (h) a 112 ºC 116 ºC 120 ºC 0 5 10 15 20 25 30

0 10 20 30 40

(43)

No trend was observed and it was not possible to predict the behaviour of this chemical with temperature. As explained in section 2.3, for this stage of the research a L-chiral column was utilized and the explanation of these unpredictable results might be related with a different sensitivity of a L-chiral column towards a D-isomer, because the latter seems to increase as time goes by when a high temperature is applied. If this happened, the reason for the good results with L-Asp would be explained because the column is very sensitive towards L- isomer and its decay could be monitored in a more reliable way. In the case of D-Asp a decay with temperature would be happening but the results showed an upward trend, probably related to an increase of L-Asp as D-Asp was decreasing and this isomer is more noticeable in the graph shown above. Another fact that needs to be considered is that these experiments, carried out at high temperatures, were intended to obtain chromatograms with two peaks corresponding to D- and L- isomer separately but actually this did not happen. A single peak at the same retention time was always appearing and this event might be explained with the low sensitivity that the GC-FID system achieves. With a more sensitive device (namely MS with any modality of mass analyzer) peaks would have been separated because a higher split could have been selected and this could have been promote narrower peaks, accompanied by an adequate separation of D- and L- aspartic acid isomers. Ratio between them could have been calculated and racemization assessment in fingermarks could have been achieved.

Thus L-Asp was the only isomer with which a kinetic study could be conducted and, bearing in mind that its racemization is a first-order reaction, the integrated equation will be: , [A] and [A]0 being concentrations at any time of the reaction

and at the starting point, respectively, k being the rate constant of the reaction (kAsp) and

t being time. Taking natural logarithms, the equation is converted into:

, which follows a trend of a straight line ( ), where is going to

be ln[A] and x is going to be time (t), in hours. As concentration data were not

(44)

Figure 14: Kinetic study of L-Asp decomposition at (a) 112 ºC (b) 116 ºC and (c) 120 ºC when different L-Asp standards were injected into a GC-FID system with a chiral column. ln (A) refers to natural

logarithm of peak areas for L-Asp. 0 0,5 1 1,5 2 2,5 3 3,5 4

0 5 10 15 20 25 30 35 40

ln ( A) Time (h) a 0 0,5 1 1,5 2 2,5 3 3,5

0 5 10 15 20 25 30 35 40

ln ( A) Time (h) b 0 0,5 1 1,5 2 2,5

0 10 20 30 40

ln

(

A)

Time (h)

(45)

Table 4: Determination of pseudo-rate constant for Asp after different peak areas were gathered for L-Asp standards injected into a GC-FID system with a chiral column.

Temperature (ºC) k' (h-1) R2

112 0.0365 0.8278

116 0.0209 0.9857

120 0.0519 0.9152

As commented for peak area graphs, three replicates should be injected and the chiral column should show an adequate response for them all. Pseudo-rate constant seemed to increase with temperature, a requirement always met in kinetics of any reaction, but the first value should have been lower than the second. Correlation coefficient of the former explains its non-reliability and perhaps a better correlation could have provided with a lower figure which supported a likely upward trend of k'.

(46)

3.4. AAR evaluation in fingermarks

Amongst fingerprints collected from the 19 individuals (referred in section 2.7) the first of them was injected and chromatogram acquired showed these results.

Figure 15: Fingerprint injected into a GC-FID device with a chiral column.

(47)

As those fingerprint samples were not going to provide with any results, an alternative methodology was tested: a fingerprint was collected on one particular day and was treated on the same day of collection and an old fingerprint, taken one year before, was recovered from its storage. HCl 0.1 M was applied to 'wash' the small sheets onto which fingerprints were deposited and two beakers were utilized to collect the HCl enriched in chemicals from these fingermarks. For each of both samples, 120 µL were taken and placed into a Eppendorf tube, then heated at 116 ºC during 24 h. All the content evaporated but 60 µL of HCl 0.1 M reconstituted the sample and ECF-based methodology was applied. Chromatograms are shown below.

Figure 16: Chromatograms comparison between (a) a recent fingerprint, taken on the same day, and (b) an older fingerprint collected one year ago. Samples injected into a GC-FID device with a chiral column.

a

(48)

Chromatograms profile seemed to be the same and the time period passed since collection of the old fingerprint until the new one was collected and treated. Hence it may lead the researcher to two inferences: 1) Storage of fingerprints gathered initially should have been more rigorous or 2) Sample handling failed when attempting to enhance the effects of aspartic acid as the compound to be seeked in fingerprints. The first deduction can be easily rejected as sample storage was very similar to the one applied by other researcher one year before the current study. The second reason might be justified with the simpler methodology applied for the old and the new fingerprint, thus sample treatment employed initially involved such a complexity that it was not possible to detect any chemical coming from the fingerprints collected.

Another reasoning that supports the non-influence of time passed between collection and handling is found in chromatogram profiles for both old and new fingerprints. The only factor that affected fingerprints composition was temperature (116 ºC) and, with a more sensitive device, it would be possible to quantify D- and L- isomers of aspartic acid since this high temperature will have speeded up the racemization process.

3.5. Applications in forensic science

(49)

4. Conclusions

An adequate calibration curve was obtained to quantify L- and D- isomers of aspartic acid but it was not possible to apply the methodology in fingerprint samples due to a failure of the chiral column when attempting to separate both isomers and the lack of a single-isomer internal standard.

AAR evaluation was not achieved in this study due to the non-adequate functioning of the chiral column employed, which did not provide with distinguishable peaks for both aspartic acid isomers. Instead, it was possible to conduct a kinetic study to predict the behaviour of L-Asp when temperature is increased and it was observed that a decay trend was maintained over time. A pseudo-rate constant was calculated but it was only based on peak area data and concentrations could have given a more accurate value of this kinetic constant. However, this rate constant gave an idea about the effect of high temperature on degradation of L-Asp, which did not happen with D-Asp since no trend was found according to results.

Because of the baseline fluctuations produced during the kinetic study, replicates were not injected and this is the reason behind the poor correlation coefficients obtained for the equations. Besides, no many points could be achieved and graphs are not very representative of trends found in the case of L-Asp.

(50)

5. Recommendations for further work

This is a preliminary methodology and further research is a necessity, a sensitive technique being the primary aspect to take into account. Since it was discovered and demonstrated, GC-MS has always been the desirable technique to analyze amino acids in fingerprints due to the high sensitivity it shows to detect and quantify them at the extremely low levels expected to be found in this kind of samples (in the region of hundreds of ng). Hence all fingerprint analyses should be performed on a GC-MS device thanks to its confirmatory power, which will provide with the identity of the compound, and to obtain a noticeable peak for aspartic acid.

Fingerprint collection shall consider more individuals to obtain more accurate and reliable results within each of the variables taken into account in this research (age, ethnicity, diet...). In this way a Principal Component Analysis (PCA) could be performed to evaluate differences in fingermarks composition across all the ethnic groups studied.

Aspartic acid is not the most abundant amongst amino acids present in fingerprints, therefore it would be advisable to conduct a fingermark aging study with special attention to the most predominant amino acids: serine, glycine and alanine, aspartic acid being the fourth in abundance. Their racemization will not be as fast as in the case of aspartic acid but they could be recovered to a greater extent, providing a suitable derivatization method is applied, due to their abundance.

(51)

6. References

Abe, I., Fujimoto, N., Nishiyama, T., Terada, K., & Nakahara, T. (1996). Rapid analysis of amino acid enantiomers by chiral-phase capillary gas chromatography. Journal of Chromatography A, 722, 221-227. doi: 10.1016/0021-9673(95)00506-4

Alkass, K., Buchholz, B. A., Ohtani, S., Yamamoto, T., Druid, H., & Spalding, K. L. (2010). Age Estimation in Forensic Sciences. Aplication of combined aspartic acid racemization and radiocarbon analysis. Mollecular & Cellular Proteomics, 9, 1022-1030. doi: 10.1074/mcp.M900525-MCP200

Amorós, B. G., & Puit (de), M. (2014). A model study into the effects of light and temperature on the degradation of fingerprint constituents. Science and Justice

(Article in Press). doi:10.1016/j.scijus.2014.04.006

Antoine, K. M., Mortazavi, S., Miller, A. D., & Miller, L. M. (2010) Chemical Differences Are Observed in Children’s Versus Adults’ Latent Fingerprints as a Function of Time. Journal of Forensic Sciences, 55 (2), 513-518. doi: 10.1111/j.1556-4029.2009.01262.x

Arany, S., & Ohtani, S. (2010). Age Estimation by Racemization Method in Teeth: Application of Aspartic Acid, Glutamate, and Alanine. Journal of Forensic Sciences, 55 (3), 701-705. doi: 10.1111/j.1556-4029.2010.01324.x

Arany, S., Ohtani, S., Yoshioka, N., & Gonmori, K. (2004). Age estimation from aspartic acid racemization of root dentin by internal standard method. Forensic Science International, 141, 127-130. doi: 10.1016/j.forsciint.2004.01.017

Arany, S., & Ohtani, S. (2011). Age estimation of bloodstains: A preliminary report based on aspartic acid racemization rate. Forensic Science International, 212, e36-e39. doi: 10.1016/j.forsciint.2011.05.015

Archer, N. E., Charles, Y., Elliott, J. A., & Jickells, S. (2005). Changes in the lipid composition of latent fingerprint residue with time after deposition on a surface.

(52)

Atherton, T., Croxton, R., Baron, M., Gonzalez-Rodriguez, J., Gámiz-Gracia, L., & García-Campaña, A. M. (2012). Analysis of amino acids in latent fingerprint residue by capillary electrophoresis–mass spectrometry. Journal of Separation Science, 35, 2994-2999. doi: 10.1002/jssc.201200398

Bada, J. L., & Schroeder, R. A. (1975). Amino Acid Racemization Reactions and their Geochemical Implications. Naturwissenschaften, 62, 71-79. doi: 10.1007/BF00592179

Bada, J. L., & Protsch, R. (1973). Racemization Reaction of Aspartic Acid and Its Use in Dating Fossil Bones. Proceedings of the National Academy of Sciences of the United States of America, 70 (5), 1331-1334. doi:10.1073/pnas.70.5.1331

Bright, N. J., Willson, T. R., Driscoll, D. J., Reddy, S. M., Webb, R. P., Bleay, S., Ward, N. I., Kirkby, K. J., & Bailey, M. J. (2013). Chemical changes exhibited by latent fingerprints after exposure to vacuum conditions. Forensic Science International, 230, 81-86. doi: 10.1016/j.forsciint.2013.03.047

Carolan, V. A., Gardner, M. L. G., Lucy, D., & Pollard, A. M. (1997). Some Considerations Regarding the Use of Amino Acid Racemization in Human Dentine as an Indicator of Age at Death. Journal of Forensic Sciences, 42 (1), 10-16. doi: 10.1520/JFS14062J

Cloos, P. A. C., & Fledelius, C. (2000). Collagen fragments in urine derived from bone resorption are highly racemized and isomerized: a biological clock of protein aging with clinical potential. Biochemical Journal, 345, 473-480. doi: 10.1042/0264-6021:3450473

Collins, M. J., Penkman, K. E. H., Rohland, N., Shapiro, B., Dobberstein, R. C., Ritz-Timme, S., & Hofreiter, M. (2009). Is amino acid racemization a useful tool for screening for ancient DNA in bone? Proceedings of the Royal Society B, 276, 2971-2977. doi: 10.1098/rspb.2009.0563

Croxton, R. S., Baron, M. G., Butler, D., Kent T., & Sears, V. G. (2006). Development of a GC-MS Method for the Simultaneous Analysis of Latent Fingerprint Components. Journal of Forensic Sciences, 51 (6), 1329-1333. doi: 10.1111/j.1556-4029.2006.00203.x

(53)

Dobberstein, R. C., Huppertz, J., Wurmb-Schwark (von), N., & Ritz-Timme, S. (2008). Degradation of biomolecules in artificially and naturally aged teeth: Implications for age estimation based on aspartic acid racemization and DNA analysis.

Forensic Science International, 179, 181-191. doi: 10.1016/j.forsciint.2008.05.017

Fernández, E., Ortiz, J. E., Pérez-Pérez, A. Turbón, D., Torres, T., & Arroyo-Pardo, E. (2009). Aspartic acid racemization variability in ancient human remains: implications in the prediction of ancient DNA recovery. Journal of Archaeological Science, 36, 965-972. doi: 10.1016/j.jas.2008.11.009

Garde, E., Frie A. K., Dunshea, G., Hansen, S. H., Kovacs, K. M., & Lydersen, C. (2010). Harp seal ageing techniques – teeth, aspartic acid racemization, and telomere sequence analysis. Journal of Mammalogy, 91 (6), 1365-1374. doi: 10.1644/10-MAMM-A-080.1

Girod, A., Ramotowski, R., & Weyermann, C. (2012). Composition of fingermark residue: A qualitative and quantitative review. Forensic Science International, 223, 10-24. doi: 10.1016/j.forsciint.2012.05.018

Griffin, R. C., Penkman, K. E. H., Moody, H., & Collins, M. J. (2010). The impact of random natural variability on aspartic acid racemization ratios in enamel from different types of human teeth. Forensic Science International, 200, 148-152. doi: 10.1016/j.forsciint.2010.04.005

Helfman, P. M., & Bada, J. L. (1975). Aspartic acid racemization in tooth enamel from living humans. Proceedings of the National Academy of Sciences of the United States of America, 72 (8), 2891-2894. doi: 10.1073/pnas.72.8.2891

Hušek, P. (1998). Chloroformates in gas chromatography as general purpose

derivatizing agents. Journal of Chromatography B, 717, 57-91. doi: 10.1016/S0378-4347(98)00136-4

Hušek, P. (1995). Simultaneous profile analysis of plasma amino and organic acids by

capillary gas chromatography. Journal of Chromatography B, 669, 352-357. doi: 10.1016/0378-4347(95)00115-Y

(54)

Kuhn, W. (1958). Possible relation between optical activity and aging. In: F. F. Nord (ed.) Advances in Enzymology and Related Subjects of Biochemistry. New York: Interscience Publishers, 1–29.

Ładyga, M., & Obmiński, Z. (2013). D-aspartic acid: biological role and potential

applications as dietary supplement in sport. Medicina Sportiva, 17 (4), 211-216. doi: 10.5604/17342260.1081300

Luzzana, U., Mentasti, T., Opstvedt, J., Nygård, E., Moretti, V. M., & Valfrè, F. (1999). Racemization Kinetics of Aspartic Acid in Fish Material under Different Conditions of Moisture, pH, and Oxygen Pressure. Journal of Agricultural and Food Chemistry, 47, 2879-2884. doi: 10.1021/jf9813438

Masters, P. M., Bada, J. L., & Zigler, J. S. (1978). Aspartic acid racemization in heavy molecular weight crystallins and water-insoluble protein from normal human lenses and cataracts. Proceedings of the National Academy of Sciences of the United States of America, 75 (3), 1204-1208. doi: 10.1073/pnas.75.3.1204

Matzenauer, C., Reckert, A., & Ritz-Timme, S. (2013). Estimation of age at death based on aspartic acid racemization in elastic cartilage of the epiglottis.

International Journal of Legal Medicine. doi: 10.1007/s00414-013-0940-6.

Mink, T., Voorhaar, A., Stoel, R., & Puit (de), M. (2013). Determination of efficacy of fingermark enhancement reagents; the use of propyl chloroformate for the derivatization of fingerprint amino acids extracted from paper. Science and Justice, 53, 301-308. doi: 10.1016/j.scijus.2013.04.008

Molnár-Perl, I., & Katona, Zs. F. (2000) GC-MS of Amino Acids as Their Trimethylsilyl/t-butyldimethylsilyl Derivatives: in Model Solutions III.

Chromatographia Supplement, 51, S-228-S-236. doi: 10.1007/BF02492811

Mörnstad, H., Pfeiffer, H., & Teivens, A. (1994). Estimation of Dental Age Using HPLC-Technique to Determine the Degree of Aspartic Acid Racemization.

Journal of Forensic Sciences, 39 (6), 1425-1431. doi: 10.1520/JFS13729J

(55)

Namera, A., Yashiki, M., Nishida, M., & Kojima, T. (2002). Direct extract derivatization for determination of amino acids in human urine by gas chromatography and mass spectrometry. Journal of Chromatography B, 776, 49-55. doi: 10.1016/S1570-0232(02)00075-2

Nelson, D. L., & Cox, M. M. (2004) Lehninger: Principles of Biochemistry. 4th edition. Madison: W. H. Freeman.

Nuevo, M., Meierhenrich, U. J., Muñoz Caro, G. M., Dartois, E., D’Hendecourt, L., Deboffle, D., Auger, G., Blanot, D., Bredehöft, J.-H., & Nahon, L. (2006). The effects of circularly polarized light on amino acid enantiomers produced by the UV irradiation of interstellar ice analogs. Astronomy and Astrophysics, 457, 741-751. doi: 10.1051/0004-6361:20042018.

Offele, D., Harbeck, M., Dobberstein, R. C., Wurmb-Schwark (von), N., & Ritz-Timme, S. (2007). Soft tissue removal by maceration and feeding of Dermestes sp.: impact on morphological and biomolecular analyses of dental tissues in forensic medicine. International Journal of Legal Medicine, 121, 341-348. doi: 10.1007/s00414-006-0116-8

Ohtani, S. (1995). Estimation of age from dentin by utilizing the racemization of aspartic acid: influence of pH. Forensic Science International, 75, 181-187. doi: 10.1016/0379-0738(95)01782-8

Ohtani, S., Yamamoto, T., Abe, I., & Kinoshita, Y. (2007). Age-dependent changes in the racemisation ratio of aspartic acid in human alveolar bone. Archives of Oral Biology, 52, 233-236. doi: 10.1016/j.archoralbio.2006.08.011

Ohtani, S., Abe, I., & Yamamoto, T. (2005). An Application of D- and L-aspartic Acid Mixtures as Standard Specimens for the Chronological Age Estimation. Journal of Forensic Sciences, 50 (6), 1-5. doi: 10.1520/JFS2005128

Ohtani, S., & Yamamoto, T. (2011). Comparison of Age Estimation in Japanese and Scandinavian Teeth Using Amino Acid Racemization. Journal of Forensic Sciences, 56 (1), 244-247. doi: 10.1111/j.1556-4029.2010.01545.x

(56)

Onstott, T. C., Magnabosco, C. Aubrey, A. D., Burton, A. S., Dworkin, J. P., Elsila, J. E., Grunsfeld, S., Cao, B. H., Hein, J. E., Glavin, D. P., Kieft, T. L., Silver, B. J., Phelps, T. J., Van Heerden, E., Opperman, D. J., & Bada, J. L. (2014). Does aspartic acid racemization constrain the depth limit of the subsurface biosphere?

Geobiology, 12 (1), 1-19. doi: 10.1111/gbi.12069

Poinar, H. N., Höss, M., Bada, J. L., & Pääbo, S. (1996). Amino Acid Racemization and the Preservation of Ancient DNA. Science, 272, 864-866. doi: 10.1126/science.272.5263.864

Poinsot, V., Gavard, P., Feurer, B., & Couderc, F. (2010). Recent advances in amino acid analysis by CE. Electrophoresis, 31, 105-121. doi: 10.1002/elps.200900399

Rajkumari, S., Nirmal, M., Sunil, P. M., & Smith, A. A. (2013). Estimation of age using aspartic acid racemisation in human dentin in Indian population. Forensic Science International, 228, 38-41. doi: 10.1016/j.forsciint.2013.02.021

Ritz, S., & Schütz, H.-W. (1993). Aspartic Acid Racemization in Intervertebral Discs As an Aid to Postmortem Estimation of Age at Death. Journal of Forensic Sciences, 38 (3), 633-640. doi: 10.1520/JFS13449J

Ritz, S., Schütz, H.-W., & Schwarzer, B. (1990). The extent of aspartic acid racemization in dentin: a possible method for a more accurate determination of age at death? Zeitschrift für Rechtsmedizin, 103, 457-462. doi: 10.1007/BF01263154

Ritz-Timme, S., & Collins, M. J. (2002). Racemization of aspartic acid in human proteins. Ageing Research Reviews, 1, 43-59. doi: 10.1016/S0047-6374(01)00363-3

Ritz-Timme, S., & Collins, M. J. (2003). Aspartic acid racemization: evidence for marked longevity of elastin in human skin. British Journal of Dermatology, 149, 951-959. doi: 10.1111/j.1365-2133.2003.05618.x

Imagem

Figure 1 :  Chemical composition and functional groups of L- (a) and D- (b) stereoisomers of aspartic acid.
Figure  2: Chemical  route  of  racemization  followed  by  aspartic  acid  with  all  equilibriums  taking  place  between stereoisomers and conformations (taken from Cloos and Fledelius, 2000).
Figure 3: General reaction of an amino acid with ECF to obtain the corresponding volatile ester, in this  way subject to analysis by gas chromatography (taken from Nuevo et al., 2006)
Figure  4:  General  scheme  of  trimethylsilyl  reagents  reaction  with  some  functional  groups,  producing  volatile substituted compounds to be analyzed by gas chromatography (applicable to aspartic acid) (taken  from http://www.wako chem.co.jp/engli
+7

Referências

Documentos relacionados

portanto está bastante equilibrado (12/13) O texto escrito aparece quando, de facto, faz sentido, e se adequa aquilo que estamos a fazer e a produção oral que, no fundo, acaba

Os contributos de Slade, Way, Heathcote e de outros autores viriam a fundamentar substancialmente a criação de companhias de teatro para a infância completamente

The results of this study contribute to the literature of entrepreneurship in education, and other related fields, by providing rigorous evidence on the reliability and validity of

Pattern recognition of the GC×GC-FID chromatograms was performed by parallel factor analysis (PARAFAC) and it was successfully applied for the differentiation of these

Para completar a minha missão, recorro aos estudos de Carl Gustav Jung, Claude Lévi-Strauss, Joseph Campbell e outros especialistas

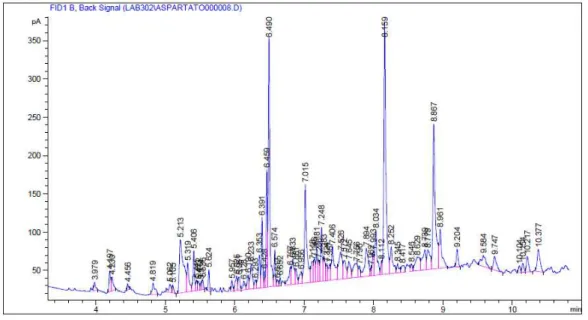
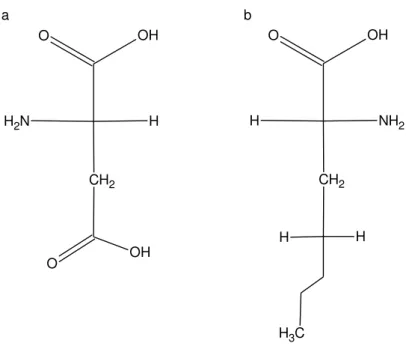
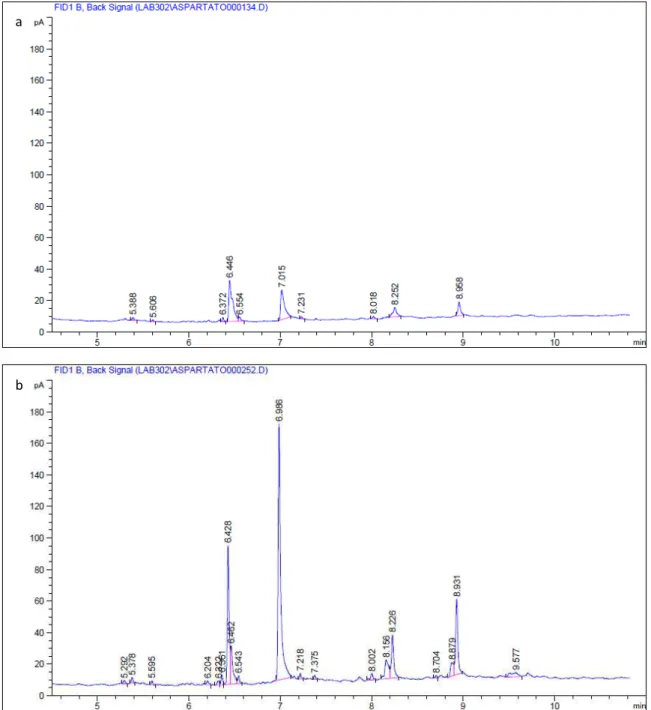
Samples from lung and liver of Balb-C isogenic allergic pneumonitis bearing mice, treated with the same extract, were analyzed through GC-FID, and the fatty acid content

So, the aim of this work is to perform HPLC-DAD fingerprint analyses in “chapéu- de-couro” samples collected in different sites from Mato Grosso and Mato Grosso do Sul states, and

Samples were taken for rotavirus identification on day zero (recruitment to study), and monthly thereafter for one year (in addition to samples taken during acute diarrhea episodes