ACPD
14, 21709–21748, 2014Spatio-temporal variations in PM10
concentrations over Seoul
S. Seo et al.
Title Page
Abstract Introduction
Conclusions References
Tables Figures
◭ ◮
◭ ◮
Back Close
Full Screen / Esc
Printer-friendly Version
Interactive Discussion
Discussion
P
a
per
|
Discus
sion
P
a
per
|
Discussion
P
a
per
|
Discussion
P
a
per
|
Atmos. Chem. Phys. Discuss., 14, 21709–21748, 2014 www.atmos-chem-phys-discuss.net/14/21709/2014/ doi:10.5194/acpd-14-21709-2014
© Author(s) 2014. CC Attribution 3.0 License.
This discussion paper is/has been under review for the journal Atmospheric Chemistry and Physics (ACP). Please refer to the corresponding final paper in ACP if available.
Spatio-temporal variations in PM
10
concentrations over Seoul estimated
using multiple empirical models together
with AERONET and MODIS data collected
during the DRAGON-Asia campaign
S. Seo1,*, J. Kim1, H. Lee1,2, U. Jeong1, W. Kim1, B.N. Holben3, S. Kim4, C.H. Song5, and J. Lim6
1
Institute of Earth, Astronomy, and Atmosphere, Brain Korea 21 Plus Program, Department of Atmospheric Sciences, Yonsei University, Seoul, Republic of Korea
2
Department of Spatial Information Engineering, Pukyong National University, Busan, Korea
3
NASA Goddard Space Flight Center, Greenbelt, MD, USA
4
School of Earth and Environmental Sciences, Seoul National University, Seoul, Korea
5
Department of Environmental Engineering, GIST, Gwangju, Korea
6
National Institute of Environmental Research, Inchon, Korea
*
ACPD
14, 21709–21748, 2014Spatio-temporal variations in PM10
concentrations over Seoul
S. Seo et al.
Title Page
Abstract Introduction
Conclusions References
Tables Figures
◭ ◮
◭ ◮
Back Close
Full Screen / Esc
Printer-friendly Version
Interactive Discussion
Discussion
P
a
per
|
Discus
sion
P
a
per
|
Discussion
P
a
per
|
Discussion
P
a
per
|
Received: 30 June 2014 – Accepted: 5 August 2014 – Published: 25 August 2014
Correspondence to: J. Kim ([email protected])
ACPD
14, 21709–21748, 2014Spatio-temporal variations in PM10
concentrations over Seoul
S. Seo et al.
Title Page
Abstract Introduction
Conclusions References
Tables Figures
◭ ◮
◭ ◮
Back Close
Full Screen / Esc
Printer-friendly Version
Interactive Discussion
Discussion
P
a
per
|
Discus
sion
P
a
per
|
Discussion
P
a
per
|
Discussion
P
a
per
|
Abstract
The performance of various empirical linear models to estimate the concentrations of surface-level particulate matter with a diameter less than 10 µm (PM10) was evaluated
using Aerosol Robotic Network (AERONET) sunphotometer and Moderate Resolution Imaging Spectroradiometer (MODIS) data collected in Seoul during the Distributed
Re-5
gional Aerosol Gridded Observation Network (DRAGON)-Asia campaign from March to May 2012. An observed relationship between the PM10 concentration and the aerosol optical depth (AOD) was accounted for by several parameters in the empirical models, including boundary layer height (BLH), relative humidity (RH), and effective radius of the aerosol size distribution (Reff), which was used here for the first time in empirical
10
modeling. Results show the strong influence of BLH andReff on the PM10 estimates,
while the role of RH was negligible during the campaign period when, in general, RH was lower than in other seasons. A large spatial dependency of the empirical model performance was found by categorizing the locations of the collected data into three different site types, which varied in terms of the distances between instruments and
15
source locations. When both AERONET and MODIS datasets were used in the PM10 estimation, the highest correlations between measured and estimated values (R=0.76 and 0.76 using AERONET and MODIS data, respectively) were found for the resi-dential area (RA) site type, while the poorest correlations (R=0.61 and 0.68 using AERONET and MODIS data, respectively) were found for the near source (NS) site
20
type. Significant seasonal variations of empirical model performances for PM10
esti-mation were found using the data collected at Yonsei University (one of the DRAGON campaign sites) over a period of 17 months including the DRAGON campaign period. The best correlation between measured and estimated PM10concentrations (R=0.81)
was found in winter, due to the presence of a stagnant air mass and low BLH conditions,
25
ACPD
14, 21709–21748, 2014Spatio-temporal variations in PM10
concentrations over Seoul
S. Seo et al.
Title Page
Abstract Introduction
Conclusions References
Tables Figures
◭ ◮
◭ ◮
Back Close
Full Screen / Esc
Printer-friendly Version
Interactive Discussion
Discussion
P
a
per
|
Discus
sion
P
a
per
|
Discussion
P
a
per
|
Discussion
P
a
per
|
concentrations (R=0.54) was found in spring, due to the influence of the long-range transport of dust to both within and above the BLH.
1 Introduction
Atmospheric aerosols are known to play an important role in not only air quality but also climate change (Kaufman et al., 2002; WHO, 2005; IPCC, 2013). In terms of air quality,
5
surface-level aerosol concentrations have been found to be strongly associated with impaired visibility (Baumer et al., 2008) and adverse effects on human health, such as respiratory and cardiovascular diseases (Pope et al., 2002; Kappos et al., 2004; Brook et al., 2010; Brauer et al., 2012). Therefore, several ground-based aerosol mon-itoring networks, such as the Interagency Monmon-itoring of Protected Visual Environments
10
(IMPROVE; http://vista.cira.colostate.edu/improve/), and the EPA’s State and Local Air Monitoring Stations (SLAMS; http://www.epa.gov/ttn/amtic/slams.html), have been in-stalled and operated to further understand the spatial and temporal variability of the chemical and physical characteristics of aerosols (Wang and Christopher, 2003).
However, due to the spatial limitations of in-situ measurements, the coordination
15
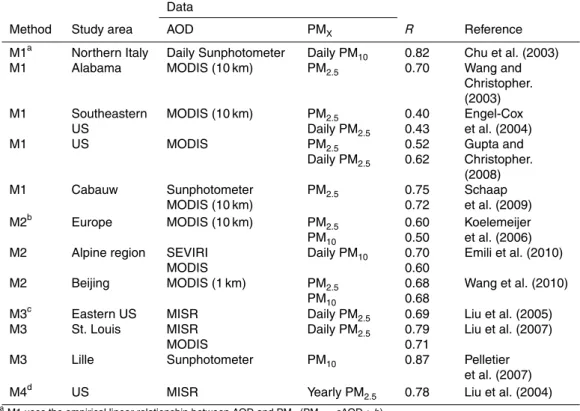
of dense networks of multiple sites is required to monitor spatial variations in sur-face air quality in certain areas. To overcome the spatial limitations of such in-situ measurements, additional efforts have been made to estimate surface air quality from satellite measurements. Table 1 summarizes the implementation of several different approaches that have been used to derive surface particulate matter (PM)
concentra-20
tions using aerosol optical depth (AOD) measurements obtained from sunphotometer and satellite instruments. An empirical linear model using only AOD as a predictor for PM estimation showed correlation coefficients between measured and predicted PM2.5 of 0.2–0.75 (Chu et al., 2003; Wang and Christopher, 2003; Engel-Cox et al.,
2004; Gupta and Christopher, 2008; Schaap et al., 2009). When the additional effects
25
ACPD
14, 21709–21748, 2014Spatio-temporal variations in PM10
concentrations over Seoul
S. Seo et al.
Title Page
Abstract Introduction
Conclusions References
Tables Figures
◭ ◮
◭ ◮
Back Close
Full Screen / Esc
Printer-friendly Version
Interactive Discussion
Discussion
P
a
per
|
Discus
sion
P
a
per
|
Discussion
P
a
per
|
Discussion
P
a
per
|
2010; Wang et al., 2010), correlations between measured and predicted PM2.5 were further improved when compared with correlations obtained from linear models using only AOD. A multiple linear regression model between measured and predicted PM2.5
concentrations in urban areas yielded a correlation of 0.71 (Liu et al., 2007). Spatial distributions of PM2.5can also be estimated by applying the ratio of AOD to PM2.5, as
5
calculated from chemical transport models (CTM), such as the Goddard Earth Observ-ing System-Chemistry (GEOS-CHEM) transport model and the Community Multiscale Air Quality (CMAQ) model (Liu et al., 2004; van Donkelaar et al., 2010). These previous studies have demonstrated the strong possibility of deriving surface PM concentrations from AOD data.
10
However, if we are to further improve and validate PM estimates, additional physical parameters should be considered as inputs into the empirical models, so as to obtain accurate estimates of PM concentrations from AOD data. Additionally, the effects of var-ious environmental characteristics on the relationship between PM and AOD, as well as spatial and temporal variations in this relationship, need to be investigated,
espe-15
cially in complex urban regions which include aerosol particles generated from various industrial and residential sources. Despite the need to monitor the rapidly changing PM concentrations in megacities with large populations and many sources of pollution, only a small number of studies have been conducted, especially in Asia, and the num-bers of ground-based PM monitoring stations in these studies has been limited (Kumar
20
et al., 2007; Guo et al., 2009). In addition to limitations based on sample size, obtaining accurate estimates of PM from AOD data has proved difficult in Asia on account of the complexity of the aerosol compositions derived from both natural and anthropogenic sources, particularly during the spring (Kim et al., 2007; Lee et al., 2010a).
In an effort to address these problems, the present study uses aerosol
measure-25
ACPD
14, 21709–21748, 2014Spatio-temporal variations in PM10
concentrations over Seoul
S. Seo et al.
Title Page
Abstract Introduction
Conclusions References
Tables Figures
◭ ◮
◭ ◮
Back Close
Full Screen / Esc
Printer-friendly Version
Interactive Discussion
Discussion
P
a
per
|
Discus
sion
P
a
per
|
Discussion
P
a
per
|
Discussion
P
a
per
|
valuable datasets, with well-coordinated measurements made in areas where aerosol concentrations are highly variable in space and time, and dependent on sources and other factors. The DRAGON campaigns have been conducted in urban and indus-trial areas, including Washington D.C., San Joaquin Valley of California, and Houston metropolitan region of Texas. By using the campaign datasets obtained from the dense
5
coverage of both column and surface-level aerosol measurements, assessments of surface-level PM concentrations based on remote sensing observations can be sub-stantially improved, especially in spring.
The purpose of this study is to investigate the relationship between AOD and PM concentrations in Seoul, one of the largest megacities in northeast Asia, using the
10
DRAGON-Asia campaign dataset. The detailed objectives of this study are: (1) to es-timate PM10 concentrations using AOD data from both ground- and satellite-based measurements in a megacity, with additional consideration of the various parameters within the empirical models, and to thereby evaluate derived PM concentrations; (2) to identify the spatial variability of the empirical model performance at different types of
15
measurement site; and (3) to investigate the seasonal variability of the performance of each model. Based on this study, it is expected that PM10 estimations using
ground-based and satellite-derived AOD data will become an effective approach to monitoring air quality over large spatial domains, especially in complex urban areas.
2 Measurements during the DRAGON-Asia campaign
20
The study area, Seoul, is a megacity located in a downwind region of northeast Asia, in which air quality is often affected by both pollutants transported over long distances from continental interior and locally generated aerosol. The present study used the col-umn aerosol optical properties measured at 10 Aerosol Robotic Network (AERONET) sites in Seoul, as well as those obtained by a dense mesoscale network of
ground-25
con-ACPD
14, 21709–21748, 2014Spatio-temporal variations in PM10
concentrations over Seoul
S. Seo et al.
Title Page
Abstract Introduction
Conclusions References
Tables Figures
◭ ◮
◭ ◮
Back Close
Full Screen / Esc
Printer-friendly Version
Interactive Discussion
Discussion
P
a
per
|
Discus
sion
P
a
per
|
Discussion
P
a
per
|
Discussion
P
a
per
|
centrations were also measured at 10 sites operated by a national air quality monitoring network during the campaign (http://www.airkorea.or.kr).
2.1 Column AOD and surface PM measurements
The AERONET sunphotometers (http://aeronet.gsfc.nasa.gov/index.html), which pro-vide aerosol optical and microphysical properties based on direct sun and diffuse sky
5
measurements (Holben et al., 1998), have been widely used as references for mea-surements from different satellite platforms. The AOD and the Angstrom exponent (AE) can be retrieved from direct sun measurements in several spectral bands, usually be-tween 340 and 1020 nm (Holben et al., 1998). Diffuse sky measurements, which are performed at a minimum of four wavelengths (440, 670, 870, and 1020 nm), use an
10
inversion method to provide detailed aerosol properties, such as the size distribution, phase function, single scattering albedo, refractive index, etc. (Holben et al., 1998; Dubovik and King, 2000). The AOD at 550 nm was obtained from AERONET level 2.0 direct sun measurements (cloud-screened and quality assured) at seven sites, and level 1.5 products (cloud-screened) at three sites. In addition to the AERONET
15
AOD, the effective radius for the total (fine and coarse modes) size distribution obtained from the inversion product was also used to represent the aerosol size information in the empirical regression models (Dubovik and King, 2000). Although cloud-screened AERONET data were used, additional cloud screening was performed for further qual-ity control using the cloud amount data provided by the Korea Meteorological
Admin-20
istration (KMA; http://www.kma.go.kr) and the attenuated backscattering signal mea-sured from the two-wavelength Mie lidar located at Seoul National University (SNU). A cloud-free sky condition was defined as a cloud amount of less than 20 % (cf. Ogun-jobi et al., 2004) and no detections of strong scattering peaks of lidar meausurements due to clouds. AOD measurements from the Moderate Resolution Imaging
Spectrora-25
ACPD
14, 21709–21748, 2014Spatio-temporal variations in PM10
concentrations over Seoul
S. Seo et al.
Title Page
Abstract Introduction
Conclusions References
Tables Figures
◭ ◮
◭ ◮
Back Close
Full Screen / Esc
Printer-friendly Version
Interactive Discussion
Discussion
P
a
per
|
Discus
sion
P
a
per
|
Discussion
P
a
per
|
Discussion
P
a
per
|
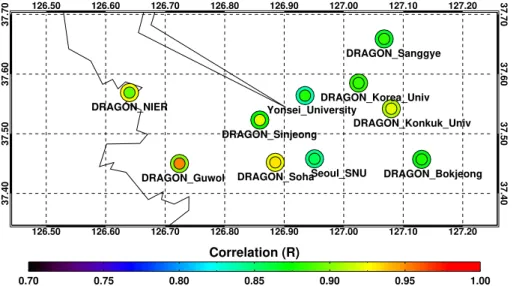
criteria of the MODIS 550 nm AOD products collected at spatial resolutions of 10 and 30 km were tested and compared with averaged AERONET 550 nm AOD measure-ments within±30 min of the satellite overpassing time. As shown in Fig. 2, the MODIS and AERONET AOD data are highly correlated, showing a correlation coefficient (R) greater than 0.85 at most AERONET sites during the DRAGON-Asia campaign. At
5
all AERONET sites except the DRAGON_NIER station, higher correlations between AERONET and MODIS data were found for MODIS resolutions of 10 km than for those with MODIS resolutions of 30 km.
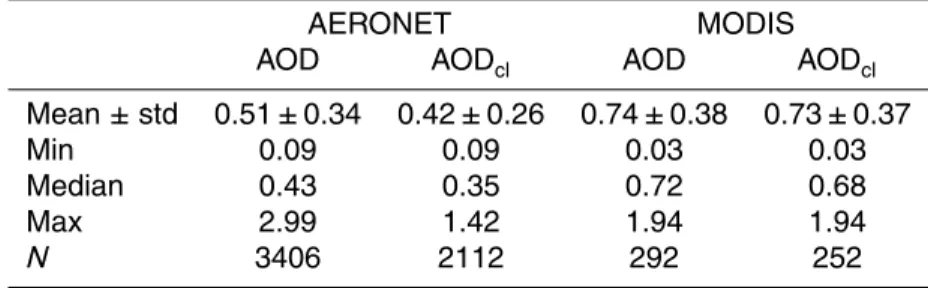
The MODIS AOD data at a 10 km resolution at nadir (“Optical_Depth_Land _And_Ocean”) obtained from MODIS collection 5 aerosol products were also screened
10
out when the MODIS cloud fraction over land (“Cloud_Fraction_Land”) was higher than 0.5 or the cloud amount from the KMA was higher than 20 %. Table 2 shows a sta-tistical summary of the AERONET and MODIS AOD data that were available at the measurement sites for the entire campaign period before and after additional cloud screening. The maximum AERONET AOD was reduced by 1.57 (from 2.99 to 1.42)
15
after additional cloud screening, while that of MODIS did not change. The mean and median AERONET AOD values were also reduced after cloud screening, and those of MODIS changed slightly. Also, the number of datasets after cloud screening was reduced by approximately 38.0 %, and the reduction in the available MODIS data after cloud screening was 13.7 %.
20
Hourly averaged PM10 concentrations, measured routinely at 10 national air
qual-ity monitoring sites, were used during the DRAGON-Asia campaign. The PM10
con-centrations were measured by a beta (β)-ray absorption method using a PM10 Beta Gauge (model PM10B.G, W&A Inc.), which operates on the premise that the
absorp-tion of beta-rays increases in proporabsorp-tion to the number of particles collected in the filter
25
(Hauck et al., 2004).
To investigate the relationship between columnar AOD and surface-level PM10, the
dis-ACPD
14, 21709–21748, 2014Spatio-temporal variations in PM10
concentrations over Seoul
S. Seo et al.
Title Page
Abstract Introduction
Conclusions References
Tables Figures
◭ ◮
◭ ◮
Back Close
Full Screen / Esc
Printer-friendly Version
Interactive Discussion
Discussion
P
a
per
|
Discus
sion
P
a
per
|
Discussion
P
a
per
|
Discussion
P
a
per
|
tance of approximately 4.5 km) were used. On the other hand, the MODIS AOD data, which were measured at different spatial grid resolutions, were extracted within a max-imum distance of 0.2◦ of the PM10 measurement sites. The AERONET and MODIS
AOD were both temporally collocated within±30 min of the hourly PM10measurement
time.
5
2.2 Meteorological measurements
Meteorological data were used to investigate the relationship between AOD and PM10
concentrations. The attenuated backscatter coefficient at 532 nm, measured by the two-wavelength Mie lidar located at Seoul National University (http://www-lidar.nies. go.jp/Seoul/), was used to calculate the hourly BLH using the automated wavelet
co-10
variance transform (WCT) method (Brooks, 2003). The WCT method was applied to backscattered lidar signals at heights above 300 m from the surface to avoid the prob-lem of uncertainty in lidar overlap (Campbell et al., 2002). Figure 3 shows an example of temporal variation in the BLH obtained by application of the WCT method.
In addition to the BLH, other meteorological data such as temperature, relative
hu-15
midity, cloud amount, and wind speed and direction were obtained from hourly mea-surements at a KMA weather observation station in Seoul (37.57◦N, 126.97◦E). All meteorological data within ±30 min of the PM10 observation time were used for this
investigation.
3 Methodology
20
3.1 Relationship between column AOD and surface PM concentration
ACPD
14, 21709–21748, 2014Spatio-temporal variations in PM10
concentrations over Seoul
S. Seo et al.
Title Page
Abstract Introduction
Conclusions References
Tables Figures
◭ ◮
◭ ◮
Back Close
Full Screen / Esc
Printer-friendly Version
Interactive Discussion
Discussion
P
a
per
|
Discus
sion
P
a
per
|
Discussion
P
a
per
|
Discussion
P
a
per
|
as:
AOD=π H
Z
0 ∞ Z
0
Qext(m,r,λ)n(r,z)r2drdz (1)
whereQis the unitless extinction efficiency influenced by the refractive index (m), parti-cle radius (r), and wavelength (λ), and wheren(r,z) is the size distribution representing the number of aerosols at corresponding height (z) with a radius (r) and H is the top
5
height for the integration.
The PM10 concentration, which is the mass concentration of surface-level aerosols with diameters less than10 µm in dry conditions, is given by:
PM10=
4 3πρ
5 Z
0
r03n(r0)dr0 (2)
whereρis the particle mass density andr0is the dry aerosol radius. With the
assump-10
tion of a homogeneous aerosol distribution within the BLH, the integration from the surface up to the TOA can be simplified by multiplying by the BLH. Also, the ambient environmental condition can be converted into the dry condition by using the particle hygroscopic growth factor,f(RH). By combining Eqs. (1) and (2), the PM10 concentra-tion can be expressed as:
15
PM10=
AOD BLH·f(RH)
4ρReff
3hQexti (3)
where the effective radiusReffand the average of the extinction efficiency over the size distributionhQextiare defined as
Reff= R
r3n(r)dr
R
r2n(r)dr,hQexti= R
r2Qext(r)n(r)dr
R
ACPD
14, 21709–21748, 2014Spatio-temporal variations in PM10
concentrations over Seoul
S. Seo et al.
Title Page
Abstract Introduction
Conclusions References
Tables Figures
◭ ◮
◭ ◮
Back Close
Full Screen / Esc
Printer-friendly Version
Interactive Discussion
Discussion
P
a
per
|
Discus
sion
P
a
per
|
Discussion
P
a
per
|
Discussion
P
a
per
|
In Eq. (3), various physical parameters are involved in the relationship between AOD and PM10.The PM10concentration is proportional to AOD,Reff, and particle mass den-sity ρ; on the other hand, PM10 is inversely proportional to BLH, f(RH), and hQexti.
Among these parameters, BLH andf(RH) have been used as parameters in empirical models to estimate PM concentrations using AOD data, as described in Table 1. On
5
the other hand, parameters such asρ,Reff, andhQextihave been rarely included in em-pirical models. In the present study, the effective radius of the aerosol size distribution was included for the first time as an additional parameter in the empirical models. The empirical models, and the parameters considered in those models, are described in detail in Sect. 3.2.
10
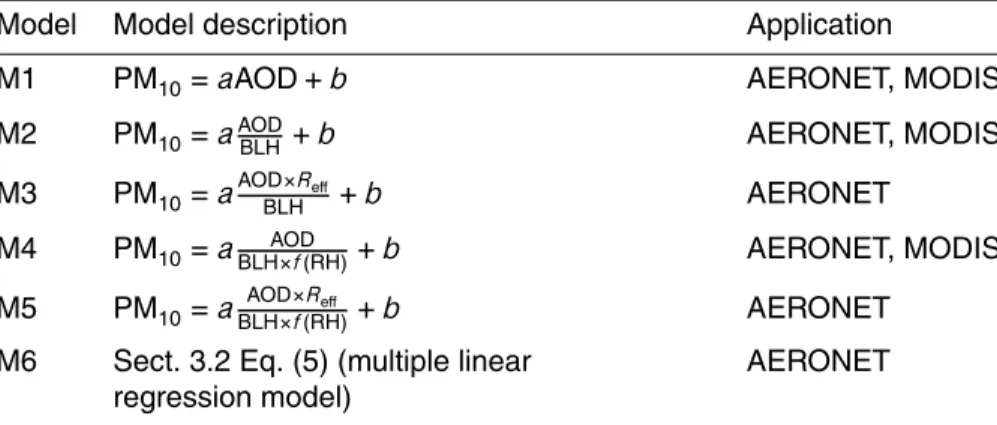
3.2 Description of empirical linear models for PM10 estimation
Table 3 presents a summary of the various models used in this study. Models M1 to M5 are empirical models based on the relationship between AOD and PM concentration, as described in Sect. 3.1, whereas M6 represents a multiple linear regression model. Among the empirical models, M1, M2, and M4 have been used in previous studies (e.g.,
15
Chu et al., 2003; Wang and Christopher, 2003; Engel-Cox et al., 2004, 2006; Koelemei-jer et al., 2006; Gupta and Christopher, 2008; Schaap et al., 2009; Emili et al., 2010; Wang et al., 2010). Model M1 includes only AOD as a predictor of the PM10 concen-tration, while M2 additionally includes BLH to consider the aerosol vertical extension. The vertical correction on AOD is represented in M2 by dividing AOD by BLH, with the
20
assumption that aerosols within the boundary layer are homogeneously mixed. Model M4 corrects for RH by using an aerosol hygroscopic growth factor termf(RH) which represents the effects of aerosol hygroscopic growth caused by variations in relative humidity, in addition to the parameters in M2. In this study, f(RH) values were based on experimental data obtained near the Beijing mega-city during the spring (Pan et al.,
25
ACPD
14, 21709–21748, 2014Spatio-temporal variations in PM10
concentrations over Seoul
S. Seo et al.
Title Page
Abstract Introduction
Conclusions References
Tables Figures
◭ ◮
◭ ◮
Back Close
Full Screen / Esc
Printer-friendly Version
Interactive Discussion
Discussion
P
a
per
|
Discus
sion
P
a
per
|
Discussion
P
a
per
|
Discussion
P
a
per
|
addition to the parameters in M2 to account for the size of aerosol particles. Model M5 reflects all parameters, including AOD,f(RH), BLH, and the effective radius, as shown in Table 3. The effective radius of the aerosol size distribution for the total mode, which was used in M3 and M5, was obtained from AERONET inversion products (Dubovik and King, 2000; Dubovik et al., 2000).
5
In addition to the simple empirical models (M1–M5), a multiple linear regression (MLR) model was used to determine PM10 concentrations as a function of eight diff er-ent parameters associated with PM estimation:
PM10
=exp (β0)×(AOD)βAOD(BLH)βBLH(AE)βAE (4)
×exp
βloc(Location)+βWS(WS)+βWD(WD)+βRH(RH)+βTemp(Temp)
10
This MLR model of Eq. (4) can be log-transformed into a simpler form of linear regres-sion as shown in Eq. (5).
ln
PM10
=β0+βAODln (AOD)+βBLHln (BLH)+βAEln (AE)+βloc(Location) (5)
+βWS(WS)+βWD(WD)+βRH(RH)+βTemp(Temp)
15
The dependent variable in Eq. (5) is the logarithm of the hourly PM10 concentration
measured at the PM monitoring sites. The independent variables include aerosol op-tical properties such as AOD and AE, various meteorological measurements such as BLH, temperature (Temp), and wind speed (WS), and two categorical variables: type
20
of measurement site (Location) and wind direction (WD). To represent the effect of aerosol size on PM10 concentration, AE was used as a variable in the MLR model
in-stead ofReff, because the size of theReffdataset (N=713) was considered inadequate as compared with that available for AE (N=2112); thus, the use of AE improves the performance of the MLR model and increases the credibility of the model results.
Mea-25
ACPD
14, 21709–21748, 2014Spatio-temporal variations in PM10
concentrations over Seoul
S. Seo et al.
Title Page
Abstract Introduction
Conclusions References
Tables Figures
◭ ◮
◭ ◮
Back Close
Full Screen / Esc
Printer-friendly Version
Interactive Discussion
Discussion
P
a
per
|
Discus
sion
P
a
per
|
Discussion
P
a
per
|
Discussion
P
a
per
|
complexes. The TU sites were located more than 500 m from sources, in either com-mercial or residential areas. The RA sites were located more than 500 m from sources and in residential areas only. Wind directions were classified as east, south, west, or north. Regression coefficients (β) were determined for each of the independent vari-ables. This MLR analysis was conducted using AERONET dataset only, because this
5
was sufficient to yield credible results.
For an unbiased assessment of model performance, the entire AERONET dataset was randomly divided into two groups, a modeling group (N=1058 for M1, M2, M4, and M6, andN=369 for M3 and M5) that was used to develop the empirical mod-els, and a validation group (N=1054 for M1, M2, M4, and M6, andN=373 for M3
10
and M5) that was used to validate these models. To minimize the effects of tempo-ral autocorrelation, data were selected such that the time interval between validation and modeling data was at least 24 h. Summary statistics for the variables involved in the modeling and validation datasets are shown in Fig. 4. All empirical models for hourly PM10 estimates based on the AERONET datasets were fitted using the
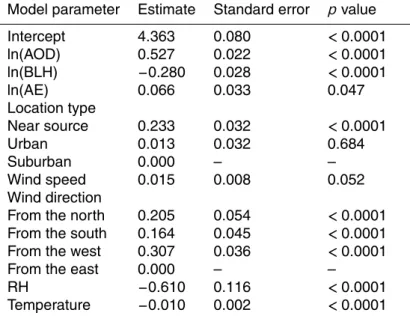
mod-15
eling dataset to estimate the model coefficients. Estimated regression coefficients (β), standard errors, and p-values of parameters used in M6 (Eq. 5) are summarized in Table 4. As shown in Table 4, most parameters used in M6 were found to be highly significant (p <0.0001) predictors of the PM10 concentration. The positive sign of the
coefficient for AOD (0.527±0.022) shows a direct correspondence between AOD and
20
surface PM10, given that other conditions remained constant. On the other hand, the
estimated power of the BLH relationship was negative (−0.280±0.028), which indi-cates an inverse relationship between BLH and the PM10 concentration. The reason for this inverse relationship is that a lower BLH confines aerosols to a thinner atmo-spheric layer, resulting in higher surface PM10 concentrations. A negative coefficient
25
was also obtained for RH (−0.610±0.116), showing that higher RH conditions result in lower PM10 concentrations (given constant AOD values); i.e., the effect of aerosol
ACPD
14, 21709–21748, 2014Spatio-temporal variations in PM10
concentrations over Seoul
S. Seo et al.
Title Page
Abstract Introduction
Conclusions References
Tables Figures
◭ ◮
◭ ◮
Back Close
Full Screen / Esc
Printer-friendly Version
Interactive Discussion
Discussion
P
a
per
|
Discus
sion
P
a
per
|
Discussion
P
a
per
|
Discussion
P
a
per
|
In this analysis, MODIS datasets collected over Seoul during the DRAGON-Asia campaign were not divided into two groups (for model development and validation) due to the relatively small size of the MODIS dataset obtained during the campaign (N=252 for M2 and M4; as compared withN=1054 for M2 and M4 for the AERONET dataset).
5
4 Results and discussion
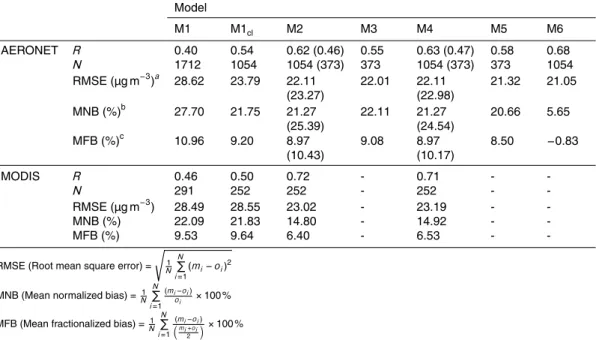
4.1 Evaluation of estimated PM10 using various empirical linear models
The hourly PM10 concentrations estimated by the various empirical models were
eval-uated by comparing them with measured hourly surface-level PM10. Table 5 shows a summary of the correlations and statistics between the measured and estimated
10
PM10 concentrations using the various model types, obtained using the AERONET
and MODIS datasets. The simplest model (M1), with only AOD as a predictor, yields the lowest correlation of 0.40 (0.46) using the AERONET (MODIS) dataset for the PM10
es-timation. The correlation obtained using the cloud-screened AOD data (M1cl) is higher
than that obtained using the raw AOD data (M1), which implies that cloud screening
15
contributes to an increase in the correlation between measured PM and AOD by re-moving overestimated AOD measurements resulting from cloud contamination (e.g. Schaap et al., 2009).
Model M2, in which BLH is an added parameter, shows a correlation coefficient of 0.62 (0.72) and a root mean square error (RMSE) of 22.11 (23.02) µg m−3 between
20
measured and estimated PM10 using the AERONET (MODIS) AOD data; in this case, the estimate using MODIS AOD data as an input is a better predictor than the estimate obtained using the AERONET data (Table 5). This higher performance of the MODIS AOD and model M2 can be attributed to a MODIS overpass time near midday, when aerosols are generally well mixed in the boundary layer, as compared with the situation
25
ACPD
14, 21709–21748, 2014Spatio-temporal variations in PM10
concentrations over Seoul
S. Seo et al.
Title Page
Abstract Introduction
Conclusions References
Tables Figures
◭ ◮
◭ ◮
Back Close
Full Screen / Esc
Printer-friendly Version
Interactive Discussion
Discussion
P
a
per
|
Discus
sion
P
a
per
|
Discussion
P
a
per
|
Discussion
P
a
per
|
that a vertical correction on AOD using the BLH value improves PM10 estimates. The correlations between measured and estimated PM10 using M2 with MODIS data are
slightly higher than those obtained in the previous work of Emili et al. (2010), which was based on a combination of Spinning Enhanced Visible and Infrared Imager (SE-VIRI) and MODIS AOD data to estimate hourly PM10concentrations over the European
5
Alpine regions. The differences between the results of Emili et al. (2010) and those obtained here could be associated with uncertainties in surface reflectance in alpine regions that resulted in relatively larger errors in the alpine AOD data as compared with those obtained in Seoul.
Aerosol effective radius data obtained from AERONET measurements was used as
10
a parameter in model M3 to estimate PM10. The effective radius of aerosol, as de-rived from sky radiances obtained from solar almucantar measurements, is available only when the solar zenith angle (SZA) is larger than 50◦(except for near local noon), which avoids polarization effects (Holben et al., 1998; Dubovik and King, 2000). Con-sequently, in contrast to the AOD data, the effective radius data is available only in
15
a limited time window. The limited number of effective radius measurements was used as an input to M3 to estimate PM10; we used 35.4 % (N=373) of the total number of AERONET validation datasets (N=1054) in which data were simultaneously available for both AOD and the effective radius. Model M3 was not implemented using MODIS AOD due to a lack of effective radius information in the MODIS datasets over land
20
areas. As shown in Table 5, the correlation between measured PM10 and those
esti-mated from M3 is higher than that obtained using M2 with the same number of datasets (N=373;RM3,AERO=0.55,RM2,AERO=0.46). Although the results are subject to further validation, aerosol size corrections using the effective radius (M3), in general, lead to better estimates of PM10concentrations than do those without (M2), at least during the
25
time frame of the intensive campaign period.
Model M4, which incorporates the aerosol hygroscopic growth factor (f(RH)) in PM10
ACPD
14, 21709–21748, 2014Spatio-temporal variations in PM10
concentrations over Seoul
S. Seo et al.
Title Page
Abstract Introduction
Conclusions References
Tables Figures
◭ ◮
◭ ◮
Back Close
Full Screen / Esc
Printer-friendly Version
Interactive Discussion
Discussion
P
a
per
|
Discus
sion
P
a
per
|
Discussion
P
a
per
|
Discussion
P
a
per
|
the RH correction is absent. The results suggest that RH levels do not significantly influ-ence BLH-corrected estimates at our measurement sites during the campaign period, during which average daytime RH values were 30.5 %±11.0 %; at these RH levels, it appears that aerosols are largely unaffected by hygroscopic growth.
The PM10estimates derived from M5, which considers BLH,f(RH), and the effective
5
radius, were also evaluated by comparisons with PM10concentrations measured at the
surface. As discussed previously, the number of samples for the effective radius used in M3 (N=373) was also used in M5, and M5 was also evaluated using the AERONET data. Table 5 shows that the correlation coefficient obtained using model M5 was 0.58, while those from M3 and M4 were 0.55 and 0.47, respectively, using the same
num-10
ber of datasets (N=373). The correlation between measured and estimated PM10 concentrations obtained from M5 is higher than that obtained from M4, on account of the addition of aerosol size information. However, this correlation obtained from M5 is slightly improved relative to that obtained from M3, as the effect of the RH correc-tion is considered to be negligible for PM10estimations using data collected during the
15
DRAGON-Asia campaign when average RH values were low.
The PM10 concentrations were also estimated from the MLR model (M6). As dis-cussed in Sect. 3.2, 1054 AERONET datasets were used for the validation of PM10
estimated using M6. The correlation coefficient between the measured PM10and those
estimated from M6 is 0.68. This correlation coefficient is the highest among those
ob-20
tained by any of the empirical models in this study, and shows that various meteorolog-ical parameters, such as RH, temperature, wind speed, and wind direction, contribute to a substantial increase in the accuracy of PM10estimates.
The BLH and the effective radius of aerosols are the dominant predictors of PM10
in the empirical models, while the effect of RH on PM10 estimation during the
cam-25
paign period is negligible. However, the contribution of the RH correction may vary seasonally, which is further discussed in Sect. 4.3. In terms of the errors in the es-timated PM10 concentrations, the RMSE of PM10 estimated using M6 (M2) with the
ACPD
14, 21709–21748, 2014Spatio-temporal variations in PM10
concentrations over Seoul
S. Seo et al.
Title Page
Abstract Introduction
Conclusions References
Tables Figures
◭ ◮
◭ ◮
Back Close
Full Screen / Esc
Printer-friendly Version
Interactive Discussion
Discussion
P
a
per
|
Discus
sion
P
a
per
|
Discussion
P
a
per
|
Discussion
P
a
per
|
among those calculated with the empirical models (Table 5). The RMSE values be-tween measured PM10concentrations and those estimated using M1cl(N=1054), M2
(N=1054), and M4 (N=1054), based on the same number of AERONET datasets as inputs, are 23.79, 22.11, and 22.11 µg m−3, respectively, showing that the models tend to improve (i.e., the errors tend to decrease) when using the BLH as a predictor in the
5
empirical models. This improvement in the models was also found when a vertical cor-rection is applied to the MODIS data. The RMSE values of PM10 estimated using M1cl (N=252), M2 (N=252), and M4 (N=252), and based on inputs of MODIS data, were 28.55, 23.02, and 23.19 µg m−3, respectively. The RMSE values of PM10estimated
us-ing M2 (N=373), M3 (N=373), and M5 (N=373), and based on the same number
10
of AERONET datasets, were 23.27, 22.01, and 21.32 µg m−3, respectively, when a size correction using the aerosol effective radius and an RH correction using the particle hygroscopic growth factor were incorporated into the models. To evaluate the empir-ical model performance for PM10 estimation, the mean normalized bias (MNB) and the mean fractionalized bias (MFB) were also calculated (these statistical parameters
15
are described in the footnote of Table 5). The tendencies of both the MNB and MFB are similar to those of the RMSE, except for M6. All MFB values (except for M6) are positive, which indicates that the PM10 concentrations derived from the models are
generally overestimated when compared with measured PM10 values. The MFB of M6
was −0.83 %, which shows that M6 tends to underestimate the PM10 concentration,
20
especially at high concentrations on account of the log transformation of the data.
4.2 Spatial characteristics of correlations between measured and estimated PM10
Large variations in the mean and standard deviation of the measured PM10 concentra-tions were observed, with the size of the deviaconcentra-tions dependent on the measurement
25
ACPD
14, 21709–21748, 2014Spatio-temporal variations in PM10
concentrations over Seoul
S. Seo et al.
Title Page
Abstract Introduction
Conclusions References
Tables Figures
◭ ◮
◭ ◮
Back Close
Full Screen / Esc
Printer-friendly Version
Interactive Discussion
Discussion
P
a
per
|
Discus
sion
P
a
per
|
Discussion
P
a
per
|
Discussion
P
a
per
|
PM10 concentration in Seoul during the campaign period were 62.21 (±33.78), 53.42 (±28.40), and 52.19 (±26.15) µg m−3 at the NS, TU, and RA site types, respectively. The highest mean and standard deviation of the PM10 concentrations were found at
the NS site type, while the lowest were found at the RA site type.
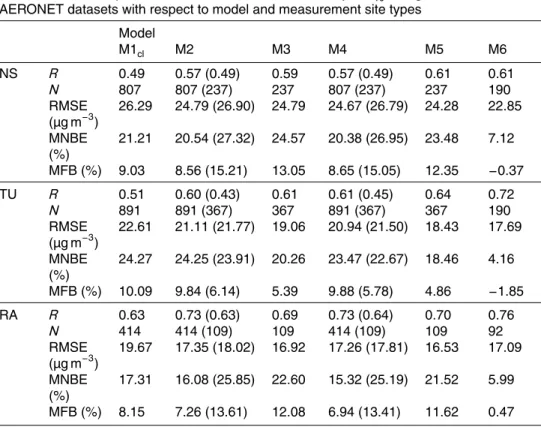
To identify spatial variability within the performance of the empirical models, the
cor-5
relations between measured and estimated PM10 concentrations were further
investi-gated with respect to the classification of site types (NS, TU, and RA). Table 6 shows the correlations between measured and estimated PM10, with inputs of AERONET and
MODIS data, and as dependent on the measurement site type. As shown in Table 6, correlation coefficients for the RA site show good model performances (0.69–0.76)
us-10
ing M3, M5, and M6; however, model performances for the NS and TU site types fall within the ranges 0.59–0.61 and 0.61–0.72, respectively. Correlation coefficients for the RA site type are in the range 0.63–0.73 for models M1cl, M2, and M4, whereas those for the NS and TU site types are 0.49–0.57 and 0.51–0.61, respectively. The RMSE values are 16.53–19.67, 17.69–22.61, and 22.85–26.79 µg m−3for the RA, TU,
15
and NS site types, respectively, showing that errors in PM10estimates at NS site types are higher than those at TU and RA site types. Thus, the highest correlation in each empirical model was obtained for the RA sites, while the lowest was found at the NS sites (Table 6). The NS site type shows large spatial and temporal variability in surface PM10 concentrations due to large anthropogenic aerosol emissions, which presents
20
difficulties in the development of empirical models for estimating PM10 concentrations.
The results obtained using the AERONET data (Table 6) also demonstrate that hourly PM10 estimations depend largely on both the empirical model used for the estimation and the site type in megacity areas, where the spatial and temporal variability of aerosol concentrations is large.
25
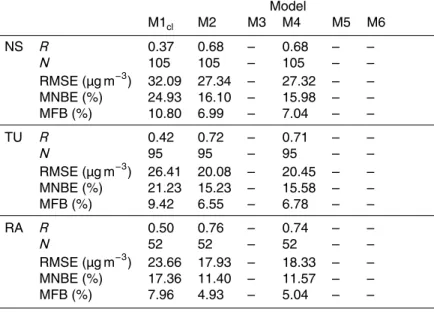
As discussed in Sect. 4.1, the spatial dependency of empirical model performance using the MODIS data inputs was investigated only for models M1cl, M2, and M4, due
ACPD
14, 21709–21748, 2014Spatio-temporal variations in PM10
concentrations over Seoul
S. Seo et al.
Title Page
Abstract Introduction
Conclusions References
Tables Figures
◭ ◮
◭ ◮
Back Close
Full Screen / Esc
Printer-friendly Version
Interactive Discussion
Discussion
P
a
per
|
Discus
sion
P
a
per
|
Discussion
P
a
per
|
Discussion
P
a
per
|
highest correlations for the RA site type, while the lowest are for the NS sites. The correlation coefficients for the RA sites were between 0.50 and 0.76 for models M1cl,
M2, and M4, whereas those for the TU and NS sites were 0.42–0.72 and 0.37–0.68, respectively. The highest correlation between measured and estimated PM10, obtained using M2 with MODIS data, was comparable with those obtained using M5 and M6 with
5
AERONET data. This high performance of the empirical models using the MODIS data can be explained by the overpass time of the MODIS data, which was around midday when aerosols are generally well-mixed within the boundary layer compared with other times of the day (Schaap et al., 2009).
The inverse distance weighting (IDW) interpolation method was applied to estimate
10
the PM10concentrations using M2 with MODIS AOD data over various campaign sites, at a spatial resolution that was finer than that established for the original MODIS data (10 km). The IDW method was used to estimate PM10 concentrations in alpine regions
with simple PM source distributions (Emili et al., 2010). In this study, model M2 with MODIS AOD and lidar BLH data was used to estimate PM10 concentrations at a
reso-15
lution of 0.02◦(ca. 2 km) over the Seoul area. Slopes and intercepts of M2 were spatially interpolated to a resolution of 0.02◦using the IDW method, as calculated from values at the four closest pixels. Figure 5 shows PM10estimates at the 2 km resolution based on
the IDW method, where the colored circles represent PM10 concentrations measured
at PM monitoring sites. The spatial distribution of the estimated and measured PM10
20
concentrations is generally in good agreement. However, a discontinuity is observed in Fig. 5, which could be due to a problem associated with AOD input at a low resolu-tion and its interpolaresolu-tion based on inhomogeneous sampling of a small number of data points.
4.3 Seasonal characteristics of correlations between measured and estimated
25
PM10
ACPD
14, 21709–21748, 2014Spatio-temporal variations in PM10
concentrations over Seoul
S. Seo et al.
Title Page
Abstract Introduction
Conclusions References
Tables Figures
◭ ◮
◭ ◮
Back Close
Full Screen / Esc
Printer-friendly Version
Interactive Discussion
Discussion
P
a
per
|
Discus
sion
P
a
per
|
Discussion
P
a
per
|
Discussion
P
a
per
|
(YU) site to investigate the seasonal characteristics of the various empirical model per-formances for PM10 estimation. Seasonal effects were studied during all four seasons
(spring, summer, autumn, and winter), defined here as the periods March–May, June– August, September–November, and December–February, respectively. The AERONET level 2.0 data were used from March 2011 to July 2012 at the YU site, as YU is the
5
only site in Seoul where AERONET level 2.0 data are available for the period that cov-ers all four seasons, and which also includes the DRAGON-Asia campaign period. All models except for MLR model M6 were used to identify the seasonal dependency of model performance; M6 was not used because the number of datasets was insufficient to determine the regression coefficients for the four different seasons.
10
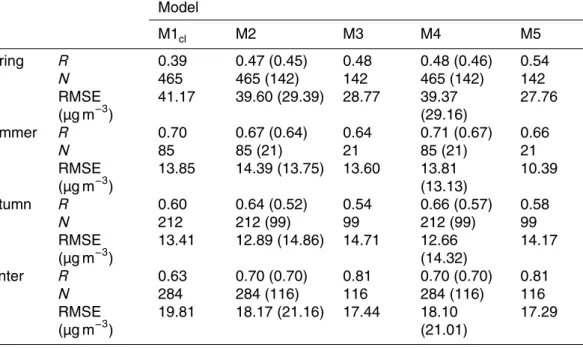
Table 7 summarizes the seasonal variations in the correlations between measured and estimated PM10 using the various empirical models and the AERONET data. The
overall statistics (including correlation coefficients) of the models using the AERONET data were found to be poorest in spring, when compared with those of other seasons. Correlation coefficients using all empirical models and the AERONET data (Table 7)
15
were in the range 0.39–0.54 for spring, whereas those for summer, autumn, and win-ter were 0.64–0.71, 0.52–0.66, and 0.63–0.81, respectively. The poor performance in spring can be attributed to frequent occurrences of Asian dust events as well as persis-tent anthropogenic influences at YU which is located in a continental downwind region. The Asian dust events in spring generate inhomogeneous aerosol vertical distributions
20
due to elevated aerosol layers above the BLH, which are not taken into account by us-ing BLH in the empirical models (Murayama et al., 2001; Kim et al., 2007). Therefore, the performance using M2 in spring (R=0.47) is still much poorer than performances in other seasons (R≥0.64), which could be attributed to the presence of multiple aerosol layers and mixtures of different types of aerosols in spring.
25
ACPD
14, 21709–21748, 2014Spatio-temporal variations in PM10
concentrations over Seoul
S. Seo et al.
Title Page
Abstract Introduction
Conclusions References
Tables Figures
◭ ◮
◭ ◮
Back Close
Full Screen / Esc
Printer-friendly Version
Interactive Discussion
Discussion
P
a
per
|
Discus
sion
P
a
per
|
Discussion
P
a
per
|
Discussion
P
a
per
|
effective radius being the dominant predictors in the empirical models for PM10 es-timation. A lower aerosol mixing height is often induced by a temperature inversion in winter, when homogeneous aerosol properties are likely to be present within the boundary layer due to the reduced influence of the long-range transport of aerosols above the BLH. The correlation using M4, which considers BLH and RH in summer
5
(N=85) and autumn (N=212), when RH is relatively higher than in the other two sea-sons, yields correlations of 0.71 and 0.66, respectively. In summer, the RH correction improves the PM10 estimation, yielding a correlation of 0.71 using M4 compared with
a correlation of 0.67 using M2. In autumn, incorporation of the RH correction into the models (M4) yields a slightly improved correlation compared with models that exclude
10
the RH correction (M2); i.e., 0.66 and 0.64, respectively. The correlation also increases from 0.64 (M3) to 0.66 (M5), and from 0.54 (M3) to 0.58 (M5), in summer and autumn, respectively, when including the RH correction, which shows that the RH correction is effective in conditions of higher RH.
5 Conclusions
15
Concentrations of PM10 were estimated in Seoul, Korea during the DRAGON-Asia campaign period by considering the effective radius of the aerosol size distribution, together with BLH, RH, and AOD, within empirical models that used AERONET data obtained at multiple sites for the first time. The performances of various empirical mod-els were also evaluated for hourly PM10 estimations using AERONET and MODIS
20
datasets. In general, BLH and the effective radius were found to be the key param-eters when estimating PM10 using the empirical models, while RH did not show any
significant effect on PM10 estimation using the multiple datasets collected during the spring campaign period, when RH is relatively lower than summer and autumn.
The spatial variability of empirical model performance was also investigated for
25
ACPD
14, 21709–21748, 2014Spatio-temporal variations in PM10
concentrations over Seoul
S. Seo et al.
Title Page
Abstract Introduction
Conclusions References
Tables Figures
◭ ◮
◭ ◮
Back Close
Full Screen / Esc
Printer-friendly Version
Interactive Discussion
Discussion
P
a
per
|
Discus
sion
P
a
per
|
Discussion
P
a
per
|
Discussion
P
a
per
|
AERONET and MODIS data occurred for the RA sites, while the lowest was for the NS sites, where the spatio-temporal variability of aerosols is high. The selection of site types either dominates, or is comparable with, the specific empirical model selected for estimating PM10 concentrations in Seoul, as results are significantly affected by the spatial variability of aerosols. The performances of the models for estimating PM10
5
were also good at midday when aerosols are well mixed within the boundary layer, which suggests a dependence of PM10 estimation on the measurement time.
Seasonal variations in the performances of the empirical models for PM10
estima-tion were detected. The highest correlaestima-tion was found using M3 and M5 in winter (R=0.81), when both BLH and the effective radius of the aerosol are considered;
10
the high correlations can be attributed to a lower aerosol mixing height and homo-geneity in the optical and microphysical properties of aerosols within the BLH. The poorest performance was found in spring, when the impact of Asian dust events on both inhomogeneous vertical structure of particle number and aerosol composition at the measurement sites is common, and leads to variable effects.
15
As discussed in this study, the spatial distribution of surface-level PM10
concentra-tions can be estimated using empirical models. The use of satellite measurements in these various empirical models has the advantage of both simplicity and wide spatial coverage over megacity areas. However, the predictability of PM10 distributions using
empirical models should be improved. The performances of empirical models for PM
20
predictions can be improved by using finer spatial resolution satellite data, such as MODIS collection 6 (Levy et al., 2013), Geostationary Ocean Color Imager (GOCI) aerosol products (Lee et al., 2010b), and more detailed information on aerosol com-position, size, vertical distribution, and so on. Also, to enhance the accuracy of PM10
estimations in other seasons, further work is required to investigate seasonal effects
25
ACPD
14, 21709–21748, 2014Spatio-temporal variations in PM10
concentrations over Seoul
S. Seo et al.
Title Page
Abstract Introduction
Conclusions References
Tables Figures
◭ ◮
◭ ◮
Back Close
Full Screen / Esc
Printer-friendly Version
Interactive Discussion
Discussion
P
a
per
|
Discus
sion
P
a
per
|
Discussion
P
a
per
|
Discussion
P
a
per
|
Acknowledgement. This research was supported by the GEMS program of the Ministry of En-vironment, Korea and the Eco Innovation Program of KEITI (2012000160002). The authors deeply appreciate NIER and the stafffor the DRAGON-Asia campaign in establishing and main-taining the AERONET sites. We would also like to thank NIER for the PM10 data used, NASA for the AERONET and MODIS data, and NIES Lidar team for the lidar data. This research was
5
partially supported by the Brain Korea 21 Plus for SS, JK, HL, WJ, and WK.
References
Baumer, D., Vogel, B., Versick, S., Rinke, R., Mohler, O., and Schnaiter, M.: Relationship of visibility, aerosol optical thickness and aerosol size distribution in an ageing air mass over South-West Germany, Atmos. Environ., 42, 989–998, doi:10.1016/j.atmosenv.2007.10.017,
10
2008.
Brauer, M., Amann, M., Burnett, R. T., Cohen, A., Dentener, F., Ezzati, M., Henderson, S. B., Krzyzanowski, M., Martin, R. V., and Van Dingenen, R.: Exposure assessment for estimation of the global burden of disease attributable to outdoor air pollution, Environ. Sci. Technol., 46, 652–660, 2012.
15
Brook, R. D., Rajagopalan, S., Pope, C. A., Brook, J. R., Bhatnagar, A., Diez-Roux, A. V., Hol-guin, F., Hong, Y. L., Luepker, R. V., Mittleman, M. A., Peters, A., Siscovick, D., Smith, S. C., Whitsel, L., Kaufman, J. D., Epidemiol, A. H. A. C., Dis, C. K. C., and Metab, C. N. P. A.: Partic-ulate Matter Air Pollution and Cardiovascular Disease An Update to the Scientific Statement From the American Heart Association, Circulation, 121, 2331–2378, 2010.
20
Brooks, I. M.: Finding boundary layer top: application of a wavelet covariance transform to lidar backscatter profiles, J. Atmos. Ocean. Tech., 20, 1092–1105, 2003.
Campbell, J. R., Hlavka, D. L., Welton, E. J., Flynn, C. J., Turner, D. D., Spinhirne, J. D., Scott, V. S., and Hwang, I. H.: Full-time, eye-safe cloud and aerosol lidar observation at atmospheric radiation measurement program sites: instruments and data processing, J.
At-25
mos. Ocean. Tech., 19, 431–442, 2002.
Chu, D. A., Kaufman, Y. J., Zibordi, G., Chern, J. D., Mao, J., Li, C. C., and Holben, B. N.: Global monitoring of air pollution over land from the Earth Observing System-Terra Moder-ate Resolution Imaging Spectroradiometer (MODIS), J. Geophys. Res.-Atmos., 108, 4661, doi:10.1029/2002jd003179, 2003.
ACPD
14, 21709–21748, 2014Spatio-temporal variations in PM10
concentrations over Seoul
S. Seo et al.
Title Page
Abstract Introduction
Conclusions References
Tables Figures
◭ ◮
◭ ◮
Back Close
Full Screen / Esc
Printer-friendly Version
Interactive Discussion
Discussion
P
a
per
|
Discus
sion
P
a
per
|
Discussion
P
a
per
|
Discussion
P
a
per
|
Dubovik, O. and King, M. D.: A flexible inversion algorithm for retrieval of aerosol optical prop-erties from Sun and sky radiance measurements, J. Geophys. Res.-Atmos., 105, 20673– 20696, doi:10.1029/2000jd900282, 2000.
Dubovik, O., Smirnov, A., Holben, B. N., King, M. D., Kaufman, Y. J., Eck, T. F., and Slutsker, I.: Accuracy assessments of aerosol optical properties retrieved from Aerosol Robotic Network
5
(AERONET) Sun and sky radiance measurements, J. Geophys. Res.-Atmos., 105, 9791– 9806, doi:10.1029/2000jd900040, 2000.
Emili, E., Popp, C., Petitta, M., Riffler, M., Wunderle, S., and Zebisch, M.: PM10 remote sensing from geostationary SEVIRI and polar-orbiting MODIS sensors over the com-plex terrain of the European Alpine region, Remote Sens. Environ., 114, 2485–2499,
10
doi:10.1016/j.rse.2010.05.024, 2010.
Engel-Cox, J. A., Holloman, C. H., Coutant, B. W., and Hoff, R. M.: Qualitative and quantitative evaluation of MODIS satellite sensor data for regional and urban scale air quality, Atmos. Environ., 38, 2495–2509, doi:10.1016/j.atmosenv.2004.01.039, 2004.
Engel-Cox, J. A., Hoff, R. M., Rogers, R., Dimmick, F., Rush, A. C., Szykman, J. J.,
Al-15
Saadi, J., Chu, D. A., and Zell, E. R.: Integrating lidar and satellite optical depth with ambient monitoring for 3-dimensional particulate characterization, Atmos. Environ., 40, 8056–8067, doi:10.1016/j.atmosenv.2006.02.039, 2006.
Guo, J.-P., Zhang, X.-Y., Che, H.-Z., Gong, S.-L., An, X., Cao, C.-X., Guang, J., Zhang, H., Wang, Y.-Q., and Zhang, X.-C.: Correlation between PM concentrations and aerosol optical
20
depth in eastern China, Atmos. Environ., 43, 5876–5886, 2009.
Gupta, P. and Christopher, S. A.: Seven year particulate matter air quality assessment from surface and satellite measurements, Atmos. Chem. Phys., 8, 3311–3324, doi:10.5194/acp-8-3311-2008, 2008.
Hauck, H., Berner, A., Gomiscek, B., Stopper, S., Puxbaum, H., Kundi, M., and Preining, O.:
25
On the equivalence of gravimetric PM data with TEOM and beta-attenuation measurements, J. Aerosol Sci., 35, 1135–1149, doi:10.1016/j.jaerosci.2004.04.004, 2004.
Holben, B. N., Eck, T. F., Slutsker, I., Tanre, D., Buis, J. P., Setzer, A., Vermote, E., Reagan, J. A., Kaufman, Y. J., Nakajima, T., Lavenu, F., Jankowiak, I., and Smirnov, A.: AERONET – A fed-erated instrument network and data archive for aerosol characterization, Remote Sens.
En-30
viron., 66, 1–16, doi:10.1016/S0034-4257(98)00031-5, 1998.
Intergov-ACPD
14, 21709–21748, 2014Spatio-temporal variations in PM10
concentrations over Seoul
S. Seo et al.
Title Page
Abstract Introduction
Conclusions References
Tables Figures
◭ ◮
◭ ◮
Back Close
Full Screen / Esc
Printer-friendly Version
Interactive Discussion
Discussion
P
a
per
|
Discus
sion
P
a
per
|
Discussion
P
a
per
|
Discussion
P
a
per
|
ernmental Panel on Climate Change, Cambridge University Press, Cambridge, UK and New York, NY, USA, 2013
Kappos, A. D., Bruckmann, P., Eikmann, T., Englert, N., Heinrich, U., Hoppe, P., Koch, E., Krause, G. H. M., Kreyling, W. G., Rauchfuss, K., Rombout, P., Schulz-Klemp, V., Thiel, W. R., and Wichmann, H. E.: Health effects of particles in ambient air, Int. J. Hyg. Envir. Heal., 207,
5
399–407, doi:10.1078/1438-4639-00306, 2004.
Kaufman, Y. J., Tanré, D., and Boucher, O.: A satellite view of aerosols in the climate system, Nature, 419, 215–223, 2002.
Kim, J., Lee, J., Lee, H. C., Higurashi, A., Takemura, T., and Song, C. H.: Consistency of the aerosol type classification from satellite remote sensing during the Atmospheric Brown
10
Cloud–East Asia Regional Experiment campaign, J. Geophys. Res.-Atmos., 112, D22S33, doi:10.1029/2006JD008201, 2007.
Kim, S.-W., Yoon, S.-C., Kim, J., and Kim, S.-Y.: Seasonal and monthly variations of colum-nar aerosol optical properties over east Asia determined from multi-year MODIS, LI-DAR, and AERONET Sun/sky radiometer measurements, Atmos. Environ., 41, 1634–1651,
15
doi:10.1016/j.atmosenv.2006.10.044, 2007.
Koelemeijer, R. B. A., Homan, C. D., and Matthijsen, J.: Comparison of spatial and temporal variations of aerosol optical thickness and particulate matter over Europe, Atmos. Environ., 40, 5304–5315, doi:10.1016/j.atmosenv.2006.04.044, 2006.
Kumar, N., Chu, A., and Foster, A.: An empirical relationship between PM2.5and aerosol optical
20
depth in Delhi Metropolitan, Atmos. Environ., 41, 4492–4503, 2007.
Lee, J., Kim, J., Song, C. H., Kim, S. B., Chun, Y., Sohn, B. J., and Holben, B. N.: Characteristics of aerosol types from AERONET sunphotometer measurements, Atmos. Environ., 44, 3110– 3117, doi:10.1016/j.atmosenv.2010.05.035, 2010a.
Lee, J., Kim, J., Song, C. H., Ryu, J.-H., Ahn, Y.-H., and Song, C.: Algorithm for retrieval of
25
aerosol optical properties over the ocean from the Geostationary Ocean Color Imager, Re-mote Sens. Environ., 114, 1077–1088, 2010b.
Levy, R. C., Remer, L. A., Mattoo, S., Vermote, E. F., and Kaufman, Y. J.: Second-generation operational algorithm: Retrieval of aerosol properties over land from inversion of Moderate Resolution Imaging Spectroradiometer spectral reflectance, J. Geophys. Res.-Atmos., 112,
30
ACPD
14, 21709–21748, 2014Spatio-temporal variations in PM10
concentrations over Seoul
S. Seo et al.
Title Page
Abstract Introduction
Conclusions References
Tables Figures
◭ ◮
◭ ◮
Back Close
Full Screen / Esc
Printer-friendly Version
Interactive Discussion
Discussion
P
a
per
|
Discus
sion
P
a
per
|
Discussion
P
a
per
|
Discussion
P
a
per
|
Levy, R. C., Mattoo, S., Munchak, L. A., Remer, L. A., Sayer, A. M., Patadia, F., and Hsu, N. C.: The Collection 6 MODIS aerosol products over land and ocean, Atmos. Meas. Tech., 6, 2989–3034, doi:10.5194/amt-6-2989-2013, 2013.
Liu, Y., Park, R. J., Jacob, D. J., Li, Q. B., Kilaru, V., and Sarnat, J. A.: Mapping annual mean ground-level PM2.5concentrations using Multiangle Imaging Spectroradiometer aerosol
op-5
tical thickness over the contiguous United States, J. Geophys. Res.-Atmos., 109, D22206, doi:10.1029/2004jd005025, 2004.
Liu, Y., Sarnat, J. A., Kilaru, V., Jacob, D. J., and Koutrakis, P.: Estimating ground-level PM2.5in the eastern United States using satellite remote sensing, Environ. Sci. Technol., 39, 3269– 3278, 2005.
10
Liu, Y., Franklin, M., Kahn, R., and Koutrakis, P.: Using aerosol optical thickness to predict ground-level PM2.5concentrations in the St. Louis area: A comparison between MISR and MODIS, Remote Sens. Environ., 107, 33–44, doi:10.1016/j.rse.2006.05.022, 2007.
Murayama, T., Sugimoto, N., Uno, I., Kinoshita, K., Aoki, K., Hagiwara, N., Liu, Z. Y., Matsui, I., Sakai, T., Shibata, T., Arao, K., Sohn, B. J., Won, J. G., Yoon, S. C., Li, T., Zhou, J., Hu, H. L.,
15
Abo, M., Iokibe, K., Koga, R., and Iwasaka, Y.: Ground-based network observation of Asian dust events of April 1998 in east Asia, J. Geophys. Res.-Atmos., 106, 18345–18359, 2001. Ogunjobi, K. O., Kim, Y. J., and He, Z.: Influence of the total atmospheric optical
depth and cloud cover on solar irradiance components, Atmos. Res., 70, 209–227, doi:10.1016/j.atmosres.2004.01.003, 2004.
20
Pan, X. L., Yan, P., Tang, J., Ma, J. Z., Wang, Z. F., Gbaguidi, A., and Sun, Y. L.: Observational study of influence of aerosol hygroscopic growth on scattering coefficient over rural area near Beijing mega-city, Atmos. Chem. Phys., 9, 7519–7530, doi:10.5194/acp-9-7519-2009, 2009. Pelletier, B., Santer, R., and Vidot, J.: Retrieving of particulate matter from optical
measurements: a semiparametric approach, J. Geophys. Res.-Atmos., 112, D06208,
25
doi:10.1029/2005JD006737, 2007.
Pope, C. A., Burnett, R. T., Thun, M. J., Calle, E. E., Krewski, D., Ito, K., and Thurston, G. D.: Lung cancer, cardiopulmonary mortality, and long-term exposure to fine particulate air pollu-tion, JAMA-J. Am. Med. Assoc., 287, 1132–1141, 2002.
Remer, L. A., Kaufman, Y. J., Tanre, D., Mattoo, S., Chu, D. A., Martins, J. V., Li, R. R.,
30
ACPD
14, 21709–21748, 2014Spatio-temporal variations in PM10
concentrations over Seoul
S. Seo et al.
Title Page
Abstract Introduction
Conclusions References
Tables Figures
◭ ◮
◭ ◮
Back Close
Full Screen / Esc
Printer-friendly Version
Interactive Discussion
Discussion
P
a
per
|
Discus
sion
P
a
per
|
Discussion
P
a
per
|
Discussion
P
a
per
|
Schaap, M., Apituley, A., Timmermans, R. M. A., Koelemeijer, R. B. A., and de Leeuw, G.: Exploring the relation between aerosol optical depth and PM2.5at Cabauw, the Netherlands, Atmos. Chem. Phys., 9, 909–925, doi:10.5194/acp-9-909-2009, 2009.
van Donkelaar, A., Martin, R. V., Brauer, M., Kahn, R., Levy, R., Verduzco, C., and Vil-leneuve, P. J.: Global estimates of ambient fine particulate matter concentrations from
5
satellite-based aerosol optical depth: development and application, Environ. Health. Persp., 118, 847–855, doi:10.1289/ehp.0901623, 2010.
Wang, J. and Christopher, S. A.: Intercomparison between satellite-derived aerosol optical thickness and PM2.5mass: Implications for air quality studies, Geophys. Res. Lett., 30, 2095, doi:10.1029/2003gl018174, 2003.
10
Wang, Z. F., Chen, L. F., Tao, J. H., Zhang, Y., and Su, L.: Satellite-based estimation of regional particulate matter (PM) in Beijing using vertical-and-RH correcting method, Remote Sens. Environ., 114, 50–63, doi:10.1016/j.rse.2009.08.009, 2010.
WHO (World Health Organization): WHO Air quality guidelines for particulate matter, ozone, nitrogen dioxide and sulfur dioxide - global update 2005, WHO Press, World Health
Organi-15