Ionospheric measurements during the CRISTA/MAHRSI
campaign: their implications and comparison with previous campaigns
J. LasÏtovicka1, D. Pancheva2, D. Altadill3, E. A. Benediktov4, J. BosÏka1, J. Bremer5, M. Dick6, K. Igarashi7, P. Mlch1, B. A. de la Morena8, Z. T. Rapoport9, V. A. Vyakhirev4, B. O. Vugmeister10, X. Zhang11, B. Zolesi12
1
Institute of Atmospheric Physics, Bocni II, Prague 4, Czech Republic
2Geophysical Institute, ``Acad.G.Bonchev'' 3, 1113 So®a, Bulgaria 3
Observatori de l'Ebre, 43520 Roquetes (Tarragona), Spain
4NIRFI, B. Pechorskaya St. 25/14, 603600 Nizhni Novgorod, Russia 5
Institute of Atmospheric Physics, Schlossstrasse 4-6, D-18221 KuÈhlungsborn, Germany
6Rutherford Appleton Laboratory, Chilton, Didcot, Oxfordshire OX11 0QX, UK 7Communication Research Laboratory, 4-2-1 Nukuikita, Koganei, Tokyo 184, Japan 8
INTA, Centro Experimental de ``El Arenosillo'', 21130 Mazagon (Huelva), Spain
9IZMIRAN, 142092 Troitsk, Moscow Region, Russia 10
Institute of Solar-Terrestrial Physics, PO Box 4026, 664033 Irkutsk, Russia
11
Wuhan Institute of Physics, Academia Sinica, PO Box 72003, Wuchang, Wuhan 430072, China
12Istituto Nazionale di Geo®sica, Via di Vigna Murata 605, Roma 00143, Italy
Received: 4 September 1998 / Revised: 23 November 1998 / Accepted: 30 November 1998
Abstract. The CRISTA/MAHRSI experiment on board a space shuttle was accompanied by a broad campaign of rocket, balloon and ground-based mea-surements. Supporting lower ionospheric ground-based measurements were run in Europe and Eastern Asia between 1 October±30 November, 1994. Results of comparisons with long ionospheric data series together with short-term comparisons inside the interval Octo-ber±November, 1994, showed that the upper middle atmosphere (h= 80±100 km) at middle latitudes of the Northern Hemisphere in the interval of the CRISTA/ MAHRSI experiment (4±12 November, 1994) was very close to its expected climatological state. In other words, the average results of the experiment can be used as climatological data, at least for the given area/altitudes. The role of solar/geomagnetic and ``meteorological'' control of the lower ionosphere is investigated and compared with the results of MAP/WINE, MAC/SINE and DYANA campaigns. The eects of both solar/ geomagnetic and global meteorological factors on the lower ionosphere are found to be weak during autumn 1994 compared to those in MAP/WINE and DYANA winters, and they are even slightly weaker than those in MAP/SINE summer. The comparison of the four campaigns suggests the following overall pattern: in winter the lower ionosphere at northern middle latitudes appears to be fairly well ``meteorologically'' controlled with a very weak solar in¯uence. In summer, solar in¯uence is somewhat stronger and dominates the weak ``meteorological'' in¯uence, but the overall
solar/mete-orological control is weaker than in winter. In autumn we ®nd the weakest overall solar/meteorological control, local eects evidently dominate.
Key words. Ionosphere (ionosphere ± atmosphere interactions; mid-latitude ionosphere)
1 Introduction
The CRISTA/MAHRSI (CRyogenic Infrared Spec-trometers and Telescopes for the Atmosphere/Middle Atmosphere High Resolution Spectrometer Instrument) experiment/campaign has been described by Oermann
et al. (1998), Conway et al. (1998) and several other papers in a special section of the Journal of Geophysical Research, series D ± Atmospheric Chemistry. The supporting campaign of ground-based ionospheric mea-surements was run on 1 October±30 November 1994. Measurements in the lower ionosphere (h< 100 km) were made at middle latitudes of the Northern Hemi-sphere. Information on planetary wave activity obtained from ionospheric measurements has been described by Pancheva and LasÏtovicka (1998). Low frequency (LF) radio wave absorption data from central Europe, including inferred gravity wave activity, were analyzed by LasÏtovicka et al. (1997). The following important results were obtained in these two papers:
1. According to the LF absorptions, the CRISTA interval of 3±12 November, 1994, appears to be representative (i.e. very close to the climatological
Correspondence to:J. LasÏtovicka E-mail: [email protected].
state) for autumn, low-to-moderate solar activity and the declining phase of solar cycle.
2. The planetary wave-type oscillations (T= 3±25 days), inferred from radio wave absorption, are much more intense in November than in October in Europe and vice versa in Eastern Asia. They prevailingly propagate eastward.
The lower ionosphere is the altitude region where the solar and meteorological in¯uences are competing, while higher layers are dominated by solar activity and lower layers by meteorological eects. The lower ionosphere is controlled by the Sun e.g. during solar ¯ares, and by ``meteorology'' (i.e. processes of neutral atmosphere origin) e.g. during winter anomalous days. In previous campaigns DYANA, MAP/WINE and MAC/SINE (LasÏtovicka et al., 1994; LasÏtovicka et al., 1990; Williams et al., 1987; LasÏtovicka et al., 1989), the response of the lower ionosphere to solar and meteoro-logical forcing was studied. This problem is also addressed in this study.
Section 2 contains a brief description of data. Probably the most important contribution of ground-based ionospheric measurements to the CRISTA/MA-HRSI project is the use of very long data series to answer the question whether the CRISTA/MAHRSI campaign/experiment was run under typical (climato-logical) conditions or under anomalous conditions. This is done in Sect. 3 together with a brief description of the development of the lower ionosphere in October± November 1994, particular attention being paid to the interval of the CRISTA/MAHRSI experiment itself. Section 3 also deals brie¯y with electron density mea-surements in the lower ionosphere during the campaign. The response of the lower ionosphere to solar and meteorological forcing during the campaign is studied in Sect. 4 with a special emphasis paid to possible depen-dence of the response on altitude, latitude and longitude. The results are compared with the results from previous campaigns DYANA, MAP/WINE and MAC/SINE (LasÏtovicka et al., 1994; LasÏtovicka et al., 1990; Williamset al., 1987; LasÏtovicka et al., 1989). A brief discussion of lower ionospheric measurements and conclusion close the work.
2 Data
The A3 absorption of radio waves (oblique incidence on the ionosphere), IPHA (indirect phase re¯ection height analysis) and fmin data, reduced to a constant solar
zenith angle,v, are used to describe the behaviour of the lower ionosphere over Europe and Eastern Asia based on data provided by ``ionospheric'' participants of the project CRISTA/MAHRSI. The data at a constant v
(75° or cos v= 0.2) are average values from morning
and afternoon values. The LF A3 absorption data are used for night (v> 100°). The IPHA method is applied to determine the LF phase re¯ection height (i.e. level of a constant electron density; Lauter et al., 1984). An increase of the re¯ection height at a ®xed solar zenith angle (cos v= 0.2 is used) implies a decrease of the
electron concentration at a ®xed height. The parameter
fmin is used as a rough measure of absorption as done
e.g. by Sato (1981) or LasÏtovickaet al.(1994) to obtain a larger spatial coverage (A3 absorption measurements are available only in a limited part of Europe).fminis less
accurate and less sensitive, because accuracy/resolution of fmin determination is 0.1 MHz, or under very
optimum conditions 0.05 MHz. We can compare only relative variations offmin, not its absolute values, which
depend on ionosonde characteristics and noise level. Single data gaps are replaced by interpolated data. Data are generally of good quality with a few gaps only. However, A3 270 kHz absorptions from Pr
uhonice and Nagycenk and fmin from Grocka and Moscow are
excluded from the analysis due to a more than acceptable number of data gaps. Values of fmin from
Kaliningrad are omitted due to peculiar morning maximum coinciding with morning rush hours (proba-bly arti®cial increase of fmindue to trac or industrial
noise). Values of fmin from Juliusruh are not used
because almost 80% of values are at the lowest instrumental limit, 1.5 MHz, thus they do not allow to detect ionospheric variability.
Geographic coordinates of stations and parameters of A3 and IPHA radio circuits are given in Tables 1 and 2. Stations participating in the campaign covered Europe and Eastern Asia, and two stations, Irkutsk and Sverdlovsk, represented eastern and western Sibe-ria. The available ionospheric data described the lower ionosphere at middle latitudes of the Northern Hemi-sphere at altitudes of about 85±100 km (except for
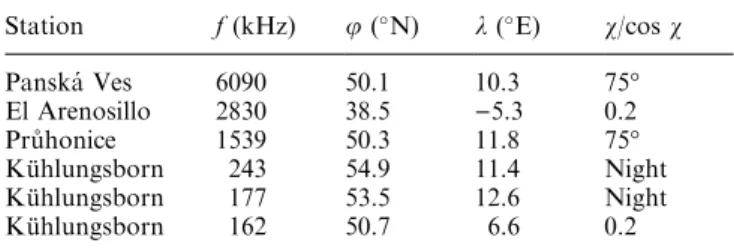
Table 1. Parameters of A3 absorption and IPHA (162 kHz) radio circuits used, name or location of station, frequency, latitude (u) and longitude (k) of the re¯ection point (a region of the ionosphere described by the data), the constant solar zenith angle used
Station f(kHz) u(N) k(E) v/cosv
Panska Ves 6090 50.1 10.3 75°
El Arenosillo 2830 38.5 )5.3 0.2
PruÊhonice 1539 50.3 11.8 75°
KuÈhlungsborn 243 54.9 11.4 Night KuÈhlungsborn 177 53.5 12.6 Night
KuÈhlungsborn 162 50.7 6.6 0.2
Table 2. List offminmeasurements used, name of station, latitude
(u) and longitude (k), the constant solar zenith angle (cosv)
Station u(°N) k(°E) cosv
Beijing 39.9 116.4 0.2
Ebro 40.8 0.3 0.2
Irkutsk 52.5 104.0 0.2
Kokobunji 35.7 139.5 0.2
Okinawa 26.3 127.8 0.2
Roma 41.9 12.5 0.2
Slough 51.5 )0.6 0.2
So®a 42.6 23.4 0.2
Sverdlovsk 56.7 51.1 0.2
Wakkanai 45.5 141.7 0.2
IPHA near 80±81 km). The A3 absorption and IPHA measurements were run continuously only in Europe, all existing measurements are used.
The only electron density pro®le measurements made during the CRISTA/MAHRSI campaign are those obtained by a partial re¯ection radar at Nizhni Novgo-rod, Russia.
To characterize ``meteorological'' conditions of the middle atmosphere, we use polar temperatures at 10 and 30 hPa provided by the Stratospheric Group of the Free University, Berlin, as characteristics of development of the polar vortex, and winds in the upper middle atmosphere near 95 km as measured at Collm (R. Schminder and D. KuÈrschner, Results of high-atmosphere wind observations at Collm, October 1994 and November 1994). Unfortunately, other wind mea-surements in the region of interest from Shigaraki/ Kyoto, Irkutsk and Obninsk have an unacceptably high number of days of no measurements for analyses made in the study.
Solar and geomagnetic activity during the period studied is described by general indices, sunspot number
R, F10.7 and Ap, and by the composite solar
Lyman-alpha ¯ux (Tobiska et al., 1997), which for October-November 1994 is identical with the SOLSTICE/UARS Lyman-alpha ¯ux.
3 CRISTA/MAHRSI campaign
3.1 Long-term comparisons
The purpose of long-term comparisons is to answer the question whether the CRISTA/MAHRSI campaign was run under normal/climatological conditions or under anomalous conditions. The available data allow us to answer this question reliably for heights of about 80± 100 km (upper middle atmosphere) for Europe and
Eastern Asia. For this purpose we use long series of measurements of absorption and partly offmin. The data
series must be longer than 20±25 y, homogeneous, and reliable. Not all data series ful®ll these conditions.
The October and November 1994 values of absorp-tion and fmin are compared with values of these
parameters from Octobers and Novembers of previous years under similar solar activity conditions: declining phase of solar cycle, 10 <R< 60, 70 <F10.7 < 100,R
and F10.7 being monthly averages. Such a comparison
for the LF nighttime absorptions from central Europe was presented by LasÏtovicÏka et al. (1997). Based on three data sets, which covered the period of the 1960s to the 1990s, they concluded that the LF absorption in October±November 1994 was close to the values ex-pected on the basis of LF absorptions from previous years observed under similar conditions. In order to characterize better the area studied, we add here the results of long-term comparisons of fmin from Slough
(England) and from three Japanese stations, Wakkanai, Kokobunji and Okinawa. The fmindata used for
long-term comparisons are noon-time medians (10±14 LT). They generally cover the 1970s to 1990s.
Table 3 presents the results of long-term compari-sons. These results illustrate problems with long-term analyses of lower ionosphere measurements. The 243 kHz absorption and Slough data display a positive trend. It is not our purpose to deal with long-term trends in the lower ionosphere and upper middle atmosphere. Information about results and related problems may be found e.g. in Bremer (1997), Danilov (1997) or LasÏ-tovicka (1997). The 270 kHz absorption is too high in early 1980s, but this was a period with low measurement quality. The 177 kHz absorption shows a drop from 1983 to 1984, which can be attributed to change of transmitted frequency from 185 to 177 kHz. Neverthe-less, when taking this all into account, absorptions and
fmin from Slough provide consistent values for 1994,
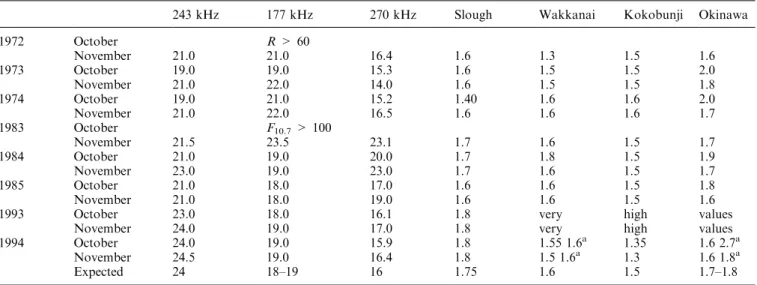
Table 3. Long-term development of the nighttime LF radio wave absorption in Central Europe at three frequencies and offminin Western
Europe (Slough) and Japan (Wakkanai, Kokobunji and Okinawa) under solar activity conditions similar to those of October±November 1994
243 kHz 177 kHz 270 kHz Slough Wakkanai Kokobunji Okinawa
1972 October R> 60
November 21.0 21.0 16.4 1.6 1.3 1.5 1.6
1973 October 19.0 19.0 15.3 1.6 1.5 1.5 2.0
November 21.0 22.0 14.0 1.6 1.5 1.5 1.8
1974 October 19.0 21.0 15.2 1.40 1.6 1.6 2.0
November 21.0 22.0 16.5 1.6 1.6 1.6 1.7
1983 October F10.7> 100
November 21.5 23.5 23.1 1.7 1.6 1.5 1.7
1984 October 21.0 19.0 20.0 1.7 1.8 1.5 1.9
November 23.0 19.0 23.0 1.7 1.6 1.5 1.7
1985 October 21.0 18.0 17.0 1.6 1.6 1.5 1.8
November 21.0 18.0 19.0 1.6 1.6 1.5 1.6
1993 October 23.0 18.0 16.1 1.8 very high values
November 24.0 19.0 17.0 1.8 very high values
1994 October 24.0 19.0 15.9 1.8 1.55 1.6a 1.35 1.6 2.7a
November 24.5 19.0 16.4 1.8 1.5 1.6a 1.3 1.6 1.8a
Expected 24 18±19 16 1.75 1.6 1.5 1.7±1.8
which are very close to what can be expected based on values from previous years. No other European data contradict this result. Thus in Europe the period October±November 1994 showed an average behaviour very close to the climatological one.
The Japanese data must be handled carefully. In the 1970s and the ®rst half of the 1980s, ionograms were scaled manually. On the other hand, in the 1990s the basic scaling was automated except for Kokobunji, where the results of both automatic and manual scaling have been reported. There is a surprisingly large, systematic dierence between the Kokobunji fminfrom
automatic and manual scaling. The former was 20±45% higher than the latter in October±November 1993 and 1994. Therefore the manual Kokobunji 1994 data are lower than expected, while the automatic scaling data of two other stations are apparently higher than expected. To help to resolve the problem with automatic scaling, the data from Wakkanai and Okinawa for 1994 were re-scaled manually. The results of re-scaling, shown in Table 3, con®rm the dierence between automatic and manual scaling, even though it is small for Wakkanai and large for Okinawa. Taking into account only the results of manual scaling, which are generally considered to be more reliable, we obtain for all three Japanese stations values lower than expected for 1994. This means that the lower ionosphere above Japan in October± November 1994 appears to be quieter than expected, i.e. it corresponds rather to the extreme minimum of the solar cycle. Values for 1993 were substantially higher than they should be. Since we do not know why (since solar/geomagnetic activity is not the reason due to absence of such an increase in Europe), the Japanese data of 1993 (automatic scaling) have not been consid-ered.
A multicomponent regression analysis has been applied to another long ionospheric data series (25 y, 1971±1996), absorption at 6090 kHz. The analysis has been performed separately for monthly median values from October and from November with input pa-rameters: F10.7, Ap, time (for trend), QBO50 hPa,
QBO30 h Pa and ENSO. The model describes 65% of variance for November and slightly less for October.
F10.7is by far the most important input factor (through
the eect of solar cycle), which itself describes 57% of variance for November. The model values for October and November 1994 are slightly lower than the observed values but the dierence is within 1r of observations. Thus these data con®rm the basic ``normality'' of the period October±November 1994 in Europe.
It should be mentioned that the magnitude of planetary wave activity, inferred for October±November 1994 from daytime radio wave absorption measure-ments in Europe, was also very close to expected values (Pancheva and LasÏtovicka, 1998). The gravity wave activity, inferred from the nighttime 270 kHz absorption measurements in Central Europe, reached expected values, as well (LasÏtovicka et al., 1997). These results complete the pattern of an almost ``climatological'' state of the upper middle atmosphere over Europe in Octo-ber±November 1994.
3.2 Lower Ionosphere during the Campaign
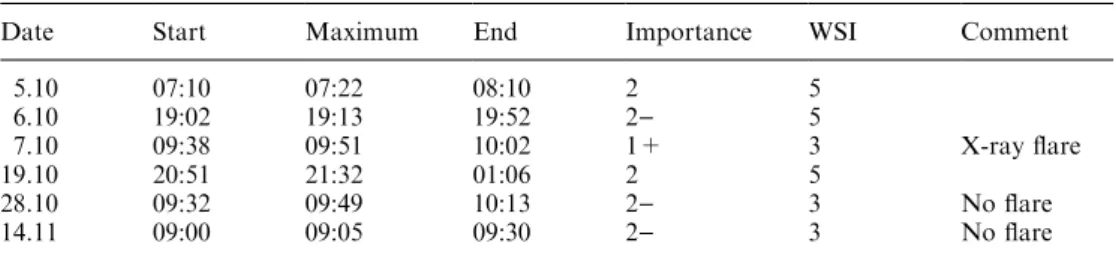
To describe the lower ionosphere during the CRISTA/ MAHRSI campaign, let us start with ionospheric eects of solar ¯ares, sudden ionospheric disturbances (SIDs), and with information about geomagnetic activity. The list of all important SIDs (importance >1, widespread index >2) taken from Solar-Geophysical Data (NGDC/ NOAA, Boulder) is given in Table 4. The solar ¯are/ SID activity was moderate to low, particularly if considering that the last two events with WSI = 3 were reported only as SEAs, i.e. their reliability is highly questionable. There was no important SID during the CRISTA/MAHRSI Shuttle experiment.
The lower ionosphere may be substantially aected by geomagnetic storms (e.g. brief review by LasÏtovicka, 1996), even though there is a poor correlation of ionospheric variability with geomagnetic activity in October±November 1994 with exception of the 243 kHz and partly 177 kHz absorption. To this end, geomagnetic storms were examined. There were several geomagnetic storms with maximumKp> 5. A
double-peak event with maximaKp= 7 on October 3 and 5+
on October 5 occurred in early October, another one with high activity on 22±24 October peaked on 22 October, Kp= 6+. The largest storm of this period
occurred on 29±31 October with maximum on 29 October of Kp= 7. In November only short storms
occurred with maxima on 4 November (5+), 6 Novem-ber (6)), 20 November (5) and 26 November (6+). Thus
the period October±November 1994 exhibited higher geomagnetic than solar activity and the interval of the CRISTA/MAHRSI experiment itself was not geomag-netically quiet in its early part.
The correlation of ionospheric parameters with solar and ``meteorological'' parameters is poor on average for October±November 1994 (Sect. 4). Nevertheless, a few
Table 4. List of important SIDs in October±November 1997. WSI, widespread index (maximum 5), importance indicates importance of SID (maximum 3+)
Date Start Maximum End Importance WSI Comment
5.10 07:10 07:22 08:10 2 5
6.10 19:02 19:13 19:52 2) 5
7.10 09:38 09:51 10:02 1+ 3 X-ray ¯are
19.10 20:51 21:32 01:06 2 5
28.10 09:32 09:49 10:13 2) 3 No ¯are
ionospheric parameters are aected by ``meteorological'' variables. Therefore the course of T10 hPa is shown in Fig. 1. The low temperatures reached on early days of November 1994 indicate establishment of polar vortex. Some increase of temperature in mid-November togeth-er with correlation of T10 hPa with Irkutsk fminas the
only correlating ionospheric parameter (Table 7) indi-cate possible shift of vortex centre towards eastern Siberia.
Figures 2±5 show behaviour of various ionospheric parameters, arranged according to geographic regions and type of measurements, during October±November 1994. Figure 2 displays an evidently dierent pattern of Irkutsk fmin variability compared to other ionospheric
data. No other station but Irkutsk (eastern Siberia) reveals a strong increase from October to November. Moreover, Irkutsk is the only station correlating with T10 hPa and the only station with a well-pronounced
10-day wave in the spectrum of planetary wave-type
oscillations (Pancheva and LasÏtovicka, 1998), see e.g. four10-day waves between days 20±61.
Figure 3 reveals a substantially dierent behaviour of the lower ionosphere over northern (Wakkanai) and southern (Okinawa) Japan, particularly in terms of day-to-day variations and a very poor correlation (r=)0.1,
Table 5). Also mutual correlations among other Japa-nese data are very poor (Table 5). In terms of somewhat smoothed behaviour, there are some features observed both in Wakkanai and Beijing, but in terms of day-to-day variability there is again no correlation (r= 0, Table 5 ± however, for November replacement of Wa-kkanai automatic-scaled data by manually-scaled data improves the correlation substantially).
During the CRISTA/MAHRSI experiment itself (November 4±12, days 35±43 in Figs. 1±5), the average
level of fmin was close to the mean level of the whole
October-November 1994 period for Beijing, Wakkanai, Roma(Rome), Ebro, 6090 kHz absorption and night-time LF absorptions in central Europe (LasÏtovicka
et al., 1997), slightly higher for Slough, 2830 kHz absorption and 1539 kHz absorption, and somewhat higher for the southernmost station Okinawa (by more than 0.1 MHz compared to the rest of November),
0 20 40 60
Days (October-November 1994) -90
-80 -70 -60 -50
10 hP
a temper
ature (C)
Fig. 1. Development of the North Pole stratospheric temperature at 10 hPa during October±November, 1994 (days 1±61).Short horizontal lineindicates interval of the CRISTA/MAHRSI experiment
0 20 40 60
Days (October-November 1994) 1.2
1.6 2.0 2.4
Beijing
Irkutsk
fmin (MHz)
Fig. 2. Parameterfminfrom Beijing (solid line) and Irkutsk (dashed line) during October±November, 1994 (days 1±61).Short horizontal line, interval of the CRISTA/MAHRSI experiment
0 20 40 60
Days (October-November 1994) 1.2
1.6 2.0 2.4
Okinawa Wakkanai
fmin (MHz)
Fig. 3. Parameter fmin from Wakkanai (solid line) and Okinawa
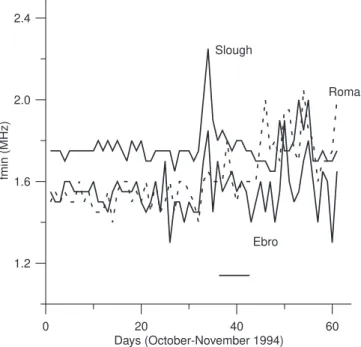
which was an essentially consistent pattern. However, on the day-to-day scale there was little similarity and correlation. The lower ionosphere appears to be dom-inated by local factors. The most remarkable feature on the day-to-day scale is the strong peak observed on November 3, just before the beginning of experiment, by
the two most westerly located ionosondes at Slough and Ebro (Fig. 4).
In Europe, the lower ionospheric parameters during the interval of the CRISTA/MAHRSI experiment were predominantly close to average values of the period October±November 1994, which were close to values expected from long-term comparisons. Consequently, in Europe the interval of the CRISTA/MAHRSI experi-ment appears to describe by its average values the upper middle atmosphere in an essentially climatological state. In Japan the situation is not so evident. Thefminduring
the CRISTA/MAHRSI experiment was close to average value of the period October±November 1994 for Wa-kkanai, slightly higher for Kokobunji and Yamagawa, and somewhat higher for Okinawa. On the other hand, long-term comparisons seem to show that the values observed in October±November 1994 were lower than expected. As a consequence of these two opposite tendencies, the lower ionosphere over Japan again seems to be relatively close to the climatological state in its average values during the CRISTA/MAHRSI experi-ment.
European fmin values reveal more variability in
November (e.g. Fig. 4), while Eastern Asian values show greater variability in October (e.g. Fig. 3). This is consistent with the pattern of planetary wave activity inferred from ionospheric data (Pancheva and LasÏ-tovicÏka, 1998).
The dominant feature of absorption data (Fig. 5) is a large day-to-day variability, which does not seem to correlate much between various radio paths; we again see a rather local pattern of variability. However, the partly smoothed variations of the 2830 kHz El Areno-sillo absorption and the 6090 kHz Panska Ves absorp-tion reveal basic similarity in spite of a large distance between re¯ection points (d> 1000 km), which results in a fairly good correlation between them (Tables 5 and 6). They both describe the bottomside E-layer of the ionosphere.
Taking into account the timing of the observed geomagnetic storms versus the development of absorp-tion andfminfor more northern radio paths/stations and
correlations with geomagnetic activity, we may conclude that the observed geomagnetic storms did not aect the midlatitudinal ionosphere signi®cantly except for the two nighttime radio paths, located at the highest geomagnetic latitudes among the analyzed ionospheric data.
3.3 Electron density measurements
The only electron density measurement campaign for CRISTA/MAHRSI was run at Nizhni Novgorod, Russia (56.2°N, 44.3°E) from 26 October to 11 Novem-ber 1994, using a partial re¯ection radar working at a frequency of 2.95 MHz. Measurements are available on days October 26±31, November 1±3 and November 10± 11 at altitudes between 60 and 90 km.
Figure 6 shows the development of the electron density pro®le over the period of measurements at a
0 20 40 60
Days (October-November 1994) 1.2
1.6 2.0 2.4
Slough
Ebro
Roma
fmin (MHz)
Fig. 4. Parameterfminfrom Slough (solid line), Ebro (solid line) and
Roma (Rome) (dashed line) during October±November 1994 (days 1±61). Short horizontal line, interval of the CRISTA/MAHRSI experiment
0 20 40 60
Days (October-November 1994) 0
10 20 30 40 50
1539 kHz
2830 kHz 6090
kHz
Absor
ption (dB)
quasi-constant solar zenith angle of about 71°. Electron
densities measured during the CRISTA/MAHRSI ex-periment (November 3 and 11) are remarkably higher than those measured before the experiment (October 26 ± November 1). The maximum electron densities on November 3 coincide with the sharp peak of fmin at
Slough and Ebro (Fig. 4), but such a peak does not occur in the area between these two regions.
The development of electron density pro®les in the D-region with the course of day is shown in Fig. 7. Almost all pro®les reveal an indication of the existence of the C-layer, a layer peaking between 65±70 km.
Otherwise the pro®les essentially con®rm the strong solar zenith angle control of electron density in the D-region with some exception at the C-layer heights, where between 60±67.5 km the pro®le measured at 10:45 LT appears to dominate. The dominant role of cosmic rays in ionization at the C-layer heights may explain the missing solar zenith angle control.
Be Eb Ir Ko Ok Ro Sl So Sv Wa Ya 609 IPH 153 177 243 283
Beijing 1 0.1 0 )0.2 0 0 0.1 0.1 )0.2 0.1 )0.2 )0.2 0 )0.1 0.1 0 )0.2
Ebro 0.1 1 0 0.2 0 0.3 0.5 0.2 0.1 )0.1 0 0.4 )0.2 0.1 0.2 )0.1 0.2
Irkutsk 0 0 1 )0.2 0.3 0.5 )0.2 0.4 )0.1 )0.2 )0.1 )0.1 )0.3 0.1 )0.1 0 0
Kokobunji )0.2 0.2 )0.2 1 0.1 )0.2 0.2 )0.1 0.1 0.2 0 0.1 0 0.1 0 0 0.1
Okinawa 0 0 0.3 0.1 1 )0.1 0 0.1 0.3 0.2 0 0 0.1 0 0 )0.2 0.3
Roma 0 0.3 0.5 )0.2 )0.1 1 0.1 0.5 )0.1 )0.2 )0.1 0.3 )0.4 0 0 0.1 0.2
Slough 0.1 0.5 )0.2 0.2 0 0.1 1 0.4 )0.2 0 0 0.4 )0.4 0.1 0.4 )0.2 0.2
So®a 0.1 0.2 0.4 )0.1 0.1 0.5 0.4 1 )0.2 0.1 0 0.3 )0.6 0.1 0 )0.1 0.3 Sverdlovsk )0.2 0.1 )0.1 0.1 0.3 )0.1 )0.2 )0.2 1 0.1 )0.1 0.1 0.2 )0.2 0 0 0.3 Wakkanai 0.1 )0.1 )0.2 0.2 0.2 )0.2 0 0.1 0.1 1 0.1 )0.1 0 0 )0.2 )0.2 0
Yamagawa )0.2 0 )0.1 0 0 )0.1 0 0 )0.1 0.1 1 0.2 0 0.1 0 )0.1 0.2
6090 kHz )0.2 0.4 )0.1 0.1 0 0.3 0.4 0.3 0.1 )0.1 0.2 1 )0.4 0.2 0.3 0 0.5 IPHA 0 )0.2 )0.3 0 0.1 )0.4 )0.4 )0.6 0.2 0 0 )0.4 1 )0.4 )0.2 )0.2 )0.1
1539 kHz )0.1 0.1 0.1 0.1 0.1 0 0.1 0.1 )0.2 0 0.1 0.2 )0.4 1 0 0.2 )0.1
177 kHz 0.1 0.2 )0.1 0 0 0 0.4 0 0 )0.2 0 0.3 )0.2 0 1 0.1 0.2
243 kHz 0 )0.1 0 0 )0.2 0.1 )0.2 )0.1 0 )0.2 )0.1 0 )0.2 0.2 0.1 1 0
2830 kHz )0.2 0.2 0 0.1 0.3 0.2 0.2 0.3 0.3 0 0.2 0.5 )0.1 )0.1 0.2 0 1
0 500 1000 1500 2000 2500
Electron density (cm )-3 76
80 84 88
3.11. 11.11.
30.10. 1.11.
26.10. 28.10.
Height (km)
Fig. 6. Development of the electron density pro®le over Nizhni Novgorod atv= 71°during 26 October±11 November 1994
0 500 1000 1500 2000 2500
60 65 70 75 80 85
11 November 1994 09:20 10:45
12:45 11:45
Electron density (cm )-3
Height (km)
Fig. 7. Development of the electron density pro®le over Nizhni Novgorod during 11 November, 1994. Two pro®les without time information were measured at 13:45 and 14:45 (all times are local times). The latter provides the lowest electron densities in 65±75 km. The corresponding solar zenith angles vary between 74°(11:45) and
81°(09:20 and 14:45)
Table 5. Matrix of correlation coecients for all analyzed iono-spheric parameters, October±November 1994. Correlation coe-cients signi®cant at the 0.01 level are underlined. Negative
correlations with IPHA are due to the fact that an increase of electron density causes an increase of absorption andfminbut a
4 Response of the lower ionosphere to solar and meteorological forcing
The response of the lower ionosphere at (higher) middle latitudes to solar and meteorological forcing depends on season; it is dierent in winter with shorter daytime period and an in¯uence of polar vortex on the lower ionosphere (e.g. LasÏtovickaet al., 1990), and in summer. The CRISTA/MAHRSI period represents an interme-diate period of change at autumn, with formation of the polar vortex, change of winds in the stratosphere and mesosphere etc.
First, matrices of correlation coecients of all available daily ionospheric (17 stations/radio circuits, see Tables 1 and 2), solar (4 parameters) and meteoro-logical (4 parameters) data were calculated for the whole interval studied, and separately for October and for November 1994. This division is not arti®cial, because the wintertime polar vortex seems to be established approximately with the beginning of No-vember 1994, geomagnetic activity was substantially lower in November, and planetary wave activity in-ferred from absorption was also evidently dierent in October and November (Pancheva and LasÏtovicka, 1998). The correlation between geomagnetic activity (Ap) and solar indices/parameters R,F10.7 and
Lyman-alpha ¯ux was quite insigni®cant, r= 0.06, 0.13 and
)0.03, respectively. This made separation of solar
ionizing radiation and geomagnetic activity eects reasonable. The correlation between daily values of R
and F10.7was close,r= 0.90, but this was not the case
as regards their correlation with the solar Lyman-alpha ¯ux, where r= 0.57 and 0.36. This illustrates the known, but not always accepted, fact that the day-to-day changes of solar indices do not describe suciently well the day-to-day changes of solar ionizing radiation. The general level of solar activity in October±November
1994 was moderate to low, thus the Lyman-alpha ¯ux dominated in ionizing the lower ionosphere over solar X-rays both in absolute values and in ionospheric variability; the latter was controlled prevailingly by solar X-rays under high solar activity conditions, e.g. LasÏtovicka and BosÏka (1982).
The mutual correlations between ``meteorological'' parameters were also dierent. There was a close correlation between daily values of the North Pole 10 hPa and 30 hPa temperatures, r= 0.92, 0.86 and 0.85 for the whole period, October and November, respectively. The correlation between zonal and meri-dional wind from Collm was only moderate,r= 0.49, 0.66 and 0.42, respectively. Correlations of the North Pole 10 hPa and 30 hPa temperatures with meridional wind from Collm are negligible, aboutr= 0.1, and with zonal wind again negligible, aboutr=)0.1. However, correlations of both wind components with tempera-tures are more positive in October, aboutr= 0.45 and 0.20 for 10 and 30 hPa temperatures, respectively, and are close to zero in November (Table 6). Thus Collm winds near 95 km are almost independent of North Pole stratospheric temperatures.
Table 5 shows the matrix of correlation coecients of all ionospheric parameters studied for the whole CRISTA/MAHRSI campaign. Correlations are gener-ally weak and mostly statisticgener-ally insigni®cant. This is the case particularly for Eastern Asia (Beijing, Irkutsk, Wakkanai, Kokobunji, Yamagawa, Okinawa), where no correlation is statistically signi®cant. Thus the behaviour of fmin at various stations seems to be
basically independent of each other. However, it should be mentioned that it might be partly an artifact of a relatively quiet situation combined with low resolution of fmin determination, which both enhance the role of
random errors and local variations/in¯uences. Another reason might be a rather large latitudinal span covered
Ebro Rom Slou So® 609 IPH 153 177 243 283 R F10 Lya T10 T30 mer zon
Ebro 1 0.3 0.5 0.2 0.5 )0.1 0.1 0.3 )0.1 0.2 0 0.1 0 0.1 0.1 )0.1 )0.2 Roma 0.3 1 )0.1 0.2 0.2 0.1 )0.4 0 0.2 0 )0.6 )0.6 )0.2 0.4 0.3 )0.2 0.2 Slough 0.5 )0.1 1 0.3 0.5 )0.5 0.1 0.5 )0.4 0.2 0.4 0.4 0.2 0.1 0.2 )0.2 )0.2
So®a 0.2 0.2 0.3 1 0.4 )0.3 0 0.3 )0.1 0.4 )0.2 0 )0.2 0 0 0 0.2
6090 kHz 0.5 0.2 0.5 0.4 1 )0.6 0.2 0.7 )0.1 0.6 )0.1 0 )0.2 0.4 0.4 )0.2 )0.2 IPHA )0.1 0.1 )0.5 )0.3 )0.6 1 )0.3 )0.6 )0.1 )0.2 0.1 0.1 0.1 )0.1 )0.1 0.3 0 1539 kHz 0.1 )0.4 0.1 0 0.2 )0.3 1 0.3 )0.1 0.1 0.3 0.4 0 )0.4 )0.4 0.1 )0.2 177 kHz 0.3 0 0.5 0.3 0.7 )0.6 0.3 1 )0.1 0.2 0.1 0.1 )0.2 0 0 )0.5 )0.4 243 kHz )0.1 0.2 )0.4 )0.1 )0.1 )0.1 )0.1 )0.1 1 )0.1 )0.3 )0.3 )0.1 )0.1 0 )0.2 0 2830 kHz 0.2 0 0.2 0.4 0.6 )0.2 0.1 0.2 )0.1 1 0 0.1 )0.2 0.2 0.2 0.1 0.1
R 0 )0.6 0.4 )0.2 )0.1 0.1 0.3 0.1 )0.3 0 1 0.9 0.5 )0.2 )0.2 0 )0.4
F10.7 0.1 )0.6 0.4 0 0 0.1 0.4 0.1 )0.3 0.1 0.9 1 0.4 )0.4 )0.3 0 )0.4
Lyman-a 0 )0.2 0.2 )0.2 )0.2 0.1 0 )0.2 )0.1 )0.2 0.5 0.4 1 )0.1 0.1 )0.1 )0.4 T10 hPa 0.1 0.4 0.1 0 0.4 )0.1 )0.4 0 )0.1 0.2 )0.2 )0.4 )0.1 1 0.9 0 0.2
T30 hPa 0.1 0.3 0.2 0 0.4 )0.1 )0.4 0 0 0.2 )0.2 )0.3 0.1 0.9 1 )0.1 0
Collm-me )0.1 )0.2 )0.2 0 )0.2 0.3 0.1 )0.5 )0.2 0.1 0 0 )0.1 0 )0.1 1 0.4 Collm-zo )0.2 0.2 )0.2 0.2 )0.2 0 )0.2 )0.4 0 0.1 )0.4 )0.4 )0.4 0.2 0 0.4 1
Table 6. Matrix of correlation coecients for European iono-spheric parameters, solar parameters and meteorological para-meters, November 1994. Correlation coecients signi®cant at the 0.01 level are underlined. Negative correlations of ionospheric
parameters with IPHA are due to the fact that an increase of electron density causes an increase of absorption and fminbut a
by data from Eastern Asia. Sverdlovsk data (western Siberia) appear to be uncorrelated with all other ionospheric data, as well.
A better situation is found for Europe. IPHA and the 6090 kHz absorption have the ``right'' sign of correla-tion (+ for 6090 kHz, )for IPHA) with all European
ionospheric data and statistically signi®cant correlations with ®ve and six of them out of nine. Also Slough reveals a statistically signi®cant correlation with ®ve and So®a with four European data sets. It might be of some interest that Irkutsk correlates better with European data than Sverdlovsk. Somewhat poorer correlation of the 243 kHz absorption is due to its correlation with the geomagnetic activity index Ap (r= 0.5) as a
conse-quence of its highest geomagnetic latitude and use of nighttime data. For all other ionospheric data the correlation with Ap is weak, if any, not better than
about r= 0.2 (except for r= 0.28 for the 177 kHz nighttime absorption).
Mutual correlations among ionospheric data in autumn (October±November 1994) are evidently much poorer than in winter, as shown by MAP/WINE (LasÏtovicka et al., 1990) and DYANA (LasÏtovicka
et al., 1994) campaign data.
Correlations among ionospheric parameters in Octo-ber were even slightly worse than those shown in Table 5. However, this is not the case for November. For Eastern Asia and western Siberia (Sverdlovsk), correlations are improved very little and remain essen-tially as poor as they are for the whole interval. Replacement of automatically scaledfmin of Wakkanai
and Okinawa by manually scaled values improves considerably the correlation between Wakkanai and Beijing, but all other correlations remain as poor as they were before this replacement. For Europe, however, we ®nd some improvement of correlations, as shown in Table 6. The 6090 kHz absorption now correlates fairly well with most of European ionospheric data (r= 0.5± 0.7). Also majority of other stations/circuits display a visible improvement of mutual correlations. Neverthe-less, they remain lower than wintertime correlations from campaigns MAP/WINE and DYANA.
Table 6 reveals no detectable solar activity control of the European lower ionosphere, particularly when considering the Lyman-alpha ¯ux. The same is valid for the whole period October±November 1994 and also for data from Eastern Asia.
During MAP/WINE, ionospheric data were predom-inantly organized according to altitude, not latitude or longitude (LasÏtovickaet al., 1990). This does not seem to be the case for CRISTA/MAHRSI. Table 6 does not indicate a dependence on altitude, e.g. because of a relatively good correlation of European fmin data with
IPHA, which describes the lowest height of the height interval studied.
Table 6 displays some correlation of ionospheric parameters with the lower thermospheric winds only for 177 kHz but this correlation is of opposite sign to that observed in winter (e.g. LasÏtovicka et al., 1994). Data for the whole interval do not provide any statistically signi®cant correlation of ionospheric parameters with
winds from Collm, which was a representative wind for majority of the analyzed European ionospheric data in the MAP/WINE winter (e.g. LasÏtovickaet al., 1990). As for correlations of ionospheric parameters with the North Pole temperatures, T10 and T30, the best and of right sign correlations are found for Irkutsk, )0.3 for
October,)0.5 for November and)0.7 for the October± November period, which indicates that the coincidence is mainly in long-term development of temperatures and
fminfrom Irkutsk. Other ionospheric parameters display
rather poor relationships to T10 and T30.
Table 5 shows that Irkutsk does not correlate much with other ionospheric parameters and for November itself it is even worse, because Irkutsk reveals negative correlations with most of ionospheric parameters. To-gether with its highest correlation with T10 and T30 and evidently better correlation in November than in Octo-ber it all could indicate a displacement of a newly created polar vortex in November towards Irkutsk (eastern Siberia).
To obtain a deeper insight into the results of correlation analysis, principal component analysis (PCA, sometimes called factorial analysis; e.g., Joreskog
et al., 1976) without and with axis rotation has been applied to all parameters studied over the whole period and for November separately. October data do not ful®ll the Kaiser-Meyer-Olkin measure of sampling adequacy criterion, therefore the PCA is not applied to these data. Out of 25 parameters studied, 9/8 factors (whole period/November) describe more than 75% of variability and 14/12 factors more than 90% of vari-ability for the whole interval and for November, respectively, for the PCA without axis rotation. The general pattern provided by the PCA analysis is similar for both data sets, so we will present here only the results for the whole October±November interval shown in Table 7 for the ®rst nine factors. Unfortunately, the ®rst two factors represent a mixed in¯uence of solar activity and temperatures, and f4 of Ap and winds.
Factors f6±f9 re¯ect only relations between some ionospheric parameters. Consequently, only factor f3, which shows a positive eect of solar activity on fmin
from Slough and the 6090 kHz absorption, and f5, which shows a positive eect of geomagnetic activity on the 177 kHz absorption, may be, with some limitations used for grouping of data and physical interpretation of the results. Therefore we applied the varimax axis rotation and transformation (commercial software SPSS) to obtain scores shown in Table 8. These scores allow a better grouping of data. Only the ®rst ®ve factors re¯ect the in¯uence of solar and meteorological parameters on ionospheric parameters, therefore only the ®rst ®ve factors are shown in Table 8. The ®rst factor re¯ects the in¯uence of the north polar strato-spheric temperatures solely on Irkutsk fmin, probably
relations. The fourth factor reveals a limited in¯uence of the lower thermospheric wind on the lower ionosphere, only the 177 kHz absorption and in part, the 243 kHz
absorption are aected. For these two radio circuits the Collm wind may be geographically considered to be the local wind. Again solely these two absorption data sets are signi®cantly in¯uenced by geomagnetic activity, as shown by the ®fth factor. This is due to the fact that both absorptions are nighttime data (more sensitive to geomagnetic activity) and that their re¯ection points have the highest geomagnetic latitudes among the investigated ionospheric data. However, Table 8 clearly shows that the majority of ionospheric parameters are not signi®cantly aected by solar/geomagnetic and meteorological factors, used in this analysis.
We can conclude that there is generally no detectable solar or geomagnetic (except for nighttime absorptions at the highest geomagnetic latitudes) control of and a rather poor global meteorological in¯uence on the midlatitude lower ionosphere over Europe and Eastern Asia during October±November 1994. Much stronger meteorological control has been observed in winter, as shown by MAP/WINE (LasÏtovicka et al., 1990) and DYANA (LasÏtovicka et al., 1994) campaign results. Mutual correlations among ionospheric parameters and with solar and meteorological parameters have been slightly better even during summertime campaign MAC/ SINE (June±August 1987; LasÏtovickaet al., 1989).
The meteorological control of the day-to-day vari-ability appears to be best-developed in winter. During the MAP/WINE winter, 1 December 1983±31 March 1984, the controlling meteorological factor was neither local stratospheric temperature, nor wind near 95 km (even local wind), but the North Pole 10 hPa
temper-Table 7. PCA loadings (no axis rotation) for October±November 1994, all parameters studied. The ®rst nine factors, which cover 76.5% of the total variance, are shown. Important loadings are underlined
Factor f1 f2 f3 f4 f5 f6 f7 f8 f9
Percentage 20.2 11.6 10.4 8.7 6.7 5.5 4.7 4.5 4.2
Cumulative Percentage 20.2 31.8 42.2 50.9 57.7 63.2 67.8 72.3 76.5
Beijing 0 )0.1 0 )0.3 0.4 0.5 )0.1 0.3 0.3
Ebro )0.3 0.4 0.3 0.1 0.2 )0.1 )0.4 )0.1 0.1
Irkutsk )0.7 )0.2 )0.4 )0.3 )0.1 )0.1 0.1 0 )0.3
Kokobunji 0 0 0.2 0.5 0 0.2 )0.6 )0.1 )0.4
Okinawa )0.2 )0.1 0.4 0 )0.3 0.5 0.2 0.5 )0.2
Roma )0.7 0.2 )0.2 )0.1 0 )0.1 0 0 0.3
Slough )0.3 0.2 0.7 0.1 0.3 0.2 )0.1 )0.1 0
So®a )0.8 0 0.2 )0.2 )0.1 0.1 0 0 0.1
Sverdlovsk 0.2 0.4 0 0.1 )0.4 )0.3 )0.3 0.4 )0.2
Wakkanai 0.1 0.1 )0.1 0.2 0.1 0.4 0 )0.6 )0.2
Yamagawa 0 )0.1 0.3 0.2 )0.4 0 0.6 )0.2 )0.1
6090 kHz )0.4 0.4 0.5 0.3 )0.2 )0.1 0.1 0 0.3
2830 kHz )0.3 0.6 0.1 0.3 )0.3 )0.1 0.2 0.2 )0.1
1539 kHz )0.3 )0.5 0.3 0.3 0.1 0.4 0 )0.2 0
IPHA 0.8 0.2 )0.2 )0.2 )0.1 0 0 0.1 )0.2
177 kHz )0.1 0.3 0.3 0.2 0.6 0 0.3 0.2 )0.2
243 kHz )0.1 )0.2 )0.4 0.5 0.3 )0.2 0.1 0.2 0.1
R 0.6 )0.5 0.5 )0.1 0 )0.1 0 0 0.1
F10.7 0.7 )0.3 0.5 0 0 0 0 0 0.1
Lyman-a 0.1 )0.6 0.4 )0.1 0 )0.2 0 0.1 0.1
Ap 0.3 )0.1 )0.2 0.5 0.6 )0.1 0.2 0.3 )0.2
T10 hPa 0.8 0.6 0 0 0 0 0.1 )0.1 0.2
T30 hPa 0.8 0.5 0 0.1 0 0 0.1 )0.1 0.3
Collm-me 0.3 )0.3 )0.2 0.6 )0.3 0.2 )0.1 0.1 0.3
Collm-zo )0.3 )0.2 )0.3 0.6 )0.2 0.3 0 0 0.3
Table 8. PCA factor scores after varimax axis rotation and transformation for October±November 1994, all parameters studied, the ®rst ®ve factors. Important scores are underlined
Factor f1 f2 f3 f4 f5
Beijing 0.1 0 0.1 0.1 0
Ebro 0 0 0.3 0 )0.1
Irkutsk )0.2 )0.1 )0.2 )0.1 0
Kokobunji )0.1 0 0 0 0
Okinawa 0 0 )0.1 0 0
Roma )0.1 )0.1 0.1 0.1 )0.1
Slough 0 0.1 0.3 )0.1 0
So®a )0.1 0 0.1 0 )0.1
Sverdlovsk 0 )0.1 )0.1 0 0
Wakkanai 0 )0.1 )0.1 0 )0.1
Yamagawa 0 0 0 0 0
6090 kHz 0.1 0 0.3 0.1 0
2830 kHz 0 )0.1 0.1 0 0.1
1539 kHz )0.1 0.2 0.1 0 0.1
IPHA 0.1 )0.1 )0.2 )0.1 0
177 kHz 0 0 0.1 )0.3 0.4
243 kHz 0 0 0 0.2 0.4
R 0 0.3 0 0 0
F10.7 0.1 0.3 0 0 0
Lyman-a )0.1 0.3 0 0 0
Ap 0 0 )0.1 )0.1 0.5
T10 hPa 0.3 )0.1 0.1 0 0
T30 hPa 0.3 0 0.1 0.1 0
Collm-me 0.1 0 0 0.5 0
ature (LasÏtovickaet al., 1990). The dominant role of the polar stratospheric temperature means the decisive role of the global state of the polar stratospheric vortex. Correlation coecients between ionospheric parameters and T10 hPa were typically around r= )0.6 in the
MAP/WINE winter (LasÏtovicka et al., 1990). The DYANA winter, 1 January±31 March 1990, revealed a similar pattern with the dominant role of the North Pole 10 hPa temperature and correlation coecients typically around r=)0.5 (LasÏtovicka et al., 1994). In both
winters, the solar variability eect was substantially weaker than the eect of meteorological parameters. During the MAC/SINE summer, 1 June±31 August 1987, the correlation with meteorological parameters is very dierent for dierent ionospheric data and in average very weak, r= )0.2. Solar indices appear to
correlate better with ionospheric parameters (LasÏ-tovicka et al., 1989). The correlation of ionospheric parameters with meteorological parameters is even slightly worse in the CRISTA/MAHRSI autumn (e.g. Table 6) than in the MAC/SINE summer, except for one station Irkutsk. The same statement is valid also for the correlation with solar indices and even the solar Lyman-alpha ¯ux.
Hence the comparison of the four campaigns suggests the following overall pattern: In winter the lower ionosphere at northern middle latitudes appears to be fairly well ``meteorologically'' controlled with a very weak solar in¯uence. In summer, solar in¯uence is somewhat stronger and dominates the weak ``meteoro-logical'' in¯uence, but the overall solar/meteorological control is weaker than in winter. In autumn we ®nd the weakest overall solar/meteorological control, local ef-fects evidently dominate the behaviour of the lower ionosphere. These results are based on the analysis of the day-to-day variability of ionospheric data. The obtained seasonal pattern of the relative role of mete-orological and solar parameters in the lower ionosphere does not contradict the current understanding of the lower ionosphere behaviour.
During the MAP/WINE winter, the European ion-ospheric data were divided into two groups according to altitude, not latitude or longitude in spite of a large latitudinal and longitudinal extent of ionospheric ob-servations. These two groups responded with the oppo-site sign to the meridional wind near 95 km and the boundary between them (near 90 km) coincided with height of the change of sign of meridional wind (LasÏtovicka et al., 1990). A similar division of iono-spheric data according to altitude, related to the change of sign of the meridional wind component, was found also in the DYANA winter (LasÏtovicka et al., 1994), even though the strength of this eect was weaker because the DYANA period included the whole of March. The meridional wind can play a central role through transport of a nitric oxide rich air from auroral to middle latitudes in winter, when the photochemical lifetime of NO is relatively large (days). On the contrary, the autumnal CRISTA/MAHRSI ionospheric data do not show such a division related to the meridional wind. They do not display a systematic relation to and/or
correlation with the meridional wind and a division according to altitude (Tables 6 and 7). A shorter photochemical lifetime of NO probably contributes to the loss of the meridional wind eect. There were not enough data in the MAC/SINE summer to look for such a division.
5 The future of lower ionosphere monitoring
The data presented clearly show the limitations of lower ionospheric measurements. A remote satellite sounding of the neutral upper atmosphere is possible and at present it is made by UARS. However, the lower ionosphere itself (ionized component) is not accessible to satellite measurements. The only in situ measure-ments in the lower ionosphere are rocket measuremeasure-ments, which have been rare. The rocket monitoring made by the Russians has been terminated so that in the near future we can only expect a few rocket ¯ights per year worldwide.
This work is based on the ground-based radio propagation measurements of the lower ionosphere. The best ground-based measurements are those by the partial re¯ection radars, which provide electron density pro®les. Such measurements are, however, very scarce, during CRISTA/MAHRSI they were run only in Nizhni Novgorod. Moreover, they would be rather expensive for monitoring.
Another possibility is the use of a long-distance VLF radio paths. They have been used mainly for solar ¯are eects (SPA) monitoring and for investigations of short-time eects caused by particle precipitation (Trimpi eects etc.). However, they describe the lowermost part of the ionosphere and they are not suitable for inves-tigations of slow, longer-term changes. Their LF analog, the IPHA measurements used in this work, are currently made and evaluated along one radio path in Europe and used only for solar ¯are eect monitoring with one more path, and that is all. In other words, the quantity of these continuous measurements is quite insucient.
The worldwide network of ionosondes would in principle allow us to monitor the state of the lower ionosphere via the use of thefminparameter. However,
ionosondes have been designed and used for monitoring of the E- and F-layer ionosphere. Some ionosonde stations do not evaluatefminat all. Some others evaluate
this parameter routinely as a less important parameter without much quality control of fmin data. Another
problem is with the current trend to introduce automatic scaling of ionograms. As was illustrated in Sect. 3, the automatically scaledfminis of poor quality, particularly
in disturbed periods. It may be used for a routine service and a ``®rst-look'' information, but is inadequate for investigations. The problem is not really in quality of the measurements, but lies in the algorithm of fmin
frequen-cy of the ionosonde and resolution of thefmin
determi-nation from non-digital ionosondes. Nevertheless, some stations provide reasonably homogeneous and long data series to allow for studies of long-term changes, stronger eects and various large features.
The last but not least method are measurements of radio wave absorption in the lower ionosphere. The A1 measurements (vertical incidence sounding), popular in the past, has almost been stopped worldwide. These absorption values were instantaneous and they were formed in a relatively narrow height interval. However, there were some problems with height determination, with deviative absorption, and in some cases with calibration. The best long-term absorption data have been provided by the A3 method (oblique incidence on the ionosphere, continuous wave). The method exists in the LF and HF versions, which dier in ``ionospheric'' (or absolute) calibration. These measurements have been made predominantly in Europe. The longest homogeneous data series of such measurements is available at 243 kHz at Kuhlungsborn, Germany, almost 50 y of data. The A3 absorption is formed in an interval of altitudes, usually basically in the last 3±5 km below the re¯ection height. On one hand, it does not allow us to associate them with a single altitude, but on the other hand, it gives better information on the overall state of the lower ionosphere. The A3 absorption is suitable for studies of stronger events, of large features, and particularly of long-term trends and changes. The A3 method is very cheap, because it uses commercial radio transmitters (broadcasting etc.). This is, however, the weak point of the method, because the number of transmitters, working in the regime suitable for A3 absorption measurements, has been diminishing contin-uously and, thus, the number of A3 radio paths has slowly but continuously been reduced.
In summary we can say that current measurements have various described limitations. They provide good coverage in time (long, continuous data series) but insucient coverage in space. If the present-day trends in the lower ionospheric measurements and a relatively weak interest in these data continue, we are afraid that for future campaigns the lower ionosphere support will not be sucient. Taking into account the present-day interest in such measurements, and various technical, organizational and ®nancial problems, we do not see a near-future solution of the problem of lower ionosphere measurements/monitoring.
6 Conclusion
Lower ionospheric ground-based measurements, run in Europe and Eastern Asia over the period of 1 October± 30 November 1994 as a part of the CRISTA/MAHRSI campaign, were analyzed from two main points of view: (1) to decide whether the CRISTA/MAHRSI experi-ment was performed under normal or anomalous conditions, and (2) to investigate the role of solar and meteorological parameters in the variability of the lower ionosphere under autumn, moderate solar activity
conditions. Data on the A3 radio wave absorption in the lower ionosphere, fmin, IPHA and electron density
pro®les from 18 places were used.
For question (1), comparisons of the CRISTA/ MAHRSI experiment period data (4±12 November, 1994) with various long (25±30 y) ionospheric data series and data over the interval October±November 1994 (supporting campaign of ionospheric measure-ments) show that the state of the lower ionosphere (h= 80±100 km) in the interval of the CRISTA/MA-HRSI experiment is close to the expected average (typical) state in Europe and Japan. In other words, the CRISTA/MAHRSI experiment was run under conditions, which were in the upper middle atmosphere of the Northern Hemisphere middle latitudes close to climatological conditions in Europe and Japan. Thus the average results of the CRISTA/MAHRSI experiment can be used as climatological data, at least for the given area and altitudes (80±100 km).
As for item (2), the role of solar/geomagnetic and ``meteorological'' control of the lower ionosphere was investigated and compared with the results of MAP/ WINE, MAC/SINE and DYANA campaigns. The eects of solar and geomagnetic activity and global meteorological factors on the lower ionosphere at middle latitudes of the Northern Hemisphere were generally found to be weak during autumn 1994 compared to those in the MAP/WINE and DYANA winters, and they were even slightly weaker than those in the MAP/SINE summer. This means that the lower ionosphere varied predominantly on local, small scales. This statement is supported by certain correlations of the 243 and 177 kHz absorptions with ``local'' lower thermospheric wind from Collm. One of the reasons might be a rather moderate variability of solar activity (not large enough to overcome random noise variabil-ity). There were only a few exceptions, eastern Siberia (Irkutsk) was signi®cantly aected by polar vortex (North Pole T10 hPa and T30 hPa) in November, and both nighttime absorptions (243 and 177 kHz), which were measured at the highest geomagnetic latitudes among the ionospheric data investigated, were aected by geomagnetic activity.
The comparison of the four campaigns suggests the following overall pattern: in winter the lower ionosphere at northern middle latitudes appears to be fairly well ``meteorologically'' controlled with a very weak solar in¯uence. In summer, solar in¯uence is somewhat stronger and dominates the weak ``meteorological'' in¯uence, but the overall solar/meteorological control is weaker than in winter. In autumn we ®nd the weakest overall solar/meteorological control, local eects evi-dently dominate the behaviour of the lower ionosphere.
Acknowledgements. The authors would like to thank all those who contributed to successful measurements during the CRISTA/ MAHRSI campaign. The work of JL, JB and PM was supported by the Grant Agency of the Academy of Sciences of the Czech Republic under grant A3042502/1995.
References
Bremer, J., Long-term trends in the meso- and thermosphere as possible indications of atmospheric greenhouse eects, Adv. Space Res.,20,2075±2083, 1997.
Conway, R. R., M. H. Stevens, C. M. Brown, J. G. Cardon, S. E. Zasadil, and G. H. Mount, The middle atmosphere high resolution spectrograph investigations, J. Geophys. Res. (ac-cepted), 1998.
Danilov, A. D., Long-term variations in the temperature and composition of the mesosphere and lower thermosphere (a review), http://eos.wdcb.rssi.ru/journals/papers/9701/pap01. htm#®g6, 1997.
Joreskog, K. G., J. E. Kleven, and R. A. Reyment,Geological Factor Analysis, Elsevier, Amsterdam, 1976.
LasÏtovicka, J., Eects of geomagnetic storms in the lower ionosphere, middle atmosphere and troposphere, J. Atmos. Terr. Phys.,58,831±843, 1996.
LasÏtovicÏka, J., Long-term trends in the upper middle atmosphere as detected by ionospheric measurements,Adv. Space Res.,20,
2065±2073, 1997.
LasÏtovicka, J., and J. BosÏka,The dominant role of solar Lyman-alpha in D-region radio wave absorption,J. Atmos. Terr. Phys.,
44,793±795, 1982.
LasÏtovicka, J., J. BosÏka, D. Pancheva, G. Entzian, and R. Schminder,Behaviour of the midlatitude lower ionosphere during MAP/WINE and MAC/SINE periods,Proc. 3rdKAPG
Workshop on Meteorological Eects on the Ionosphere, Bulg. Acad. Sci., So®a, 1989.
LasÏtovicka, J., D. Pancheva, and X.-J. Zhang,On some dierence in the behaviour of the upper and lower part of the lower ionosphere in relation to meteorological parameters, Ann. Geophysicae,8,599±608, 1990.
LasÏtovicka, J., D. BuresÏovaÂ, J. BosÏka, J. Bremer, and F. MaÈrcz,Do CRISTA experiment/campaign data represent a typical situa-tion or not?Studia Geophys. Geod.,41,171±180, 1997.
LasÏtovicka, J., L. F. Alberca, E. A. Benediktov, J. BosÏka, J. Bremer, G. Entzian, V. Fiser, J.-C. Jodogne, A. K. Knyazev, F. MaÈrcz, B. A. de la Morena, Pl. Mukhtarov, T. Ogawa, D. Pancheva, H. Ranta, Z. T. Rapoport, and Xiong Nianlu,Lower ionosphere at middle latitudes: its morphology and response to meteorological and solar-terrestrial activity during the DYA-NA campaign 1990, J. Atmos. Terr. Phys., 56, 1947±1962, 1994.
Lauter, E. A., J. Taubenheim, and G. von Cossart, Monitoring middle atmosphere processes by means of ground-based low-frequency radio wave sounding of the D-region,J. Atmos. Terr. Phys.,46,775±780, 1984.
Oermann, D., K. U. Grossmann, P. Barthol, P. Knieling, M. Riese, and R. Trant, The CRyogenic Infrared Spectrometers and Telescopes for the Atmosphere (CRISTA) experiment and middle atmosphere variability, J. Geophys. Res. (accepted), 1998.
Pancheva, D., and J. LasÏtovicka, Planetary wave activity in the lower ionosphere during CRISTA I campaign,Ann. Geophys-icae, 16, 1014±1023, 1998.
Sato, T., Geomagnetic control of the winter anomaly in iono-spheric absorption of radio waves at mid-latitudes,J. Geophys. Res.,86,9137±9151, 1981.
Tobiska, W. K., W. R. Pryor, and J. M. Ajello, Solar hydrogen Lyman-alpha variation during solar cycles 21 and 22,Geoph. Res. Lett.,24,1123±1126, 1997.