INTRODUCTION
Rice blast, caused by the fungus Magnaporthe gri-sea (T.T. Hebert) Yaegashi and Udegawaq (anamorph Pyri-cularia grisea (Cooke) Sacc.), is one of the most impor-tant diseases of rice in the tropics, and is responsible for yield losses in both upland and irrigated rice production systems. Understanding the rice-Magnaporthe patho-system requires knowledge of the pathogen’s genetic di-versity and the mechanisms that lead to the development of new virulent genotypes. The development of technolo-gies that allow monitoring of the dynamics of fungal populations is crucial in designing strategies for disease control.
The genetic diversity of M. grisea and its correlation with pathotypes have been studied by various approaches, including repetitive DNA sequences. Since repetitive DNA sequences seem to be distributed throughout the pathogen genome (Weising et al., 1995), the differences and simi-larities among fungus isolates can be assessed in satellite regions and the data can be used to monitor disease epi-demics, population dynamics and the racial composition of pathogen populations. Long repetitive sequences that have been described and studied in the M. grisea genome include the Magnaporthe grisea repeats (MGR), contain-ing a core repetitive sequence of 1,860 bp, with an esti-mated average of 46 copies per genome (Hamer, 1991; Farman et al., 1996a). Some retrotransposon repetitive sequences such as grh (Dobinson et al., 1993) and MAGGY (Farman et al., 1996b) have also been detected in M. grisea DNA, with approximately 50 copies per genome.
Assess-ment of polymorphism at these repetitive eleAssess-ment regions among fungal isolates has relied on RFLP, which is often costly as well as time and labor intensive. Kachroo et al. (1994) described a method that uncovers the polymorphism of Pot2, another repetitive element found in the M. grisea genome, based on PCR with primers flanking the core re-petitive sequence. Alternatively, since simple sequence repeats (SSR) or microsatellite sequences are relatively abundant in microorganisms (Field and Wills, 1996), a pro-tocol that could efficiently uncover SSR loci in the ge-nome of the rice blast pathogen, together with a simple PCR assay to assess the polymorphism at these hyper-variable loci, would be very useful.
Microsatellites are highly informative repetitive se-quences of 2-6 bp, dispersed throughout the eukaryotic genome (Morgante and Olivieri, 1993; Taramino and Tingey, 1996). The development of SSR markers requires the iden-tification and sequencing of SSR loci and the construction of primers that can be used to amplify the alleles. Poly-morphism at microsatellite loci can be efficiently assessed by PCR (Weber and May, 1989). The alleles are usually separated and identified by high resolution polyacrylamide gel electrophoresis. Characteristics such as convenient analysis through PCR, a high number of alleles per locus, precise allele identification through the use of allelic lad-ders and the accurate comparison of data among research-ers and laboratories make SSR markresearch-ers one of the most informative techniques for genome mapping, DNA finger-printing and population studies (Taramino and Tingey, 1996). Allelic diversity at SSR loci caused by variation in the num-ber of repeats of the core sequence is probably caused by
Development of microsatellite markers for the genetic analysis
of
Magnaporthe grisea
Claudio Brondani1, Rosana Pereira Vianello Brondani1,2, Lucas da Ressurreição Garrido2 and Márcio Elias Ferreira2
Abstract
An AG microsatellite-enriched genomic DNA library was constructed for Magnaporthe grisea (anamorph Pyricularia grisea), the causal agent of rice blast. Seventy-two DNA clones containing microsatellite repeats were isolated and sequenced in order to develop a series of new PCR-based molecular markers to be used in genetic studies of the fungus. Twenty-four of these clones were selected to design primer pairs for the PCR amplification of microsatellite alleles. Single spore cultures of M. grisea isolated from rice and wheat in Brazil, Colombia and China were genotyped at three microsatellite loci. Isolates from southern Brazil were predominantly monomor-phic at the tested SSR loci, indicating a low level of genetic variability in these samples. However, seven alleles were observed at the MGM-1 locus in isolates from Central Brazil and at least nine alleles were detected at the same locus in a sample of Colombian isolates. Polymorphism analysis at SSR loci is a simple and direct approach for estimating the genetic diversity of M. grisea isolates and a powerful tool for studying M. grisea genetics.
1EMBRAPA Arroz e Feijão, Caixa Postal 179, 75375-000 Sto. Antônio de Goiás, GO, Brasil.
Send correspondence to C.B. E-mail: brondani@cnpaf.embrapa.br
polymerase “slippage” and a lack of repair during DNA rep-lication (Field and Wills, 1996).
The objectives of this work were i) to construct a microsatellite-rich DNA library of M. grisea; ii) to iden-tify, select and sequence microsatellite DNA clones; iii) to characterize microsatellite markers of the M. grisea genome, and iv) to genotype M. grisea isolates from dif-ferent areas and hosts using some of the newly developed SSR markers.
MATERIAL AND METHODS
M. grisea DNA extraction
Monosporic M. grisea cultures were obtained from M. grisea-infected rice leaves in the field. The leaves were kept in a humid chamber for 12 h at 22°C in the dark to induce sporulation. The spores were isolated from the leaves using a stereoscopic microscope, transferred to water-agar medium (1.7% agar) and kept at 24°C for 24 h under fluo-rescent light. After germination, the spores were isolated and transferred to solid oat medium (Tuite, 1969) con-taining 250 mg/l chloramphenicol and maintained at 26°C under fluorescent light for 15 days. Agar discs contain-ing mycelia and spores were used to inoculate liquid Fries medium (Tuite, 1969) and the culture was incubated at room temperature in the dark under stirring at 150 rpm. The mycelia were isolated from the medium, frozen in liquid nitrogen and ground to powder with a mortar and pestle. DNA was extracted from this powder using the extraction protocol described by Brondani et al. (1998).
Construction of SSR-enriched genomic library
An M. grisea SSR-enriched library was obtained as described by Rafalski et al. (1996). DNA (50 µg) from the M. grisea isolate PS-3 was digested with the restriction enzyme Tsp 509 I (New England Biolabs, Beverly, MA), and size separated by 2% agarose gel electrophoresis. Frag-ments ranging from 300-600 bp were recovered after elec-trophoresis using an NA-45 DEAE (diethylaminoethyl) membrane (Schleicher and Schuell, Keene, NH) inserted into the gel. The fragments were ligated to adapters at the Tsp 509 I restriction site. Positive clones containing SSR were selected by hybridization with biotinylated oligonucle-otides complementary to the repetitive sequence AG/CT, and recovered with magnetic beads linked to streptavidin (Dynal, Oslo, Norway). Microsatellite-rich fragments were amplified by PCR and cloned into phage Lambda Zap II (Stratagene, La Jolla, CA).
Selection and sequencing of SSR-positive clones and design of flanking primers
Plaques of a Lambda Zap II DNA library were lifted onto Hybond-N membranes (Amersham,
Buckingham-shire, England) and screened by hybridization with a digoxigenin-labeled poly (dA-dG) probe (Boehringer, Mannheim, Germany) to select fragments containing AG repeats. The positive plaques were selected and phagemids were isolated by in vivo excision, according to the manufacturer’s instructions. The presence, orientation and length of the inserts were determined by an anchor-PCR strategy (Rafalski et al., 1996). This method ensured that only clones containing repeats were amplified using a combination of primers that annealed to either T3 or T7 primer sites and to the SSR sequence of the insert. Sub-sequent electrophoresis on 3.5% agarose gels revealed clones containing SSR inserts and the direction within the vector from which they were to be sequenced. After in vivo excision, the phagemid DNA was isolated using Wiz-ard minipreps (Promega, Madison, WI). Double-stranded DNA samples were sequenced with an Applied Biosystems 377 DNA sequencer (Perkin-Elmer, Foster City, CA) us-ing dye terminator fluorescent chemistry (Roche Molecu-lar Systems, Branchburg, NJ), which consists of labeling each of the four dideoxyterminators (ddNTPs) with four different fluorescent dyes. When these terminators re-place standard dideoxynucleotides in enzymatic sequenc-ing, a dye label is incorporated into the DNA along with the terminating base. Each dye emits light at a different wavelength when excited by the laser light of the se-quencer so that the four ddNTPs can be detected. These data are transformed into a deoxynucleotide position in the DNA molecule that is being sequenced. The sequences of regions flanking microsatellite loci were used to de-sign 18-24-bp primer pairs, using the software Primer 0.5 (S. Lincoln, M. Daly, and E. Lander, Cambridge, MA). The criteria adopted to reduce the amplification of nonspe-cific bands in PCR reactions included a minimum primer annealing temperature (Ta) of 50°C, a maximum differ-ence of 1°C in Ta between the two primers of an SSR lo-cus, and a G + C content ranging from 40 to 50%. The pri-mers were synthesized by Operon Technologies (Alameda, CA).
PCR amplification of alleles at SSR loci
PCR was done in a final volume of 20 µl, containing 15 ng of DNA, 0.3 µM of each primer, 0.25 mM of each dNTP, 1.5 mM MgCl2, 5% DMSO and 1 unit of Taq
Confirmation of alleles at SSR loci
To verify whether the amplified DNA fragments were representative of the expected microsatellite, and not the result of amplification of spurious sequences, the M. grisea isolate PS-3 was analyzed at three SSR loci (MGM-1, MGM-21 and MGM-24). After the PCR reaction, the am-plified DNA products for each SSR primer pair were elec-trophoresed on 3.5% agarose gels. The DNA band of each primer pair was recovered from the gel by cutting it right after the band, inserting an NA-45 nitrocellulose membrane into the cut, and running the gel until the band was bound to the membrane. The bound DNA was extracted from the membrane with 250 µl NET buffer (1.0 mM NaCl, 0.1 mM EDTA and 20 mM Tris-HCl, pH 8.0) in a 1.5-ml tube at 65°C for 1 h, and then precipitated with 625 µl ethanol overnight. The DNA was resuspended in 10 µl water, quan-tified, diluted, and 20 ng was used as template DNA for automated sequencing, as described above. A similar pro-tocol was used to sequence the PCR products of M. grisea isolates MT-20, 6043 and CPAC-01 at the MGM-1 locus. For each sample, a single-strand sequence was generated using only the forward primer.
Genotyping of M. grisea isolates
A total of 158 M. grisea single spore isolates from different areas and hosts were collected and used for ge-notypic analysis using some of the newly developed SSR markers. Twenty-eight isolates from two rice blast-infected areas in southern Brazil were kindly provided by Dr. Alceu S. Ribeiro (EMBRAPA-CPACT, Brazil). These isolates were obtained from lesions in rice plants infected in the field in two counties of the State of Rio Grande do Sul, approximately 200 km apart from each other. The areas of collection were Rosario do Sul County (elevation 125 m, 30° S latitude, 54° W longitude), with isolates identified as “RS” followed by a number representing the order of isolation, and Palmares do Sul (elevation 9 m, 30° S lati-tude, 50° W longitude), with isolates identified as “PS” followed by a number as described above. DNA from 34 M. grisea isolates collected throughout Colombia were kindly provided by Dr. Fernando Correa-Victoria (CIAT, Colombia), and coded as MT or OLY. Ninety-six isolates were also obtained from an irrigated commercial rice field crop in Formoso, State of Tocantins, Central Brazil (eleva-tion 240 m, 11° S latitude, 49° W longitude). These iso-lates represent a sample from an M. grisea epidemic since they were collected from infected plants 10 m apart cov-ering an area of 1 ha. The genetic analysis of this M. grisea population was used to indicate the level of pathogen vari-ability in small areas during an epidemic. One M. grisea isolate from rice collected in China (number 6043, kindly provided by Dr. Barbara Valent, Du Pont, USA) and one iso-late from wheat (CPAC-01, kindly provided by Dr. José Ribamar dos Anjos, EMBRAPA-CPAC) collected in
Cen-tral Brazil were also evaluated. The polymorphism infor-mation content (PIC) of each tested marker was calculated for isolates from Central Brazil, as described by Taramino and Tingey (1996).
RESULTS
Genomic library and SSR development
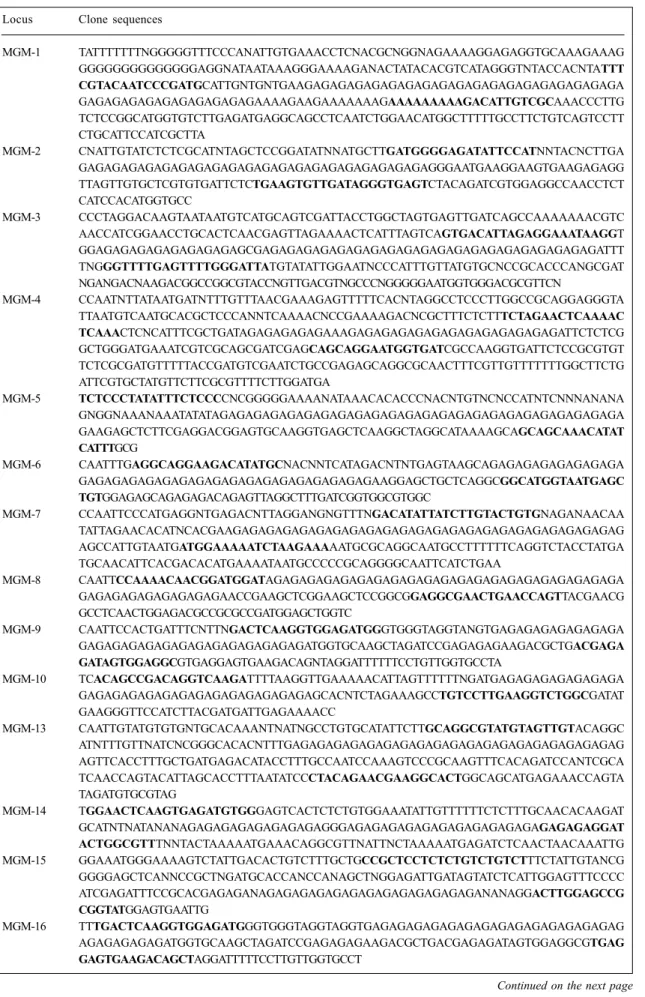
The AG-enriched library contained inserts with an average length of 500 bp, which facilitated the subsequent steps of SSR marker development. Around 40% of the plaques contained clones that hybridized with the poly (dA-dG) probe. A total of 193 clones were tested for satellite sequences by the anchor-PCR approach, and 168 (87%) of these tested positive for SSRs. Among the clones with microsatellites, 152 (90%) had an SSR of adequate size and position within the cloned insert to be sequenced. Sev-enty-two of these clones were sequenced and found to con-tain AG repeats. Of these sequences, 24 had SSR sequences and a flanking region of adequate size for the design of forward and reverse primers. These clones are described in Table I, with the primer sequences in bold. Twenty-one of the clones had simple, straight AG repeats, while three were complex (clones MGM-3, MGM-14, MGM-26) (Table I).
Screening of SSR markers
Table I - Cloned sequences of 24 M. grisea SSR loci. The flanking sequences used to design the primers are boldfaced. Locus Clone sequences
MGM-1 TATTTTTTTNGGGGGTTTCCCANATTGTGAAACCTCNACGCNGGNAGAAAAGGAGAGGTGCAAAGAAAG GGGGGGGGGGGGGGAGGNATAATAAAGGGAAAAGANACTATACACGTCATAGGGTNTACCACNTATTT
CGTACAATCCCGATGCATTGNTGNTGAAGAGAGAGAGAGAGAGAGAGAGAGAGAGAGAGAGAGAGA
GAGAGAGAGAGAGAGAGAGAGAAAAGAAGAAAAAAAGAAAAAAAAAGACATTGTCGCAAACCCTTG TCTCCGGCATGGTGTCTTGAGATGAGGCAGCCTCAATCTGGAACATGGCTTTTTGCCTTCTGTCAGTCCTT CTGCATTCCATCGCTTA
MGM-2 CNATTGTATCTCTCGCATNTAGCTCCGGATATNNATGCTTGATGGGGAGATATTCCATNNTACNCTTGA GAGAGAGAGAGAGAGAGAGAGAGAGAGAGAGAGAGAGAGAGAGGGAATGAAGGAAGTGAAGAGAGG TTAGTTGTGCTCGTGTGATTCTCTGAAGTGTTGATAGGGTGAGTCTACAGATCGTGGAGGCCAACCTCT CATCCACATGGTGCC
MGM-3 CCCTAGGACAAGTAATAATGTCATGCAGTCGATTACCTGGCTAGTGAGTTGATCAGCCAAAAAAACGTC AACCATCGGAACCTGCACTCAACGAGTTAGAAAACTCATTTAGTCAGTGACATTAGAGGAAATAAGGT GGAGAGAGAGAGAGAGAGAGCGAGAGAGAGAGAGAGAGAGAGAGAGAGAGAGAGAGAGAGAGATTT
TNGGGTTTTGAGTTTTGGGATTATGTATATTGGAATNCCCATTTGTTATGTGCNCCGCACCCANGCGAT
NGANGACNAAGACGGCCGGCGTACCNGTTGACGTNGCCCNGGGGGAATGGTGGGACGCGTTCN
MGM-4 CCAATNTTATAATGATNTTTGTTTAACGAAAGAGTTTTTCACNTAGGCCTCCCTTGGCCGCAGGAGGGTA TTAATGTCAATGCACGCTCCCANNTCAAAACNCCGAAAAGACNCGCTTTCTCTTTCTAGAACTCAAAAC
TCAAACTCNCATTTCGCTGATAGAGAGAGAGAAAGAGAGAGAGAGAGAGAGAGAGAGAGATTCTCTCG
GCTGGGATGAAATCGTCGCAGCGATCGAGCAGCAGGAATGGTGATCGCCAAGGTGATTCTCCGCGTGT TCTCGCGATGTTTTTACCGATGTCGAATCTGCCGAGAGCAGGCGCAACTTTCGTTGTTTTTTTGGCTTCTG ATTCGTGCTATGTTCTTCGCGTTTTCTTGGATGA
MGM-5 TCTCCCTATATTTCTCCCCNCGGGGGAAAANATAAACACACCCNACNTGTNCNCCATNTCNNNANANA GNGGNAAANAAATATATAGAGAGAGAGAGAGAGAGAGAGAGAGAGAGAGAGAGAGAGAGAGAGAGA GAAGAGCTCTTCGAGGACGGAGTGCAAGGTGAGCTCAAGGCTAGGCATAAAAGCAGCAGCAAACATAT
CATTTGCG
MGM-6 CAATTTGAGGCAGGAAGACATATGCNACNNTCATAGACNTNTGAGTAAGCAGAGAGAGAGAGAGAGA GAGAGAGAGAGAGAGAGAGAGAGAGAGAGAGAGAGAAGGAGCTGCTCAGGCGGCATGGTAATGAGC TGTGGAGAGCAGAGAGACAGAGTTAGGCTTTGATCGGTGGCGTGGC
MGM-7 CCAATTCCCATGAGGNTGAGACNTTAGGANGNGTTTNGACATATTATCTTGTACTGTGNAGANAACAA TATTAGAACACATNCACGAAGAGAGAGAGAGAGAGAGAGAGAGAGAGAGAGAGAGAGAGAGAGAGAG AGCCATTGTAATGATGGAAAAATCTAAGAAAAATGCGCAGGCAATGCCTTTTTTCAGGTCTACCTATGA TGCAACATTCACGACACATGAAAATAATGCCCCCGCAGGGGCAATTCATCTGAA
MGM-8 CAATTCCAAAACAACGGATGGATAGAGAGAGAGAGAGAGAGAGAGAGAGAGAGAGAGAGAGAGAGA GAGAGAGAGAGAGAGAGAACCGAAGCTCGGAAGCTCCGGCGGAGGCGAACTGAACCAGTTACGAACG GCCTCAACTGGAGACGCCGCGCCGATGGAGCTGGTC
MGM-9 CAATTCCACTGATTTCNTTNGACTCAAGGTGGAGATGGGTGGGTAGGTANGTGAGAGAGAGAGAGAGA GAGAGAGAGAGAGAGAGAGAGAGAGAGATGGTGCAAGCTAGATCCGAGAGAGAAGACGCTGACGAGA
GATAGTGGAGGCGTGAGGAGTGAAGACAGNTAGGATTTTTTCCTGTTGGTGCCTA
MGM-10 TCACAGCCGACAGGTCAAGATTTTAAGGTTGAAAAACATTAGTTTTTTNGATGAGAGAGAGAGAGAGA GAGAGAGAGAGAGAGAGAGAGAGAGAGAGCACNTCTAGAAAGCCTGTCCTTGAAGGTCTGGCGATAT GAAGGGTTCCATCTTACGATGATTGAGAAAACC
MGM-13 CAATTGTATGTGTGNTGCACAAANTNATNGCCTGTGCATATTCTTGCAGGCGTATGTAGTTGTACAGGC ATNTTTGTTNATCNCGGGCACACNTTTGAGAGAGAGAGAGAGAGAGAGAGAGAGAGAGAGAGAGAGAG AGTTCACCTTTGCTGATGAGACATACCTTTGCCAATCCAAAGTCCCGCAAGTTTCACAGATCCANTCGCA TCAACCAGTACATTAGCACCTTTAATATCCCTACAGAACGAAGGCACTGGCAGCATGAGAAACCAGTA TAGATGTGCGTAG
MGM-14 TGGAACTCAAGTGAGATGTGGGAGTCACTCTCTGTGGAAATATTGTTTTTTCTCTTTGCAACACAAGAT GCATNTNATANANAGAGAGAGAGAGAGAGAGGGAGAGAGAGAGAGAGAGAGAGAGAGAGAGAGGAT
ACTGGCGTTTNNTACTAAAAATGAAACAGGCGTTNATTNCTAAAAATGAGATCTCAACTAACAAATTG
MGM-15 GGAAATGGGAAAAGTCTATTGACACTGTCTTTGCTGCCGCTCCTCTCTGTCTGTCTTTCTATTGTANCG GGGGAGCTCANNCCGCTNGATGCACCANCCANAGCTNGGAGATTGATAGTATCTCATTGGAGTTTCCCC ATCGAGATTTCCGCACGAGAGANAGAGAGAGAGAGAGAGAGAGAGAGAGANANAGGACTTGGAGCCG
CGGTATGGAGTGAATTG
MGM-16 TTTGACTCAAGGTGGAGATGGGTGGGTAGGTAGGTGAGAGAGAGAGAGAGAGAGAGAGAGAGAGAG AGAGAGAGAGATGGTGCAAGCTAGATCCGAGAGAGAAGACGCTGACGAGAGATAGTGGAGGCGTGAG
GAGTGAAGACAGCTAGGATTTTTCCTTGTTGGTGCCT
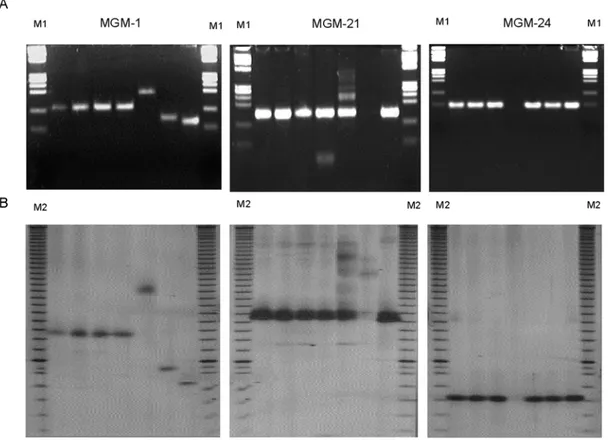
6043 (China) and CPAC-01 (from wheat) isolates based on their genotypes at the MGM-1 locus (Figure 1). Iso-lates MT-20, 6043 and CPAC-01 had different genotypes which were also easily differentiated on agarose and poly-acrylamide gels. The seven M. grisea isolates could not be distinguished at the other SSR loci (21 and MGM-24), with the exception of isolate 6043 (China) that seemed to have a null allele at locus MGM-21, and isolate PS-41 (southern Brazil) with a null allele at locus MGM-24. The allele sizes at these three loci were 145 bp for the MGM-21 locus, 70 bp for the MGM-24 locus and 85-180 bp for the MGM-1 locus. The bands observed at each locus
(MGM-1, MGM-21 and MGM-24) were confirmed to be micro-satellite alleles by sequence analysis of recovered frag-ments amplified at these three SSR loci using the PS-3 isolate (data not shown). All three sequences from recov-ered PCR products had an AG-SSR region and, as expected, were identical in sequence to the original clones derived from the SSR library. The allele sizes observed for the CPAC-01 (wheat) and PS-3 (southern Brazil) isolates were 84 and 126 bp, respectively (Figure 1). Sequence analysis of both alleles revealed that this difference in allele size was caused mainly by variation in the number of AG repeats. The DNA-flanking sequence of this micro-Table I - Continued
Locus Clone sequences
MGM-17 ACATTATTTTTTCACAGCCGACAGGTCAAGACTTTTAAGGTTGAAAACATTAGTTTTTTNGATGAGAGA GAGAGAGAGAGAGAGAGAGAGAGAGAGAGAGAGAGAGACACNTCTGAGAAAGCCTGTCCTTGAAGGT
CTGGCGATATGAAGGGTTCCATCTTACGATGATTGAGAAACCACTAAAAAGTAGGGGTGATTGGTTCCA
AGTTCGGTCCTTCCATCTTGGACCGGAACCAGACCGGGAGCACCAGTTCCC
MGM-18 GANGCCCATGAAGTGTGACCGTCNACCAANGGGGGGAGGANTGGCCGGCCCACTTCTTCCAAGCACAAT CCAANCCCAAGCCCATCTTGCATGAACTTGGCCAAGTGGCAAAAAGANGATTACACGCATTGAGCATT GAGGGANGCAAATAATCATTGCCAATGATGGAGTTTTGGTGAANTNNNANANAGAGAGAGAGAGAGAG AGAGAGAGAGAGAGAGAGAGAGANANAGAGAGAGTGGCCGGTTGAATTG
MGM-19 TGAAGGGCATGGTCTTGAGTCCACCCTCTTTGNTCTNGACACGTTTGGNTTCATTCNCTTTGTNTCTTTG TNTGAAGCAATATCCATGGTTCTCTCTGTGNTATATNCAGGCCTCAGGGCCNGAGATTAGATATTTTTGG CGGAGAGAGAGAGAGAGAGAGAGAGAGAGAGAGAGAGAGAGAGAGAGAGAGAGAACAAGAGAGATT GTCAGGAAGCTTTTGCCTTATATAGGGATGAAAACAAGNGACGGTTTCATTTCCAGTCCC
MGM-20 CAATTCGATGCCTTGCGTTGCTTTATTTGGCAAGTNATATGAGTTTTNAGTGGACGGTTANAGAAAGGA CNAGGTGTTTAAGACAAGAAAGTGATTANTATGGTTCNGATCCGAGAGAGAGAGAGAGAGAGAGAGAG CGTCNNTAATGCTTTGTNNGATAGCANACAGAGGGTTGCTTTTTGGGTNCTTGGGGAATAAAATGCTG TCCCTCTACNANGATTGGCGTGAGAGANANAGANAGAGAGAGAGAGAGCGTCTCTTNCTCTCTCTTTAG ATCAAACCNAAATTG
MGM-21 GTGATGCAGGTGAGCAAACAGCAAGACAAGACAAATACGGATAGAGAGATAGAGAGAGAGAGAGAG AGAGAGAGAGAGAGAGAGAGAGAGAGAATGGCAGGCAGTAATGTGCTTTCCCACAGAAAACAAAAAA GCTACACCGGCCTGCACGAGATATGCAAGCTGAAAGCGGTGGAGAAAGCCCGTGGCTTAGACAAAAC CATACGGATATTATTGTCCGCATCAACGGGGAATCATCGCATCACCAAAGAAACAAGGTGAGAGGCGGA AGGAAAGTAACGTCGAGAGAGGCACCCTTTCTTGGCTTAGTCGTGTTTATGTTGGCTTGCAGC
MGM-22 TATGGGGAAAAAGATTGTGGGCAGGGATGGGACACANNTATGTAGTTTGCANCCGAGAGGTCGGATNC AATGAGAGAGAGAGAGAGAGAGAGAGAGAGAGAGAGAGAGAGAGAGAGAGAGAGGCCTAGGTAGGA
GATGCCAACCTCATGCTTGCTGTATTCATTTAAGACTGGCACTAAC
MGM-23 GAATTCAGNTAGATACATGGTTCGAGAAAAGANACCCCGATTGCTCATGTCNACNCATCCACNTGGCT CTGACANAAACATTCACATCACAGAGAGAGAGAGAGAGAGAGAGAGAGAGAGAGAGAGAGAGGGAGA GAGAAGTCAATCTGATCTTTAAATAAAAAGTTTCTAGCAGGAGACATAAAATCATGCTGAAAAATGATC TCGAAGAAGGTAAGCTTGTTCGCATACAGCTACAAACACAGTTACCTCTCATCTCCTCCTGATATTACT TTCACTAATATTATTCATGG
MGM-24 CAATNGTGTGATCNAGAAGNGACACATGANGAAGGGCNTGGTCTTGAGTCCACCCTCTTTGGAGAGA GAGAGAGAGAGAGAGAGAGAGAGAGAACAAGGATGAAAACAAGGGACGGTTTCATTTCCAGTCC MGM-25 CGATGCCTTGCGTTGCTTTATTTGGCAAGTAATATGAGTTTTAAGTGGACGGTTANAGAAAGGACGAG GTGTNTAAGACAAGAAAGTGATTAGTATGGTACAGATCTGAGAGAGAGAGAGAGAGAGAGAGAGCGTC NATAATGCTTTGTNNGATAGCAGACAGAGGGTTGCTTTTTGGGTNCTTGGGGAATAAAATGCTGTCCCT CTACNANGATTGGCGTGAGAGANACAGAGAGAGAGAGAGAGAGCGTCTTTTTCTCTCTCTTTANATCAA ACCAAAATTG
Figure 1 - Electrophoretic profiles of MGM-1, MGM-21 and MGM-24 SSR markers. (A) 3.5% agarose gels, (B) 4% polyacryla-mide gels. The M. grisea isolates tested were, from left to right: RS-10 (Brazil), RS-13 (Brazil), PS-3 (Brazil), PS-41 (Brazil), MT-20 (Colombia), 6043 (China) and CPAC-01 (Brazil, from wheat). M1 = Phi-X/HaeIII ladder; M2 = 10-bp ladder (Gibco).
satellite locus was almost completely conserved in iso-lates from wheat and rice (Table II). Sequencing of the MGM-1 allele of isolate MT-20 (Colombia) revealed more than 60 AG repeats.
Genotyping of M. grisea isolates
Genetic variation among 158 isolates of M. grisea from different regions was detected by analyzing their geno-types at the MGM-1, MGM-21 and MGM-24 loci. Twenty-eight southern Brazilian isolates, 96 central Brazilian iso-lates and a sample of 34 Colombian M. grisea isoiso-lates were genotyped at these loci. None of the 28 southern Brazilian isolates showed polymorphism at the three loci after elec-trophoresis on 3.5% agarose gels (Figure 2). The situation for the Colombian and central Brazilian isolates was quite different. Analysis of the MGM-1 locus for a sample of Colombian isolates indicated high variability. At least nine alleles were identified on 3.5% agarose gels (Figure 2), with estimated sizes ranging from 118 bp to approximately 400 bp. The Colombian isolate MT-2 showed more than one amplified band, which is not expected to occur in hap-loid mycelial DNA. Several of the 96 M. grisea isolates sampled from a commercial rice field infected by the blast fungus in Central Brazil were separated based on their
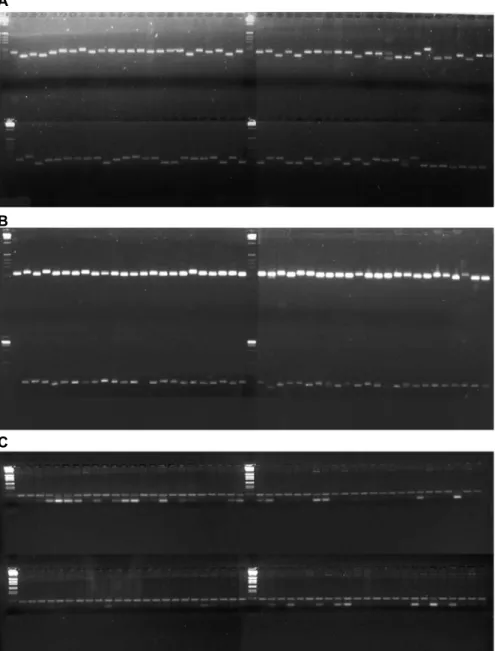
geno-types at the MGM-1 and MGM-21 loci (Figure 3). At least seven alleles were identified at these loci on 3.5% agarose gels, the most frequent of them being observed in almost half of the isolates. PIC values estimated from allelic varia-tion observed in the 96 isolates collected from a 1-ha area in Central Brazil were 0.54 for MGM-1 loci and 0.44 for MGM-21. The PIC values would be expected to be higher on polyacrylamide gels. Some isolates (Figure 3) showed two alleles, especially at the MGM-24 locus.
Table II - Sequences of PCR-amplified alleles showing high variation in the AG repeats at the SSR locus MGM-1 among single spore isolates
of M. grisea. (A) Isolate PS-3, used to develop the SSR library, showing 30 copies of the AG repeat, and (B) isolate CPAC-01,
from wheat, showing only four perfect AG repeats.
A
TTTCGTACAATCCCGATGCATTGCTGCTGAAGAGAGAGAGAGA
GAGAGAGAGAGAGAGAGAGAGAGAGAGAGAGAGAGAGAGAG AGAGAGAAAAGAAGAAAAAAAGAAAAAAAAAGACA TTGTCGC
B
TTTCGTACAATCCCGATGCATTGCTGCTGAAGAGAGAGAGAGA
DISCUSSION
We have described the construction of a dinucleotide microsatellite-rich DNA library of M. grisea, the identifi-cation, selection and sequencing of microsatellite DNA clones, the characterization of three of the newly devel-oped M. grisea microsatellite markers and the use of these marker loci to genotype blast isolates from different areas and hosts. Dinucleotide SSR markers have been detected abundantly in mammals and plants. While in mammals and plants the most frequent repetitive motif is AC/TG (Beckmann and Weber, 1992) and AT/TA (Morgante and Olivieri, 1993), respectively, there is limited information about the type of motif and the frequency of SSR loci in microorganisms. Field and Wills (1996) described the re-sults of a search for microsatellite sequences in microor-ganisms by examining the cloned sequences deposited at GenBank. Forty-six out of 375 sequences found were from fungi and all of them were trinucleotides. Since no infor-mation about SSR in M. grisea was available at the begin-ning of this work, a dinucleotide-enriched library was con-structed by assuming that dinucleotides are expected to occur more frequently in the genome than tri- or tetra-nucleotides, thus increasing the chance of cloning these regions. Indeed, the data collected to date indicate that di-nucleotide repetitive sequences can efficiently be isolated from the M. grisea genome.
M. grisea isolates from Brazil, China and Colom-bia and one isolate from wheat were genotyped at three SSR marker loci. Several amplified alleles of different
lengths were detected in agarose and polyacrylamide gels, as were null alleles, observed for the MGM-21 locus in the Chinese isolate, and the MGM-24 locus in the PS-41 isolate from Brazil. These findings indicate that the SSR flanking regions are conserved among isolates from dif-ferent geographic regions and countries, and that they are also conserved in an M. grisea isolate from wheat (CPAC-01). The possibility of differentiating isolates based on differences in the number of dinucleotide repeats and the presence or absence of a site for primer annealing is use-ful for discriminating among isolates and provides a pow-erful tool for the genetic analysis of M. grisea popula-tions. Using a small set of selected SSR markers, it may be possible to differentiate large numbers of pathogen isolates.
The number of AG repeats in the M. grisea genome varied significantly between some isolates. The allele sizes observed in isolates CPAC-01 (collected in wheat) and PS-3 (collected in southern Brazil) were 84 and 126 bp, re-spectively (Figure 1). Sequence analysis of the two frag-ments indicated that the large difference in size resulted from a 5-fold difference in the number of AG repeats be-tween the two isolates (Table II). Likewise, sequencing of the MGM-1 allele of isolate MT-20 (collected in Colom-bia) revealed more than 60 AG repeats at this locus, which represents one of the highest levels of simple sequence repeats known among eukaryotic organisms.
Brazilian, Colombian and Chinese M. grisea isolates were genotyped at the MGM-1, MGM-21 and MGM-24 loci. The 28 southern Brazilian isolates were
phic at these loci, with just one SSR allele per locus on agarose gels, although polymorphism was seen in one of the isolates (RS-48) on 4% denaturing polyacrylamide gels (data not shown). This finding agrees with the data reported by Ribeiro (1980), who tested M. grisea isolates from the same two locations as our samples (Rosario do Sul and Palmares do Sul) in southern Brazil, using the rice interna-tional differential series, and found them to be genetically uniform. In contrast, analysis of the MGM-1 locus revealed at least seven alleles in a sample of 96 isolates from a small (1 ha) blast-infected area of Central Brazil and a minimum of nine alleles in a sample of 34 isolates collected in Co-lombia.
The difference in the number of alleles detected in southern Brazil relative to the central Brazilian and Co-lombian M. grisea isolates was significant and may be
related to the sampling strategy used to recover M. grisea isolates in these areas. The southern Brazilian isolates were sampled in a typical agricultural environment where the rice varieties have a very narrow genetic base (Rangel et al., 1996). The use of the same or very similar rice varieties in these areas over the years favors the predomi-nance of a specific pathotype of the fungus. Also, the tem-perate climate of southern Brazil is not as favorable to the development of the disease as other areas, such as the Formoso River valley of Central Brazil, where high tem-peratures and humidity most of the year create a suitable environment for the pathogen. Blast symptoms can be observed on rice and weeds in the field throughout the year in the Formoso River valley, and this creates a con-tinuous source of M. grisea inoculum in the region. The M. grisea isolates from Central Brazil were collected
Figure 3 - Allelic variation in 96 single spore iso-lates of M. grisea sampled from a small (1 ha) epidemic area of the Formoso River valley, Brazil. The SSR marker loci were analyzed on 3.5% agar-ose gels stained with ethidium bromide. (A) Lo-cus MGM-1; (B) locus MGM-21 and (C) locus MGM-24. Lanes 1 and 26: 1-kb ladder (Gibco).
A
B
from a blast epidemic on rice cultivar Metica-1. A large number of isolates were collected from infected plants only 10 m apart, over a total area of 1 ha. The level of variability observed was very striking, indicating that the genetic structure of M. grisea populations in this area is far more complex than anticipated. The isolates from Colombia, representing a sample of M. grisea found in several parts of that country, were collected from various rice cultivars (Correa-Victoria and Zeigler, 1993). In this case, the genotypic variability was expected to be high because of the different selection pressures imposed by host genotype variability and the diverse environments where the pathogen was sampled. The level of variability of M. grisea isolates from Colombia was similar to that found in the population sampled in a small area of Cen-tral Brazil. The Colombian isolate MT-2 showed more than one amplified band, which would not be expected to oc-cur in haploid mycelial DNA. This could reflect nonspe-cific primer annealing during PCR, the contamination of isolates or the presence of duplicated loci in the M. grisea genome. Current information on loci duplication in the M. grisea genome (Valent and Chumley, 1994) favors the last hypothesis. Double-banding patterns were also ob-served in some isolates from Central Brazil genotyped at the MGM-24 locus (Figure 3).
The estimates of PIC for the Central Brazilian M. grisea population were 0.54 for MGM-1 and 0.44 for MGM-21. PIC values will probably rise when polyacry-lamide gels are used and as more isolates are studied. The combined use of the MGM-1 and MGM-21 markers in this population allowed the identification of nine differ-ent genotypes. The MGM-1 and MGM-21 markers dis-criminated five and three genotypes, respectively, when used individually. The development of additional SSR markers and their analysis by PCR using fluorescent dye technology or silver-stained gels could rapidly provide genetic data for a number of studies, including the esti-mation of genetic parameters for pathogen populations. One clear advantage is the possibility of constructing da-tabases of allele frequencies at selected SSR loci. The development of allelic ladders for informative SSR loci will facilitate accurate allele identification within and between populations of the pathogen, thereby facilitating the comparison of data among laboratories.
The application of SSR markers to genetic studies of M. grisea is very promising. The practical advantages of a robust PCR-based approach in contrast to the labor-intensive and costly multilocus hybridization probe tech-niques are easily appreciated, especially for studies in-volving large samples such as those required for popula-tion diversity analysis and for monitoring genotype and pathotype distribution in epidemic areas. Data gathered on the genotype of individual isolates of a fungal popula-tion during an epidemic and on the dynamics of genotype change over time may be useful for developing and breed-ing new resistant rice cultivars.
RESUMO
Uma biblioteca genômica enriquecida para seqüências microssatélites foi construída para Magnaporthe grisea (ana-morfo Pyricularia grisea), o agente causal da doença brusone do arroz. Setenta e dois clones de DNA contendo unidades repetitivas microssatélites foram isolados e seqüenciados para o desenvolvimento de uma série de novos marcadores moleculares baseados em reação de PCR, para serem utilizados na análise genética do fungo. Dos 72 clones, 24 foram selecionados para o desenho dos pares de primers para amplificação dos alelos microssatélites pela técnica de PCR. Culturas monospóricas de
M. grisea isoladas de plantas de arroz e trigo no Brasil, Colômbia e China foram genotipadas utilizando-se 3 locos microssatélites. Isolados do fungo provenientes do Estado do Rio Grande do Sul foram predominantemente monomórficos nos locos microssatélites testados, indicando um baixo nível de variabilidade genética destas amostras. Contudo, 7 alelos puderam ser detec-tados pelo marcador MGM-1 em isolados provenientes do Estado do Tocantins e no mínimo 9 alelos puderam ser detectados com o mesmo marcador em uma amostra de isolados da Colômbia. A análise com marcadores microssatélites é uma meto-dologia simples e direta para se estimar a diversidade genética dos isolados de M. grisea e uma poderosa ferramenta para o estudo da genética de M. grisea.
REFERENCES
Bassam, B.J., Caetano-Anolles, G. and Gresshoff, P.M. (1991). Fast and sensitive silver staining of DNA in polyacrylamide gels. Anal. Biochem. 196:80-83.
Beckmann, J.S. and Weber, J.L. (1992). Survey of human and rat microsatellites. Genomics12: 627-631.
Brondani, R.P.V., Brondani, C., Tarchini, R. and Grattapaglia, D. (1998). Development, characterization and mapping in Eucalyptus grandis
and E. urophylla. Theor. Appl. Genet. 97: 816-827.
Brown, S.M., Hopkins, M.S., Mitchell, S.E., Senior, M.L., Wang, T.Y., Duncan, R.R., Gonzales-Candelas, F. and Kresovich, S. (1996). Mul-tiple methods for the identification of polymorphic simple sequence repeats (SSRs) in sorghum [Sorghum bicolor (L.) Moench]. Theor. Appl. Genet. 93: 190-198.
Correa-Victoria, F.J. and Zeigler, R.S. (1993). Pathogenic variability in
Pyricularia grisea at a rice blast “hot spot” breeding site in Eastern Colombia. Plant Dis. 77: 1029-1035.
Dobinson, K.F., Harris, R.E. and Hamer, J.E. (1993). Grasshopper, a long terminal repeat (LTR) retroelement in the phytopathogenic fungus
Magnaporthe grisea. Mol. Plant-Microbe Interact. 6:114-126.
Farman, M.L., Taura, S. and Leong, S.A. (1996a). Magnaporthe grisea
DNA fingerprinting probe MGR586 contains the 3' end of an inverted repeat transposon. Mol. Gen. Genet. 251: 675-681.
Farman, M.L., Tosa, Y., Nitta, N. and Leong, S.A. (1996b). MAGGY, a retrotransposon in the genome of the rice blast fungus Magnaporthe grisea. Mol. Gen. Genet.251: 665-674.
Field, D. and Wills, C. (1996). Long, polymorphic microsatellites in simple organisms. Proc. R. Soc. Lond. 263: 209-215.
Hamer, J.E. (1991). Molecular probes for rice blast disease. Science 252: 632-633.
Kachroo, P., Leong, S.A. and Chattoo, B. (1994). Pot2, an inverted repeat transposon from the rice blast fungus Magnaporthe grisea. Mol. Gen. Genet. 245: 339-348.
Morgante, M. and Olivieri, A.M. (1993). PCR-amplified microsatellite as markers in plant genetics. Plant J. 3: 175-182.
Rafalski, J.A., Morgante, M., Powell, W., Vogel, J.M. and Tingey, S.V.
Rangel, P.H.N., Guimarães, E.P. and Neves, P.C.F. (1996). Base genética das cultivares de arroz (Oryza sativa L.) irrigado do Brasil. Pesqui. Agropecu. Bras. 31: 349-357.
Ribeiro, A.S. (1980). Prevalência de raças de Pyricularia oryzae no Rio Grande do Sul. Pesqui. Agropecu. Bras. 15: 175-182.
Taramino, G. and Tingey, S.V. (1996). Simple sequence repeats for germplasm analysis and mapping in maize. Genome 39: 277-287.
Tuite, J. (1969). Plant Pathological Methods - Fungi and Bacteria. Bur-gess Publishing, Minneapolis.
Valent, B. and Chumley, F.G. (1994). Avirulence genes and mechanisms of
genetic instability in the rice blast fungus. In: Rice Blast Disease
(Zeigler, R.S., Leong, S.A. and Teng, P.S., eds.). CAB International, Wallingford, pp. 111-134.
Weber, J.L. and May, P.E. (1989). Abundant class of human DNA polymor-phisms which can be typed using the polymerase chain reaction. Am. J. Hum. Genet. 44: 388-396.
Weising, K., Nybom, H., Wolff, K. and Meyer, W. (1995). DNA Finger-printing in Plants and Fungi. CRC Press, Boca Raton.