www.jped.com.br
ORIGINAL
ARTICLE
Poor
diet
quality
among
Brazilian
adolescents
with
HIV/AIDS
夽
Luana
Fiengo
Tanaka
a,∗,
Maria
do
Rosário
Dias
de
Oliveira
Latorre
a,
Aline
Medeiros
da
Silva
a,
Thais
Claudia
Roma
de
Oliveira
Konstantyner
a,
Elissa
Caroline
Mendes
a,
Heloísa
Helena
Sousa
Marques
a,baFaculdadedeSaúdePúblicadaUniversidadedeSãoPaulo(USP),SãoPaulo,SP,Brazil
bInstitutodaCrianc¸a,HospitaldasClínicas,FaculdadedeMedicina,UniversidadedeSãoPaulo(USP),SãoPaulo,SP,Brazil
Received21January2014;accepted11June2014 Availableonline30October2014
KEYWORDS
Adolescent; Foodconsumption; Healthyeatingindex; HIV/AIDS
Abstract
Objective: ThisstudyaimedtoassessdietqualityamongadolescentswithHIV/AIDS.
Method: Across-sectionalstudywasconductedinvolvingpatientswithHIV/AIDStreatedina
referralhospitalinSaoPaulo,Brazil.Eighty-eightadolescents(10-19yearsofage)participated
inthestudy.Informationondiseasehistoryanduseofmedicationwereobtainedfrommedical
records.Theparticipantsrespondedtotwo24-hourdietrecalls.Dietqualitywasassessedby
meansoftheHealthyEatingIndex-2005(HEI-2005)adaptedtotheBrazilianpopulation.
Pear-son’scorrelationcoefficientswerecalculated.MeanHEI-2005scoreswerecomparedaccording
totheindependentvariablesusingeithertheStudent’st-testortheMann-Whitneytest.
Results: ThemeanHEI-2005scorewas51.90(SE=0.90).Thecomponentswiththelowestmeans
werewholegrainsandsodium.Componentswithhighestmeansweretotalgrainsandoils.No
correlationswerefoundbetweentheindependentvariablesandHEIscore.Adolescentslivingin
fosterhomeshadhighermeansfortotalfruitandlowermeansformeatandbeansincomparison
toadolescentslivingwiththeirfamilies.Girlshadhighermeansformilkandlowermeansfor
caloriesfromsolidfats,alcoholicbeverages,andaddedsugarsincomparisontoboys.
Conclusions: AdolescentswithHIV/AIDSexhibitedasimilareatingpatterntothatofadolescents
inthegeneralpopulation:highconsumptionofaddedsugar,saturatedfat,andsodium,and
insufficientingestionofwholegrainsandfruits.Specialattentionshouldbepaidtothediet
ofadolescentswithHIV/AIDS,whoareatgreaterriskofdevelopingcardiovascularandother
chronicdiseases.
©2014SociedadeBrasileiradePediatria.PublishedbyElsevierEditoraLtda.Allrightsreserved.
夽
Pleasecitethisarticleas:TanakaLF,LatorreMR,SilvaAM,KonstantynerTC,MendesEC,MarquesHH.PoordietqualityamongBrazilian adolescentswithHIV/AIDS.JPediatr(RioJ).2015;91:152---9.
∗Correspondingauthor.
E-mail:[email protected](L.F.Tanaka). http://dx.doi.org/10.1016/j.jped.2014.06.007
PALAVRAS-CHAVE
Adolescente; Consumoalimentar; Índicedequalidade dadieta;
HIV/AIDS
BaixaqualidadededietaentreadolescentesbrasileiroscomHIV/AIDS
Resumo
Objetivo: AvaliaraqualidadedadietadeadolescentescomHIV/Aids.
Método: EstudotransversalenvolvendopacientescomHIV/Aidsatendidosemumhospitalde
referênciaem SãoPaulo. Participaramdoestudo88 adolescentes(10-19anos).Informac¸ões
sobrehistóriaclínicaeusodemedicamentosforamobtidasdosprontuáriosmédicos.Os
par-ticipantesresponderamadoisrecordatóriosde24horas.Aqualidadedadietafoiavaliadapelo
índicedequalidadedadietarevisado(IQD-R)adaptadoparaapopulac¸ãobrasileira.Coeficientes
decorrelac¸ãodePearsonforamcalculados.AsmédiasdoescoredoIQD-Rforamcomparadas
deacordocomasvariáveisindependentes,usandooteste-tdeStudentoutesteMann-Whitney.
Resultados: AmédiadoIQD-Rfoi51,90(EP=0,90).Oscomponentesdemenoresmédiasforam:
cereaisintegrais e sódio.Os componentesde maioresmédias foramcereaistotais eóleos.
Nãoforamencontradascorrelac¸õesentreasvariáveisindependenteseoIQD-R.Adolescentes
vivendoemcasasdeapoiotiverammédiasmaioresparafrutastotaisemenoresparacarnese
feijãoemcomparac¸ãoaosadolescentesvivendocomsuasfamílias.Asmeninasapresentaram
médiasmaisaltasparaleiteemenoresmédiasparacaloriasprovenientesdegordurassólidas,
bebidasalcoólicaseac¸úcaresadicionados,emcomparac¸ãoaosmeninos.
Conclusões: OsadolescentescomHIV/Aidsapresentarampadrãoalimentarsemelhanteàquele
dapopulac¸ãogeral:altoconsumodeac¸úcar,gordurasaturadaesódioeingestãoinsuficiente
de cereaisintegrais efrutas. Atenc¸ão especial deveser dada àdieta de adolescentescom
HIV/Aids, poiselesestãosob maiorriscodedesenvolver doenc¸ascardiovascularese outras
doenc¸ascrônicas.
©2014SociedadeBrasileiradePediatria.PublicadoporElsevierEditoraLtda.Todososdireitos
reservados.
Introduction
The introduction of the highly active antiretroviral ther-apy(HAART)inthetreatmentofhumanimmunodeficiency virus/acquiredimmunodeficiencysyndrome(HIV/AIDS)has changedthecourse ofthedisease,dramaticallyimproving survival.However,sinceHAARTintroduction,long-termside effects,someofthemcloselyrelatedtonutrition,suchas lipidprofileabnormalities,havealsobeendescribed.1
Studiesinvolvingchildrenandadolescentsreport impor-tant prevalencerates of metabolic disturbances.Dos Reis et al. found a high prevalence rate of lipid abnormali-ties amongBrazilian children and adolescents: 81.4% had low HDL-cholesterol and 35.5% had increased triglyceride levels.2
Diet also plays an important role in the immune sys-tem of HIV/AIDS patients, because sufficient amounts of macro- and micronutrients are essential for its normal functioning.3
Despiteofitsimportance,onlyafewstudieshavebeen conducted to assess the diet of children and adolescents with HIV/AIDS. The few existing studies reported inade-quatediets. Astudy conductedin the USA evaluated the dietofchildrenwithHIVbetween1995and2004andfound an excessiveintake ofenergy, protein,and sugar,aswell asinsufficientfiberintake.4Likewise,Werneretal.5found
excessive energy intakein the diets of Brazilian children withHIV/AIDSaged2 to16 years.Hence, theassessment of diet quality is an important aspect in monitoring and evaluating both treatment and clinical conditions in this population.
Theaimofthepresentstudywastoassessthediet qual-ityofadolescentswithHIV/AIDSanddetermineassociated factors.
Methods
Across-sectionalstudynestedinacohortstudyofpatients withHIV/AIDSwascarriedout at theInstituto daCrianc¸a (ICr), which is a pediatric referral hospital in Sao Paulo, Brazil.All124patientsaged10to19yearsoldinfollow-upat thisinstitutewereconsideredeligible.Threepatientswere excludedduetoillnessesthataffectfoodintake.All eligi-blepatientswithmedicalappointmentsscheduledbetween April andSeptember of 2010 were invited by their physi-cians to participatein the study.However, eighthad not attended any scheduled appointment in the previous six months,tenwerenotreachedbytelephone,andtenmissed thescheduled appointment. Thus, 90 adolescents(74.4%) wereinitiallyevaluated. Oneadolescentwasexcluded for havinganenergyintakebelowthefirstpercentileandone wasexcluded for havingan energyintake abovethe99th percentile.6 Thus,thefinalstudypopulation wasmadeup
of88adolescents(71.0%).
Information ondiseasehistory andmedication use was obtained from medical records. Diseases were defined basedonthe criteriaof theBrazilian Ministry of Health.7
Parents/legal guardians signed an informed consent and answeredaquestionnaireonsocioeconomicaspects.
and body mass index (BMI)-for-age were calculated using Anthroplussoftware, version 1.0.3 (WHO AnthroPlus soft-ware,USA).Theparticipantswereclassifiedwithregardto nutritionalstatus based onthe cutoffvaluesproposed by theWHO.8 Two 24-hourdiet recallswereadministeredby
atraineddietitian. Theparticipants wereasked toreport allfood andbeveragesand respectiveamountsconsumed inthe previous day. The firstrecall wasobtained through a face-to-face interview. To facilitate the report of the amountconsumed,aphotobookwithpicturesofdifferent portionsizes wasshown.9 The second 24-hour foodrecall
wasobtainedthroughtelephonecontactonnon-consecutive daysafterapproximatelyoneweek,inordertocorrectfor personalvariation.10Thetelephoneinterviewwasemployed
tominimizepossiblelosses.
Dietary data were entered into NutWinsoftware, ver-sion1.5.2003(DepartmentofComputerScienceinHealth, Brazil).TheBrazilianFoodCompositionTable11 wasusedto
estimatenutrientintake.Foodswereclassifiedintogroups basedontheGuidelinesfortheBrazilianPopulation.12 For
thequantificationoftheintakeofeachfoodgroup,recipes wereanalyzedby ingredient,andeach wasentered sepa-rately.
Informationontransfattyacidsandaddedsugarcontent were obtained from the USDA food composition table,13
sincethis informationis notavailable inBrazil.The foods fromtheUSDAtablemostsimilartothoseoftheBrazilian tableintermsofmacronutrient compositionwerechosen. TheMultipleSourceMethod onlineplatform14 wasusedto
estimatethehabitualingestionofnutrientsandfoodgroups, usingregressionmodelsbasedontheinformationprovided bythetwo24hour-foodrecalls.
ThedatawerethenanalyzedusingtheHEI-2005adapted totheBrazilian population. The adapted version contains thesame12items,butthecutoffvaluesdifferfromthoseof theAmericanversion,andcanbefoundelsewhere.15Forthe
componentstotalfruit;wholefruit;totalvegetables;dark green vegetables, orange vegetables, and legumes; total grains;wholegrains;milk;meatandbeans;andoils, min-imumscores representthe absenceof suchfoodgroup in one’sdiet,whereas,maximumscoresindicatethat recom-mendationsweremet.Asforsaturatedfat,sodium,calories fromsolidfats,alcoholicbeverages,andaddedsugars,the minimum scores are assigned to those who have intakes higherthantherecommendation,sincetheirconsumption inexcessisrelatedtohealthproblems.Theoppositeistrue forthemaximumscores.15
Thefinalscore(sumofallitems)rangedfromzeroto100 points,withhigherscoresdenotingbetterdietquality.Inthe present study,theHEI-2005 wasanalyzed asacontinuous variable.Percentagesofminimumandmaximalscoreswere alsocalculated.
Theanalyseswerestratifiedbysexandplaceofresidence (livinginfosterhomeversuslivingwithfamily).
For the characterization of the sample, descriptive analysis involved the determination of central tendency and dispersion, as well as absolute and relative fre-quencies. The Kolmogorov-Smirnov test was employed to determine the adherenceof the quantitative variables to normaldistribution.HEI-2005wasthedependentvariable. Socio-demographic,clinical andanthropometric data con-stituted the independent variables. Pearson’s correlation
coefficientswere calculatedfor continuousvariables.The Student’s t-test and the Mann-Whitney test were usedto comparemeanHEI-2005scoresbetweengroups.All statisti-calanalyseswerecarriedoutusingSPSSsoftware(SPSSInc., version15.0.Chicago,USA).
This study received approval from the Institutional ReviewBoardsoftheSchoolofPublicHealthandSchoolof Medicine (University ofSãoPaulo, Brazil).All participants andparents/guardiansprovidedwritteninformedconsent.
Results
Table1displaysthedemographicandanthropometric char-acteristics of the sample. Most intervieweeswere female (54.4%), non-white (53.4%), and attending high school at the timeofthe interview(63.6%).Eleven (12.5%)lived in foster homes and the others lived with family members. Amongthosewholivedwithfamily,63.2%hadatleastoneof theirbiologicalparentsand25%hadtheirgrandparentsas caregivers. Other familymembers werealso cited: adop-tive parents (10.5%), aunt/godmother (10.5%), and sister (2.6%). Thirty familieslived onless than US$ 500/month. Mostparticipants’families(77.8%)livedonUS$250/month (the Brazilian minimum wage) or less. Eight participants (9.1%)wereoverweight,sevenwereobese(8.0%),and thir-teen (15.7%) hadheight-for-age deficit. Most participants hadasedentarylifestyle(70.5%).
Regardingclinical characteristics, morethan half were diagnosedwithHIVbeforetheageofoneyear(56.8%)and thevastmajoritywereinfectedvertically(95.5%).Fifty-five participants (62.5%) had developed AIDS-defining diseases andonlythree(3.4%)wereasymptomatic.Themajorityof participantshadbeenhospitalizedatleastonce(71.6%).
ThemeantotalHEI-2005scorewas51.90(range:33.47 to77.06 points outof the total of 100points) asTable 2 displays. No significant correlations were found between HEI scores and age at the onset of the study (r=0.06; p=0.546),householdincomelogarithm(r=0.00;p=0.775), Z-scoreofheight-for-ageattheonsetofthestudy(r=0.03; p=0.776),orwaistcircumference(cm)attheonsetofthe study(r=0.17;p=0.115).Indeed,nostatisticallysignificant associationswerefoundbetweenthemeanHEI-2005score andanyoftheindependentvariables(Table2).
Table3displaysmeanHEI-2005scoresaccordingtosex. Meanswerehighforthefollowingcomponents:totalgrains, oils,meatandbeans,totalvegetables,anddarkgreenand orangevegetablesandlegumes.The highestproportionof the maximum score was found for oils (84.1%); followed bytotalgrains(83.0%);anddarkgreenvegetables,orange vegetables, and legumes (79.6%). In contrast, the lowest means were found for whole grains, sodium, and whole fruit,andcaloriesfromsolidfats,alcoholicbeverages,and added sugars. The components with the highest propor-tionoftheminimumscore(zero)weresodium(86.4%)and wholegrains(72.7%).Nosignificantdifferenceswerefound between sexes, except withregard tomilkand dairy,for whichgirlshadhigherscores(p=0.038),andcaloriesfrom solidfats,alcoholicbeverages,andaddedsugars,forwhich boyshadhigherscores(p=0.005).
Table1 Demographicandanthropometriccharacteristicsofsample(absoluteandrelativefrequencies),InstitutodaCrianc¸a,
SãoPaulo,Brazil,2010.
Variable Category n %
Sex Male 40 45.5
Female 48 54.5
Ageatonsetofstudy 10-13years 24 27.3
13-16years 33 37.5
16-20years 31 35.2
Ethnicity White 41 46.6
Non-white 47 53.4
Residence Withfamily 80 90.9
Fosterhome 8 9.1
Caregivera Biological/adoptiveparents 48 63.2
Otherrelatives 28 36.8
Householdincomeb <1minimumwagec 49 77.8
≥1minimumwagec 14 22.2
Educationd Elementaryschool 8 14.3
Highschool 48 85.7
Heightforageatonsetofstudye Inadequate 13 15.7
Adequate 70 84.3
Nutritionalstatusatonsetofstudy Underweight 6 6.8
Idealrange 67 76.1
Overweight/obese 15 17.1
Waistcircumference(cm)atonsetofstudy 54-68cm 29 33.7
69-76cm 29 33.7
76-104cm 28 32.6
CDCclassificationatonsetofstudy N1toB3 57 64.8
C1toC3 31 35.2
Sedentarylifestyle Yes 62 70.5
No 26 29.5
a Percentagecalculatedfor76adolescents. b Percentagecalculatedfor63adolescents.
c Basedonthe2010Brazilianminimumwage(R$510=approximatelyUS$250). d Percentagecalculatedfor56adolescents.
e Percentagecalculatedfor83adolescents.
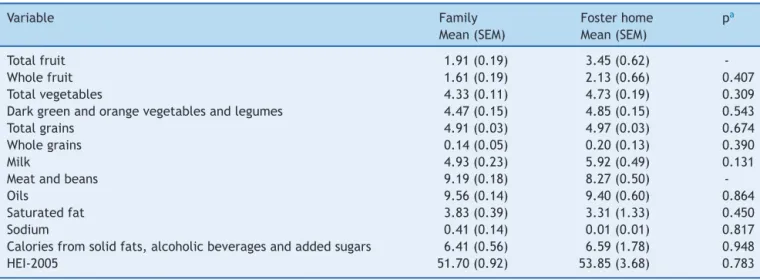
consumption(p=0.015)andlowermeansformeatandbeans consumption (p=0.026) among adolescents living in fos-ter care in comparison tothose living with their families (Table4).
Discussion
In the present study, the mean HEI-2005 score was low amongadolescentswithHIV/AIDSandnoassociationswere foundbetweenHEI-2005scoresandtheindependent varia-blesanalyzed,exceptinthestratifiedanalyses.
A number of studies have employed the HEI/HEI-2005 to assess the diet quality of adolescents in the general population.16---19However,onlyonestudywasfound
evaluat-ingthedietofadolescentswithHIV/AIDS.13Kruzichetal.20
usedaHEIcontainingnineitemsratherthanten,withthe totalrangingfrom0to100points,andfoundameanscore of55.2points,whichissimilartothatfoundinthepresent study.Thecomponentswiththelowestmeansweresodium, cholesterol,fruits,andtotalfat.However,itisnotpossible tocomparecholesterolandtotalfat,sincethesetwoitems arenotpartof theHEI2005. Regardingsodium, thisitem hadthelowestofallscoresinboth studies.Kruzichetal.
foundhighmeansformeatandtotalgrains.20Inthepresent
study,themeansforthesegroupswereamongthehighest. These findings indicatethat adolescents withHIV in both BrazilandtheUnitedStateshaveadequatemeatandtotal grainconsumption, aswellasinadequatefruitandsodium intake.
Studiesworldwidehaveassesseddietqualityamong ado-lescentsnotinfectedwithHIV.16---19Population-basedstudies
conductedinButantã(adistrictinthecityofSãoPaulo)and thestateofSãoPaulo usedtheHEItoevaluatediet qual-ityamong adolescents,reporting means of 58.2 and 59.7 points,respectively,16,17whicharecomparabletothemean
HEI-2005scorefound foradolescentswithHIV/AIDSinthe presentstudy.
DataonfoodconsumptionfromtheThirdNationalHealth andNutrition Examination (NHANESIII) carried outin the USA employing the HEI-2005 found a mean score of 54.8 pointsforadolescentsaged12to19years.18Astudy
employ-ing the same method assessed 1,104 Turkish adolescents aged 14 to 18 years and found similar results (HEI-2005 score:51.5points).19 Bothstudiesofferevidencethatlow
Table2 MeanHEI-2005scoreaccordingtoindependentvariables;InstitutodaCrianc¸a,SãoPaulo,Brazil,2010.
Variable Category Mean(SEM) p-value
Sex Male 51.90(0.90) 0.459
Female 52.63(1.35)
Ethnicity White 50.30(1.22) 0.097
Non-white 53.29(1.28)
Residence Withfamily 51.70(0.92) 0.496
Fosterhome 53.84(3.68)
Caregivera Biological/adoptiveparents 50.79(1.29) 0.304
Otherrelatives 52.86(1.40)
Nutritionalstatusat onsetofstudy
Overweight/obese 52.41(2.69) 0.296
Underweight/idealrange 51.79(0.94) CDCclassificationat
onsetofstudy
N1toB3 51.95(1.14) 0.943
C1toC3 51.81(1.48)
Severeillness Yes 52.23(1.53) 0.778
No 51.70(1.12)
Mild/moderateillness Yes 51.79(0.92) 0.517
No 55.03(5.15)
Hospitalization Yes 51.44(1.16) 0.355
No 53.37(1.45)
Numberof hospitalizations
Upto3 51.26(1.09) 0.306
4ormore 53.25(1.58)
Chemoprophylaxis (Pneumocystis jirovecior Mycobacterium tuberculosis)
Yes 52.52(1.02) 0.174
No 49.39(1.97)
Useofantiretroviral therapyatonsetof study
Yes 51.87(0.91) 0.816
No 53.28(8.02)
Typeofantiretroviral therapyatonsetof study
Double 49.97(1.41) 0.116
Triple/quadruple 52.94(1.14)
Sedentarylifestyle Yes 52.32(1.03) 0.476
No 50.90(1.83)
SEM,standarderrorofthemean.
aOnlyforadolescentslivingwiththeirfamilies(n=80).
The individual analysis of components allows for the identification ofthe main dietaryinadequacies of agiven population. In the present investigation, the components withthelowest means were wholegrains,sodium, whole fruit, total fruit, calories from solid fats, alcoholic bev-erages, and added sugars and saturated fat, which is in agreementwithfindingsdescribedinpreviousstudies.18---20
Data from the 2009 Brazilian Family Budget Survey (POF 2009)revealedlowfruitintakebytheBrazilianpopulation. Evenindividualsinthe90thpercentileforfruitsand vegeta-bles consumption fail toreach theWHO recommendation of400g/day21 and only6.4% of adolescentsin thecity of
SaoPaulo meetthisrecommendation.22 Studiesconducted
worldwide also report insufficient intake regarding these twofoodgroups.16---20,23
Thesecondlowestmeanintakeregardedsodium. How-ever, one should interpret this finding with caution, considering the complexity of the quantification of this micronutrient.24 Standardized recipes were used in the
present study, which may have introduced measurement errors. However, a study conducted by Sarno et al., based on data from the 2003 Brazilian Family Budget Survey, points out that the availability of sodium in Brazilian households is twofold greater than the recom-mended intake.25 Other studies involving the HEI also
found important sodium intake, reporting low to inter-mediate means for this item (ranging from 3.7 to 6.2 points).16---18 Moreover, the use of different cutoff points
Table3 DescriptivestatisticsoftheHealthyEatingIndexscoreanditscomponents;InstitutodaCrianc¸a,SãoPaulo,Brazil, 2010.
Total Boys Girls
Component Mean(SEM) %0a %Maxb Mean(SEM) %0a %Maxb Mean(SEM) %0a %Maxb pc
Totalfruit 2.05(0.19) 21.6 11.4 2.24(0.30) 22.5 15.0 1.89(0.24) 20.8 8.3 0.348
Wholefruit 1.66(0.19) 34.1 10.2 1.61(0.29) 32.5 12.5 1.70(0.24) 35.4 8.3 0.742
Totalvegetables 4.37(0.11) 0.0 60.2 4.33(0.17) 0.0 62.5 4.40(1.38) 0.0 58.3 0.917
Darkgreen
vegetables,orange
vegetablesand
legumes
4.51(0.14) 6.8 79.6 4.44(0.19) 5.0 72.5 4.56(0.20) 8.3 85.4 0.155
Totalgrains 4.92(0.25) 0.0 83.0 4.89(0.04) 0.0 80.0 4.94(0.30) 0.0 85.4 0.435
Wholegrains 0.14(0.05) 72.7 0.0 0.16(0.07) 70.0 0.0 0.13(0.06) 75.0 0.0 0.612
Milk 5.02(0.22) 2.3 2.3 4.53(0.28) 0.0 2.5 5.43(0.31) 4.2 2.1
-Meatandbeans 9.11(0.17) 1.1 59.1 8.86(0.31) 2.5 60.0 9.32(0.16) 0.0 58.3 0.612
Oils 9.54(0.14) 0.0 84.1 9.64(0.19) 0.0 87.5 9.46(0.20) 0.0 81.3 0.418
Saturatedfat 3.78(0.38) 0.0 14.8 3.80(0.57) 0.0 17.5 3.77(0.50) 0.0 12.5 0.840
Sodium 0.37(0.13) 86.4 0.0 0.09(0.05) 90.0 0.0 0.60(0.23) 83.3 2.1 0.279
Caloriesfromsolid
fats,alcoholic
beverages,and
addedsugars
6.43(0.53) 13.6 0.0 8.03(0.77) 7.5 0.0 5.09(0.69) 18.8 0.0
-HEI-2005 51.90(0.90) 0.0 0.0 52.63(1.35) 0.0 0.0 51.29(1.22) 0.0 0.0 0.459
SEM,standarderrorofthemean. a Percentageofminimumscores. b Percentageofmaximumscores.
c Tocomparemeansbysex,theMann-Whitneytestwasemployedforallcomponents,exceptmilk;saturatedfat;caloriesfromsolid
fats,alcoholicbeverages,andaddedsugars;andtotalHEI-2005score,forwhichStudent’st-testwasused.
The adolescents in the present study had low scores regardingcaloriesfromsolidfats,alcoholicbeverages,and added sugars, which were comparable to scores among American adolescents, as reported in NHANES III.26 This
finding may be partially explained by the high consump-tion of carbonated soda and sandwich cookies, both rich in sugar.Data fromthe2009 Brazilian FamilyBudget Sur-veyrevealed thatsugaraccounted for nearly20%of total
energy among individuals who consumed sandwich cook-ies;this surveyalsoreports ahigh intakeofsugary drinks (medianconsumptionexceeding120grams/day),21whichis
inagreement withthe present findings. In another study, 50.9%ofninthgradeadolescentsreportedhavingconsumed sweets,37.2%reportedhavingconsumedcarbonatedsoda, and36.2%reportedhavingconsumedcookies fiveormore daysinthepreviousweek.27Theconsumptionofcarbonated
Table4 Comparisonofcomponentmeansaccordingplaceofresidence;InstitutodaCrianc¸a,SãoPaulo,Brazil,2010.
Variable Family
Mean(SEM)
Fosterhome
Mean(SEM)
pa
Totalfruit 1.91(0.19) 3.45(0.62)
-Wholefruit 1.61(0.19) 2.13(0.66) 0.407
Totalvegetables 4.33(0.11) 4.73(0.19) 0.309
Darkgreenandorangevegetablesandlegumes 4.47(0.15) 4.85(0.15) 0.543
Totalgrains 4.91(0.03) 4.97(0.03) 0.674
Wholegrains 0.14(0.05) 0.20(0.13) 0.390
Milk 4.93(0.23) 5.92(0.49) 0.131
Meatandbeans 9.19(0.18) 8.27(0.50)
-Oils 9.56(0.14) 9.40(0.60) 0.864
Saturatedfat 3.83(0.39) 3.31(1.33) 0.450
Sodium 0.41(0.14) 0.01(0.01) 0.817
Caloriesfromsolidfats,alcoholicbeveragesandaddedsugars 6.41(0.56) 6.59(1.78) 0.948
HEI-2005 51.70(0.92) 53.85(3.68) 0.783
soda, salty and sweet snacks, and pizza is a marker of unhealthydietsrelatedtoinsufficientfiberingestion regard-lessofHIV-infectionstatus.
Incontrasttofindingsfrompreviousstudies,16---20,26high
meanswerefoundfortotalvegetables,aswellasdarkgreen vegetables,orangevegetables,andlegumes.Thesefindings maybemainlyattributedtothehighconsumptionofbeans inthis population. Inthe HEI-2005,beans areincluded in total vegetables and dark green vegetables, orange veg-etables, and legumes, simultaneously, if meat and beans recommendationsaremet.15Asmeatconsumptionwas
ade-quateformanyadolescents,beanswereoftenattributedin bothgroups.
Two components differed significantly in the analyses stratifiedbyplaceofresidence.Amongadolescentslivingin fosterhomes,higherfruitintakeandlowerintakeofmeat and beans were found in comparison to adolescents who livedwiththeirfamilies.ManyfosterhomesinBrazilreceive supportfromdietitianstoplanmenusandoperatewith gov-ernmentfunding,donationsfromcompanies,andvolunteer work.26Incontrast,nodifferencesinmeanswerefoundfor
theremainingitems.Itisknownthatfosterinstitutionsface adversities,suchashighturnoverofvolunteersand employ-ees due tolow salaries and excessive workloads,28 which
exert an impacton the quality of the service offered to residents.
Nosignificantdifferenceswerefoundinthestratification by sex. Conflicting results are reported in previous stud-ies.AnalyzingadolescentsinthestateofSãoPaulo(Brazil), deAndradeetal.17 foundhighermeanscores amongboys
(about two points higher in comparison to girls). Analyz-ingAmerican adolescentswithHIV, Kruzich etal.20 found
highermeanscoresamonggirls(nearlytwopointshigher). AkarTeketal.19foundnodifferencesbetweensexesamong
Turkishadolescents,whichisinagreementwiththepresent findings.
However,theanalysis ofdiet componentsaccording to sexidentified two differences, namely, milk and calories from solid fats, alcoholic beverages, and added sugars. The lowermeans amonggirls for calories fromsolid fats, alcoholicbeverages, andaddedsugars isdue toagreater ingestionofhighlyprocessedfoods,whicharegenerallyrich infatandsugar.Asimilarphenomenonwasobservedamong schoolchildrenevaluatedduringthe2009BrazilianNational Adolescent School-Based Health Survey (PeNSE 2009), as theconsumptionofsweets(58.3%)andsnacks(38.2%)was greateramonggirls.Accordingtothissurvey,42.6%ofgirls had consumed sweets five days in the week prior to the inquiry.27 The inverse occurred withmilk, for which boys
had lowermeans. This finding differs from the results of theaforementionedsurvey,inwhichagreaterproportionof boys(58.3%versus49.4%)consumedmilkatleastfivedays aweek.27
TheHEI-2005wasnotassociatedwithanyof the varia-blesanalyzedinthepresentstudyandthereisnoconsensus intheliteratureregardingwhichvariablescorrelatetothis index.Likeother instruments,the HEI/HEI-2005is greatly influenced by the composition and characteristics of the study population. Moreover, food consumption is difficult tomeasureduetotheinfluenceofdifferentindividualand environmentalfactors.29 Despitethisdifficulty,other
stud-ieshavefoundassociationswithhousingtype(shantyversus
house/apartment), lowlevelofparentaleducation, and overweight/obesity.23,30
It is important to take into account some limitations of thisstudy.Thefirstis thestudy design.Cross sectional studies provideweakerevidencewhen comparedtoother studydesigns.However,inthiscase,thedesignwasuseful to describethe diet qualityof adolescents withHIV/AIDS in follow up at a referral hospital. Though no sampling procedures wereperformed, a study population recruited in a hospitalsuchasInstituto daCrianc¸a (ICr),which has beentreatingHIV/AIDSinasignificantnumberofpediatric patients fromallsocial strata andevenfromother states sincethebeginningoftheAIDSepidemicinBrazil,isa rea-sonablealternative.
Inconclusion,theassessmentofdietqualityamong ado-lescentswithHIV/AIDSusingtheHEIrevealedsimilarresults tothosefound in thegeneraladolescent population: high intakeofsugar,saturatedfat,andsodium,andinsufficient intakeofwholegrainsandfruits.Therefore,despite repre-sentingpartofapopulationthatrequiresspecialattention, adolescents with HIV/AIDS exhibit a similar eating pat-terntothatofnon-infectedadolescents.Nonetheless,most adolescentsunder treatment for HIV/AIDSare exposedto anotherriskfactorforthedevelopmentofchronicdiseases, namely,HAART.Thus,thispopulationneedstomaintainan adequatediet.Inordertoachievethisgoal,periodical in-depthdietaryassessmentsofadolescentswithHIV/AIDSare recommended,sothat dietitianscan identifyandaddress inadequateeatingpractices.Pediatriciansandotherhealth professionalsofthemultidisciplinaryteamshouldreinforce topatientstheimportanceofahealthydiettohelppreserve theimmunefunctionandtomitigatetherisksimposedby boththediseaseanditstreatment.
Funding
This studywasfundedby Fundac¸ãodeAmparo àPesquisa do Estado de São Paulo (FAPESP), Conselho Nacional de Desenvolvimento Científico e Tecnológico (CNPq), and Coordenac¸ãodeAperfeic¸oamentodePessoaldeNível Supe-rior(CAPES).
Conflicts
of
interest
AlineMSilvahasworkedforJanssen Pharmaceutical Com-paniesofJohnson&JohnsonsinceMayof2012.
Acknowledgments
The authors would liketothank themedicalteam of the InfectiousDiseasesUnitofInstitutodaCrianc¸a:DraSamatha BrasilAndrade,CláudiaMenezes,VeraLúciaMoysesBorelli, MariadeFátimaCarvalho, andNádiaLitvinovfor alltheir support.TheyalsothankSofiadeFátimadaSilvaBarbosade Oliveira,FláviaMoniqueSantos,andElissaCarolineMendes forassistingwithdatacollection.
References
treatmentofhumanimmunodeficiencyvirus(HIV).Washington, DC:USGovernmentPrintingOffice;1997.
2.dosReisLC,deCarvalhoRondóPH,deSousaMarquesHH,de AndradeSB.Dyslipidaemiaandinsulinresistanceinvertically HIV-infectedchildrenand adolescents.Trans RSocTrop Med Hyg.2011;105:197---203.
3.ChandraRK.Nutritionandtheimmunesystem:anintroduction. AmJClinNutr.1997;66:460S---3S.
4.SharmaTS,KinnamonDD,DugganC,WeinbergGA,FurutaL, BechardL,etal.Changesinmacronutrientintakeamong HIV-infected children between 1995 and 2004. Am J Clin Nutr. 2008;88:384---91.
5.Werner ML, Pone MV, Fonseca VM, Chaves CR. Lipodystro-physyndromeand cardiovascularriskfactorsinchildrenand adolescents infected with HIV/AIDS receiving highly active antiretroviraltherapy.JPediatr(RioJ).2010;86:27---32. 6.NielsenSJ,AdairL.Analternativetodietarydataexclusions.J
AmDietAssoc.2007;107:792---9.
7.Brasil.MinistériodaSaúde.SecretariadeVigilânciaemSaúde. ProgramaNacionaldeDSTeAids.Critériosdedefinic¸ãodecasos deaidsem adultosecrianc¸as. Brasília:MinistériodaSaúde; 2003.SérieManuaisn.◦60.
8.de Onis M, Garza C, Onyango AW, Rolland-Cachera MF. le ComitédenutritiondelaSociétéFranc¸aisedePédiatrie.WHO growthstandardsforinfantsandyoungchildren.ArchPediatr. 2009;16:47---53.
9.ZabottoCB,VianaRP,GilMF.Registrofotográficopara inquéri-tosdietéticos:utensílioseporc¸ões.Campinas.SP:UNICAMP; Goiânia:UFG;1996.
10.CarriquiryAL.Estimationofusualintakedistributionsof nutri-entsandfoods.JNutr.2003;133:601S---8S.
11.NúcleodeEstudosePesquisasemAlimentac¸ão(NEPA).Tabela brasileiradecomposic¸ãodealimentos.3rded.Campinas:NEPA; UNICAMP;2008.
12.Brasil.Ministério da Saúde. Secretaria de Atenc¸ão à Saúde. Coordenac¸ão-Geral da Política de Alimentac¸ão e Nutric¸ão. Guia alimentar para a populac¸ão brasileira: promovendo a alimentac¸ãosaudável.Brasília:MinistériodaSaúde;2005.Série A.NormaseManuaisTécnicos.
13.U.S.DepartmentofAgriculture,AgriculturalResearchService. 2011.USDANationalNutrientDatabaseforStandardReference, Release24.
14.GermanInstituteofHumanNutritionPotsdam-Rehbrücke. Mul-tipleSourceMethod(MSM).[cited1July2011].Availablefrom: https://nugo.dife.de/msm
15.Previdelli AN, Andrade SC, Pires MM, Ferreira SR, Fisberg RM, Marchioni DM. A revised version of the Healthy Eating IndexfortheBrazilianpopulation.RevSaudePublica.2011;45: 794---8.
16.GodoyFC,AndradeSC,MorimotoJM,CarandinaL, Goldbaum M, Barros MB, et al. Índice de qualidade da dieta de ado-lescentesresidentesnodistritodoButantã,municípiodeSão Paulo,Brasil.RevNutr.2006;19:663---71.
17.deAndradeSC,deAzevedoBarrosMB,CarandinaL,Goldbaum M,CesarCL,FisbergRM.Dietaryqualityindexandassociated factorsamongadolescentsofthestateofSaoPaulo.BrazilJ Pediatr.2010;156:456---60.
18.FungweT,GuentherPM,JuanWY,HizaHA,LinoM.The qual-ityofchildren’sdietsin2003-04asmeasuredbytheHealthy Eating Index- 2005. NutritionInsight 43.Alexandria, VA: US DepartmentofAgriculture;2009.
19.AcarTekN,YildiranH,AkbulutG,BiliciS,KoksalE,Gezmen KaradagM,etal.Evaluationofdietaryqualityofadolescents usingHealthyEatingIndex.NutrResPract.2011;5:322---8. 20.KruzichLA,MarquisGS,WilsonCM,StephensenCB.HIV-infected
US youthare athighriskofobesity and poordietquality: a challengeforimprovingshort-andlong-termhealthoutcomes. JAmDietAssoc.2004;104:1554---60.
21.Brasil.MinistériodoPlanejamento,Orc¸amentoeGestão. Insti-tuto Brasileiro de Geografia e Estatística (IBGE). Pesquisa deorc¸amentos familiares2008-2009:antropometriaeestado nutricionaldecrianc¸as,adolescenteseadultosnoBrasil.Rio deJaneiro:IBGE;2010.
22.Bigio RS, Verly Junior E, Castro MA, César CL, Fisberg RM, Marchioni DM. Determinants of fruit and vegetable intake in adolescentsusing quantile regression. RevSaude Publica. 2011;45:448---56.
23.Duran AC,Almeida LB, SeguradoAA, Jaime PC. Dietquality ofpersonslivingwithHIV/AIDSonhighlyactiveantiretroviral therapy.JHumNutrDiet.2008;21:346---50.
24.Vander VeenJE, De GraafC,VanDisSJ, VanStaveren WA. DeterminantsofsaltuseincookedmealsintheNetherlands: attitudes and practices of food preparers. Eur J Clin Nutr. 1999;53:388---94.
25.SarnoF,ClaroRM,LevyRB,BandoniDH,FerreiraSR,Monteiro CA.EstimatedsodiumintakebytheBrazilianpopulation, 2002-2003.RevSaudePublica.2009;43:219---25.
26.GuentherPM,JuanWY,LinoM,HizaHA,FungweT,LucasR.Diet qualityoflow-incomeandhigherincomeAmericansin2003-4 asmeasuredbytheHealthyEatingIndex-2005.NutritionInsight 42,U.S.DepartmentofAgriculture,CenterforNutritionPolicy andPromotion.
27.Brasil.MinistériodoPlanejamento.Orc¸amentoeGestão. Insti-tuto Brasileiro de Geografia e Estatística (IBGE). Pesquisa NacionaldeSaúdedoEscolar.RiodeJaneiro:IBGE;2009. 28.Brasil. Ministério da Saúde. Secretaria de Projetos
Especi-aisde Saúde.Coordenac¸ão Nacionalde DSTeAids. Guia de recomendac¸ões: casas de apoio em HIV/Aids. Brasília: Min-istériodaSaúde;1997.
29.StangJ,StoryM.Guidelinesforadolescentnutritionservices. Minneapolis,MN:Centerfor Leadership,Educationand Train-inginMaternal andChild Nutrition,Division ofEpidemiology andCommunityHealth,SchoolofPublicHealth,Universityof Minnesota;2005.