ABSTRACT: Sandwich structures are nowadays widely used due its excellent characteristics of matching light weight with high bend stiffness. However the complex nature of its composition turns the estimation of its mechanical elastic properties challenging. The objective of the present article is to propose an analytical/experimental model to estimate the orthotropic elastic properties of this composite material. To accomplish this objective a theory of anisotropic plates is used together to an extensometric experimental approach. A sandwich laminate specimen, instrumented with strain gages, was submitted through pure bending loading by a mechanical testing machine on a 4-point bending apparatus. The result of this research was the determination of 4 orthotropic elastic properties of the sandwich laminate specimen, namely: the longitudinal and transversal Young moduli, the shear modulus, and the Poisson’s ratio.
KEYWORDS: Sandwich laminates, Orthotropic properties, Analytical model.
Orthotropic Elastic Properties Assessment
of Sandwich Laminates
Paulo Pedro Kenedi1,2, Lucas Lisboa Vignoli3, Brenno Tavares Duarte2, Fernando Cesar de Abreu Matos1,
Humberto Oberosler Terço Dias1
INTRODUCTION
Composites materials, as sandwich laminates, have been widely used for structural purposes. These structures are anisotropic, combining external ibers (with high strength) and an internal core (with low stifness). his combination of materials contributes to turn its stress analysis not as straightforward.
Much efort has been done to use sandwich laminates as an engineering material. Authors as Bledzki et al. (1999) identiied elastic properties of unidirectional glass/epoxy laminates through the measuring of its natural frequencies in experimental vibration experiments. Lamboul et al. (2013) investigated the potential of ultrasonic Lamb waves to estimate the initial elastic modulus of glass iber woven composite materials. he elastic modulus of the undamaged materials was estimated using time of lights (TOF) of extensional waves (also known as Lamb S0 mode) generated by a piezoelectric material. Rikards et al. (2001) and Rikards et al. (1999) used mixed numerical/experimental techniques to estimate mechanical properties of composites laminates. In the experimental part it was used real-time holography, and in the numerical part it was used the inite element method. Lecompte et al. (2007) have also used a mixed numerical-experimental method to identify 4 in-plane orthotropic engineering constants of composite plate materials. It was used a biaxial tensile test, performed on a cruciform test specimen. A heterogeneous displacement ield was observed by a CCD camera and measured by a digital image correlation (DIC) technique. he measured displacement ield and the subsequently computed strain field were compared with a inite element simulation of the same experiment. An optimization technique was then used to minimize the errors
1.Centro Federal de Educação Tecnológica Celso Suckow da Fonseca – Departamento de Engenharia Mecânica – Laboratório de Compósitos e Adesivos – Rio de Janeiro/RJ – Brazil. 2.Centro Federal de Educação Tecnológica Celso Suckow da Fonseca – Programa de Pós-Graduação em Engenharia Mecânica e Tecnologia de Materiais – Laboratório de Compósitos e Adesivos – Rio de Janeiro/RJ – Brazil. 3.Universidade Federal do Rio de Janeiro – Centro de Mecânica Não-Linear – Departamento de Engenharia Mecânica – Rio de Janeiro/RJ, Brazil.
Author for correspondence: Paulo Pedro Kenedi | Centro Federal de Educação Tecnológica Celso Suckow da Fonseca – Departamento de Engenharia Mecânica –
Laboratório de Compósitos e Adesivos | Avenida Maracanã, 229 – Maracanã | CEP: 20.271-110 – Rio de Janeiro/RJ – Brazil | Email: [email protected]
between experimental and numerical approaches resulting in the estimation of 4 independent apparent engineering constants: Ex, Ey, Gxy, and νxy.
Other authors as Tamilarasan et al. (2015) evaluated mecha-nical properties of sandwich laminates made up of carbon i ber with epoxy resin, used as a matrix, and aluminum (AA6061-T6), used as sandwich plate, through the realization of multiple tests as: uniaxial tensile, l exural, and impact. h e tests results were used by the authors to describe, in a macroscopic perspective, the dif erent material behavior associated to dif erent levels of strengths (axial, l exural, and impact), including the failure mechanisms.
The research of Hu and Karki (2015) involved a 2-step modeling approach to estimate the mechanical properties of 3-D carbon fiber-reinforced epoxy composites. In step 1, the microstructures of the composites were represented by 3-D microscale cylindrical, square, or hexagonal prismatic representative volume element (RVE) and were subject of multiple tests as: uniaxial tensile, lateral expansion, and transverse shear. In step 2, the overall composites were represented by a 3-D macroscale unit cell that was discretized into elements. Each element was assigned with appropriate properties, taking into account the carbon i ber orientation and volume fraction. h e averaged mechanical properties of the RVEs from step 1 were input into each element accordingly. h e ef ective orthotropic mechanical properties of the composites were predicted by uniaxial tensile tests and shear tests on the unit cell.
To improve the understanding of mechanical behavior of sandwich laminates, this article proposes a combined model, using analytical and experimental approaches, to estimate 4 orthotropic mechanical elastic properties of sandwich laminates. h e analytical part uses a theory of anisotropic plates and the experimental one, strain gages to obtain the strains generated on a sandwich laminate specimen, submitted to pure bending on a 4-point bending test. Note that although, in technical literature, it is more common the utilization of unidirectional composite materials, in this article a woven (fabric) sandwich laminate was used to obtain the longitudinal and the transversal Young moduli, the shear modulus, and the Poisson’s ratio mechanical properties. In the next section the analytical models are described.
ANALYTICAL MODELS
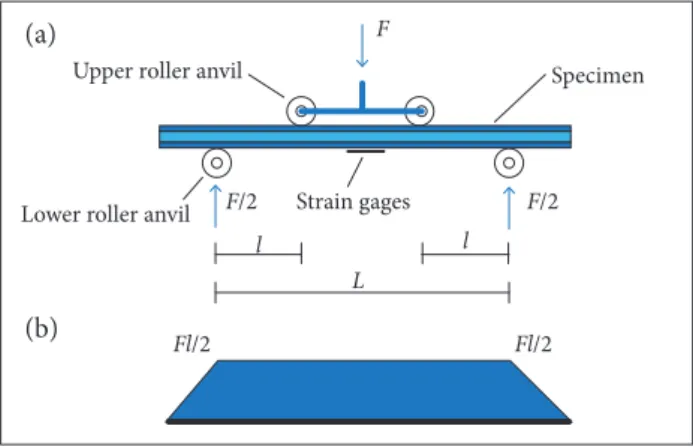
Some initial information, as the 4-point bending apparatus and the specimen principal dimensions are provided before the analytical models description are given. Figure 1 shows a
schematic representation of the sandwich laminate specimen, instrumented with strain gages, submitted to pure bending in its central region (between upper roller anvils), on a 4-point bending apparatus.
Note in Fig. 1a that the dark blue color represents the external polymeric matrix, with high strength carbon i bers (0°/90°)/epoxy (with 0.6 mm of thickness each) and the light blue color represents the low stif ness PVC foam (with 3.8 mm of thickness). h e distance between the upper roller anvil and the immediate adjacent lower roller anvil is l = 50 mm and the distance between the lower roller anvils is L = 170 mm.
Figure 2 shows the sandwich laminate specimen schematic drawing, with specimen nominal dimensions and the used coordinate systems. θ is an angle, in counterclockwise direction, between local and global systems, beginning with θ = 0° on global axis direction 11. Two analytical models are provided to estimate orthotropic elastic constants of composite sandwich specimens, both considering Euler-Bernoulli hypothesis. h e i rst model is a simplii ed approach which disregards the core material stif ness and the second one is a complete analytical solution that considers
Figure 1. (a) Schematic representation of the 4-point bending apparatus with specimen (lateral view); (b) Correspondent bending moment diagram.
Figure 2. Composite specimen schematic drawing at a third
angle projection (unscaled). Strain gages
33(l) = 33
250 mm 5 mm
30 mm 11(l)
22(l)
11 22
θ
F
F/2
Fl/2
Fl/2
l l
L F/2
Specimen Upper roller anvil
Lower roller anvil Strain gages
the stif ness of every layer, including the dif erent elastic moduli, in tension and in compression, of the core material. Both models depend on the experimental strain acquisition. Regardless of the layers anisotropy, it is assumed that the sections remain plane and perpendicular to the neutral axis, being enough to describe the normal strain variation along the cross section. A constitutive relation and the equilibrium requirements are additionally provided to implement the stress calculation, as in Lekhnitskii (1981).
SIMPLIFIED ANALYTICAL MODEL
h e simplii ed model is divided in stress and strain parts. First, the stress is estimated by application of a well-known mechanics of solids equation and the proposal of a constitutive relationship. h en, with the input of experimental strains, 4 elastic orthotropic constants are estimated.
At the central region of a 4-point bending setup, between upper roller anvils, the shear force vanishes and it is considered that this region is only submitted to pure bending loading. Hence, the unique non-null global stress component on the bottom of the beam in this region is, as in Crandall et al. (1978),
where: x3 is the vertical distance between the neutral axis and a given point of interest; M22 is the pure moment around 22 axis (see Fig. 2); I22 is the cross section second moment of area relative to 22 axis:
where: F is the applied load; l is the distance between the
upper roller anvil and the immediate adjacent lower roller anvil (see Fig. 1a); t
1 is the woven lamina thickness; tc is the
core thickness; b is the specimen width.
Note that for this simplii ed analytical model it is supposed that all loads are only resisted by the woven laminas, since the core material has a much lower stif ness (Kassapoglou 2010). h is simplii ed approach turns the σ
11 estimation straightforward. The normal local strains, at a general given angle θ, in
relation to the global axes, shown in Fig. 2, can be estimated as in Lekhnitskii (1981):
where the local stress components σ(l)
11, σ (l)
22, and σ (l)
12 can be obtained through the use of Mohr’s circle as in Crandall et al.
(1978):
and the local compliance components can be estimated as in Staab (2015):
Considering that the material coordinate system is coincident with the global coordinate axes, the reduced global compliance matrix C, also considering just the in-plane components and
its orthotropic symmetry for a woven lamina, can be written as in Staab (2015):
where: E
1 and E2 are the lamina elastic moduli for, respectively, 11 and 22 axis global directions; G
12 is the lamina shear modulus;
ν
12 is the lamina Poisson’s ratio.
Using the compliance matrix components, shown in Eq. 8, Eqs. 5 – 7 can be rewritten for plane stress case, as in Staab (2015):
(1)
(3)
(4)
(7)
(8)
(9)
(10) (6) (5)
Notice that Eq. 3 can be rewritten in a matricial form, with 4 lines, one per strain gage of angle θn.
COMPLETE ANALYTICAL MODEL
In this section the inl uence of the core on the estimative of the elastic orthotropic constants is carefully studied. To accomplish this objective a complete analytical model is presented considering the core asymmetric tension/compression behavior, as in Kenedi et al (2016). h e procedure presented next is based on solid mechanics theory and further discussions can be found in Crandall et al. (1978) as well as in Vasiliev and Morozov (2001).
In Fig. 4 Ec (t) and Ec
(c)
are, respectively, the core elastic modulus in tension and in compression. As the core tension properties are dif erent from the compression ones, the stress distribution is no more symmetric, turning the neutral axis position — x3 (see Fig. 4) an additional parameter to be taken (11)
(12)
(13)
(14) where:
h e i nal equation can be obtained rearranging Eq. 12, substituting the result of Eq. 1 and the strain-gages angles (from θ1 to θ4), and its respective experimental values (from ε(l)
11|θ 1 to ε
(l) 11|θ
4).
(15)
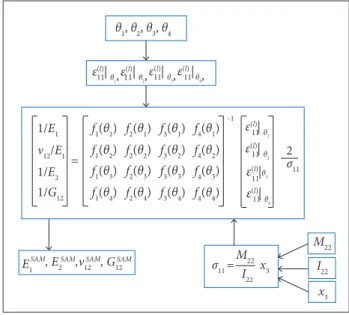
With Eq. 15 it is possible to estimate 4 elastic orthotropic constants (E1, E2, ν12, and G12). A l owchart is shown in Fig. 3 as a form to review the steps necessary to apply the simplii ed analytical model.
The flowchart of Fig. 3 shows the straightforward utilization of the simplii ed analytical model. In fact to estimate the 4 orthotropic elastic constants E1 SAM, E
2 SAM, v
12 SAM, G
12 SAM the angles of the strain gages have to be entered in relation to the specimen longitudinal axis θ1, θ2,θ3, and θ4
;
the correspondent experimental strain values ε(l)11|θ 1, ε
(l) 11|θ
2, ε (l) 11|θ
3, and ε (l) 11|θ
4; and the estimative of longitudinal bottom specimen stress σ11 into the linear system of Eq. 15 to obtain the estimative E1 SAM, E
2 SAM, v
12 SAM, G12 SAM. h e index “SAM” is the abbreviation of simplii ed analytical model. h e complete analytical model is provided in the next subsection.
Figure 4. Sandwich laminates specimen transversal cross-section dimensions.
Figure 3. Simplii ed analytical model l owchart.
θ1, θ2, θ3, θ4
(l)| θ1,
11
(l)| θ2
11
(l)|
(l)| θ4
11 11
(l)|θ 3 θ1
11
(l)| θ2,
11
(l)| θ3,
11
(l) | θ4,
11
1/E1 ν12/E1
=
–1
1/E2
1/G12
f1(θ1) f2(θ1) f3(θ1) f4(θ1)
f1(θ2) f2(θ2) f3(θ2) f4(θ2)
f1(θ3) f2(θ3) f3(θ3) f4(θ3)
f1(θ4) f2(θ4) f3(θ4) f4(θ4)
2
σ11
σ11 = M22 x3 I22
M22
I22
x3 E1S A M, E2
S A M, ν 12
S A M, G 12
S A M
x3
x3
x1
x2
x3 –tl
E 1
E c
E c
E 1 t
l
t c
tl
b t
l + tc –x3
(c)
into account by imposing the equilibrium conditions along the beam cross section. In fact Ec (t)
and Ec (c)
must be used as 2 limiting conditions with minimum and maximum properties, called, respectively, in this article, as lower and upper core bounds, which are available in Table 1. h ese lower and upper properties cover the range of elastic moduli available in technical literature for the core material, for instance, PVC foam. Note that to use both models there is no need for having any estimative of the lamina elastic moduli E1, which can be considered an advantage due to the great variability of this property in function of parameters like: fraction volume, epoxy type, fabric patterns and fabrication process.
(16)
(18)
(19)
(20)
(21)
(22)
(17)
Source: Diab Group and Divinycell (2016).
Table 1. Range of elastic modulus core material.
Lower bound core (lo)
Upper bound core (up)
Ec (t) (MPa) 49 320
Ec (c) (MPa) 40 400
Taking the asymmetric characteristic into account, considering that the section remains plane and perpendicular to the neutral axis and using the linear elastic constitutive relation, the force equilibrium along the cross section can be written as (Crandall et al. 1978):
where: ρ is the radius of curvature, which is supposed to be constant on the cross section.
Equation 16 is the definition of the centroid in non-homogeneous materials, which can be rewritten as:
Note that Eq. 17 is a second-order polynomial function but it is not completely defined once E1 is still unknown. Ec (t)
and Ec
(c) are i rst substituted by lower bounds and then by upper ones to verify the solution range. Since the neutral axis expression is obtained, the moment equilibrium on the cross section, following the same assumptions used for the force equilibrium, presented previously, is dei ned as Crandall et al. (1978):
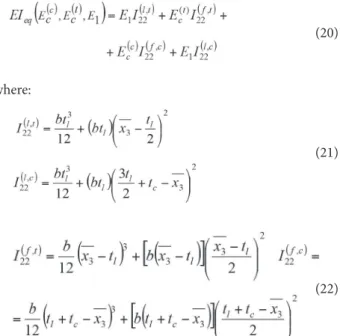
dei ning equivalent l exural rigidity as:
This quantity can be computed solving the integral or alternatively using the parallel axis theorem as
where:
h e upper indexes of the second moment of area are related to: the i rst index for the material l represents the lamina and
f represents the foam (at core); the second index for the stress state t represents tension and c represents compression. Note that to maintain compact the notation in Eqs. 21 and 22, —
x3 (Ec (c), E c (t),E
1) and I22 (,) (E
c (c), E
c (t),E
1) are written, respectively, as — x3 and I22 (,) .
h us, the radius of curvature expression is obtained from direct substitution in Eq. 18. Hence, the normal stress on the laminas of the sandwich laminate is calculated as
(23)
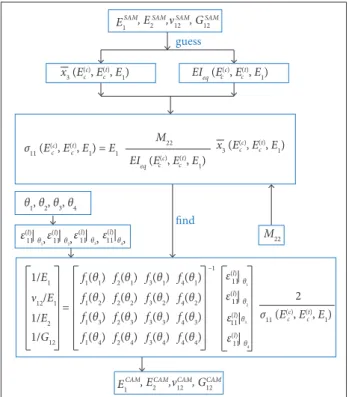
In Fig. 5 a l owchart of the complete analytical model is presented and shows a little more laborious implementation than the l owchart of Fig. 3. Note that this l owchart needs the results of the former one (Fig. 3), E1 SAM, E
2 SAM, v
12 SAM, G
consequently, E2, ν12, and G12. In fact, the complete analytical model has to be applied twice: i rst the lower bond core properties are used (with an index lo), shown in Table 1, for the Ec (t) and E
c (c)
properties to estimate: — x3 and EIeq (E(c) c_lo, E
(t)
c_lo,E1), which are substituted in σ11(E(c)
c_lo, E (t)
c_lo,E1). Inputting the angles of the strain gages θ1, θ2, θ3, and θ4 and the correspondent experimental strain values ε(l)
11|θ 1, ε
(l) 11|θ
2, ε (l) 11|θ
3, ε (l)
11|θ
4 into Eq. 15 and activating the “find” command of Mathcad software, the ECAM, ECAM, νCAM , GCAM results are obtained. Note that the index “CAM” is the abbreviation of complete analytical model. At the second time the upper bond core properties are used (with an index “up”), as shown in Table 1, for the Ec (t) and E
c (c)
properties to estimate: — x3 and EIeq (E(c) c_up, E
(t)
c_up,E1), which are substituted in σ11(E(c)
c_up, E (t)
c_up,E1) ; the same sequence that is done in the i rst time is repeated, resulting in ECAM, ECAM, νCAM , GCAM .
In the next section the experimental approach necessary to obtain 4 strain measurements in 4 distinct angles is explained.
described in details. In Fig. 6 it is shown the 4-point bending test apparatus, used in an INSTRON material testing machine. It was used a 5-kN load cell and the LVDT of the test machine. h e test was conducted monotonically under load control as stated in ASTM C393-00.
Note, in Fig. 6, the instrumented specimen is lying on a 4-point bending apparatus. h e strain gages are bonded at the bottom side of the specimen, as can be seen in Fig. 6b. It is possible to see a detailed view of the strain gages specimen instrumentation in Fig. 7a, where 3 of these strain gages are provided by an extensometric rosette and the fourth strain gage is provided by a uniaxial one. In Fig. 7b the denomination and the angle of each strain gage are presented.
A Spider 8 data acquisition system was used together with a HBM Catman Sot ware to set up the experimental strain data acquisition. It was used a Kyowa extensometric rosette KFG-3-120-D28-11, as well as a Kyowa uniaxial strain gage 1_lo 1_up 2_lo 2_up 12_lo 12_up 12_lo 12_up
Figure 5. Complete analytical model l owchart.
E1SAM, E
2 SAM,ν
12 SAM, G
12 SAM
E1 CAM, E
2 CAM,ν
12 CAM, G
12 CAM
ε(l)|
θ2 11
ε(l)|
ε(l)| θ4
1 1 1 1 ε(l)|θ
3 θ1
1 1 1 /E1
ν12/E1 =
–1
1/E2 1/G12
f1(θ1) f2(θ1) f3(θ1) f4(θ1) f1(θ2) f2(θ2) f3(θ2) f4(θ2) f1(θ3) f2(θ3) f3(θ3) f4(θ3)
f1(θ4) f2(θ4) f3(θ4) f4(θ4)
2
θ1, θ2, θ3, θ4
ε(l)| θ1,
11 ε(11l)|θ2,ε (l)| ε(l)|
θ3,
11 11θ4,
M22 M22
guess
ind
EIeq (E(c), E(t), E 1)
c c
EIeq (E
(c), E(t), E 1)
c c
x3 (E(c), E(t), E 1)
c c
σ11 (E(c), E(t), E 1) = E1
c c
σ11 (E (c), E(t), E
1)
c c
x3 (E(c), E(t), E 1) c c 2 1 4 330o 0o
9 0o
225o
3
EXPERIMENTAL APPROACH
In this section it is made a description of the equipment utilized in the experimental approach. All the sensors, transducers, data acquisition equipment, and materials testing
machine used in the experiment to obtain the strain signals are Figure 7. (a) Strain gages details; (b) S train gage positions.
Figure 6. 4-point bending apparatus with instrumented
specimen. (a) General view; (b) Specimen underside view.
(a) (b)
KFG-5-120-C1-11, bonded, at a sanding-prepared surface of the bottom lamina of the sandwich laminate specimen, with the utilization of a proper cyanoacrylate glue. Note in the detailed view (Fig. 7a), the utilized cabling. More information about the utilization of strain gages to measure strains on composites materials can be accessed at the fourth chapter of Staab (2015).
he objective of this test was to experimentally acquire the strain signals at 4 diferent angles, 0° (longitudinal and aligned to global axis 11), 90° (transversal), 225° and 330° (both inclined in relation to specimen longitudinal axis). he pure bending load was selected in order to make the strain gages positioning less critical, principally on the longitudinal direction.
Note that for analytical models, with the objective of using a more compact notation the strain gages were numbered from 1 to 4. he index equivalence between analytical and experimental notation is: 1 = 0°, 2 = 90°, 3 = 225°, and 4 = 330°, as also can be seen in Fig. 7b.
RESULTS AND DISCUSSION
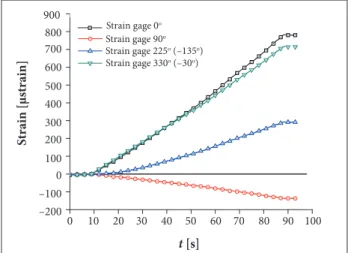
In this section the experimental strain signals outputs of the 4 strain gages are provided. Figure 8 shows the strain signals outputs of the strain gages bonded at the central part of the bottom side of the specimen submitted to a pure bending on a 4-point bending test.
he data acquisition rate used in this test was selected on 50 Hz for all the 4 channels, or, in other words, 50 samples per second for each channel. Many of the acquired points of Fig. 8 were suppressed, without any loss of relevant information, to turn the experimental results clearer. It was imposed
t [s]
S
tr
ain [μs
tr
ain]
0 10 20 30 40 50 60 70 80 90 100 – 200
– 100 0 100 200 300 400 500 600 700 800 900
Strain gage 330o (–30o)
Strain gage 0o
Strain gage 225o (–135o)
Strain gage 90o
Figure 8. Strains experimental results.
a displacement rate of 1 mm/min until the load reached the force plateau of 40 N and a correspondent transversal displacement of 1.3 mm.
Note that the monotonic increasing transversal force was arbitrarily stopped at a plateau of 40 N and transversal displacement of 1.3 mm because the specimen was perceptively beginning to assume a curved configuration, which could conflict with the applicability of the mechanics of solids theory, used for instance in Eqs. 1 and 2. It would not be expected to have any perceptible geometric differences between loaded and unloaded conigurations. Also it was used the high-quality load cell, already mounted on the test machine, which provided a load signal with a very low noise level, even for such low loads.
As expected the major strains occurred at 0° strain gage, aligned to the longitudinal direction (parallel to 11 global axis); at 225° and 330° the strains were at intermediary levels and, at 90° strain gage, which is the transversal one (parallel to 22 global axis), under the inluence of Poisson’s rate efect, it resulted in negative strains.
For this study the following strains results were used for both analytical models: ε(l)
11|θ
1= 780 με, ε (l)
11|θ
2= –136 με, ε(l)
11|θ
3 = 292 με and ε (l) 11|θ
4 = 715 με.
Table 1 shows the elastic modulus range of the core material (PVC foam) obtained in technical literature (Diab Group and Divinycell 2016).
Note that as previously explained in the section “Complete Ana lyt ic a l Mo del”, t here is a ne e d for t he lower bond properties (with an index “lo”) Ec (t) and E
c
(c) and the upper bond properties (with an index “up”) Ec (t) and E
c (c). hese properties were provided in Table 1: E(t)
c_lo = 49 MPa, E (c)
c_lo = 40 MPa, E(t)
c_up = 320 MPa, and E (c)
c_up = 400 MPa. As already commented to use both models there is no need for having any estimative of the lamina elastic moduli E1, which is an advantage since the great variability of this property is a function of parameters as: fraction volume, epoxy type, fabric patterns, and fabrication process.
In Table 2 there are the results of application of the models presented in section “analytical models” to estimate the orthotropic elastic properties of the sandwich laminates specimens: E1, E2, G12,and ν12.
complete analytical model could give a better contribution to the estimation of elastic mechanical properties of sandwich laminates which have a stifer core.
CONCLUSIONS
Two combined analytical/experimental models were proposed to estimate 4 orthotropic mechanical elastic properties of sandwich laminates. he analytical part uses a theory of
Model
Mechanical properties
E
1
(GPa)
E
2
(GPa)
ν
12G
12
(GPa)
Simpliied (SAM) 18.3 19.8 0.17 5.15
Complete (CAM)
(lower bound) 18.3 19.8 0.17 5.16
Complete (CAM)
(upper bound) 18.6 20.2 0.17 5.25
Table 2. Orthotropic elastic properties of the sandwich
laminates specimens.
REFERENCES
Bledzki AK, Kessler A, Rikards R, Chate A (1999) Determination of elastic constants of glass/epoxy unidirectional laminates by the vibration testing of plates. Compos Sci Technol 59(13):2015-2024. doi: 10.1016/S0266-3538(99)00059-7
Crandall SH, Dahl NC, Ladner TJ (1978) An introduction to mechanics of solids. 2nd Edition [with SI units]. New York: McGraw-Hill International Editions.
Diab Group, Divinycell H (2016) Technical Data No: H Feb 2016 rev16 SI; [accessed 2016 Aug 30]. https://www.diabgroup.com
Hu Z, Karki R (2015) Prediction of mechanical properties of three-dimensional fabric composites reinforced by transversally isotropic carbon ibers. J Compos Mater 49(12):1513-1524. doi: 10.1177/0021998314535960
Kassapoglou C (2010) Design and analysis of composite structures with applications to aerospace structures. Hoboken: Wiley.
Kenedi PP, Vignoli LL, Duarte BT, Matos FCA, Dias HOT (2016) Bending response of sandwich laminates. Proceedings of the BCCM-3 – Brazilian Conference on Composite Materials; Gramado, Brazil.
Lamboul B, Bai G, Roche JM, Grail G (2013) Estimation of elastic properties and damage monitoring in 2D woven composites using Lamb waves. Proceedings of the 13th Int. Symposium on Nondestructive Characterization of Materials (NDCM-XIII); Le Mans, France.
Lecompte D, Smits A, Sol H, Vantomme J, Hemelrijck (2007) Mixed numerical-experimental technique for orthotropic parameter identiication using biaxial tensile tests on cruciform specimens. Int J Solids Struct 44(5):1643-1656. doi: 10.1016/ j.ijsolstr.2006.06.050
Lekhnitskii SG (1981) Theory of elasticity of an anisotropic body. Moscow: Mir Publishers.
Rikards R, Chate A, Gailis G (2001) Identiication of elastic properties of laminates based on experiment design. Int J Solids Struct 38 (30-31):5097-5155. doi: 10.1016/S0020-7683(00)00349-8
Rikards R, Chate A, Kessler A, Steinchen W, Bledzki AK (1999) Method for identiication of elastic properties of laminates based on experiment design. Composites Part B 30(3):279-289. doi: 10.1016/S1359-8368(98)00059-6
Staab GH (2015) Laminar composites. 2nd Edition. Oxford: Elsevier.
Tamilarasan U, Karunamoorthy L, Palanikumar K (2015) Mechanical properties evaluation of the carbon ibre reinforced aluminium sandwich composites. Mater Res 18(5):1029-1037. doi: 10.1590/1516-1439.017215
Vasiliev VV, Morozov EV (2001) Mechanics and analysis of composite materials. New York: Elsevier.
anisotropic plates and the experimental one, strain gages to obtain the strains generated on a sandwich laminate specimen submitted to a pure bending load on a 4-point bending test. As a result, the 4 orthotropic mechanical elastic properties of sandwich laminates were estimated: the longitudinal and the transversal Young moduli, the shear modulus, and the Poisson’s ratio. In short, it was proposed a relatively inexpensive and straightforward form of estimating 4 orthotropic mechanical elastic properties of sandwich laminates, which adds a little contribution to the development of this challenging area of composite materials.