Geraldo da Silva e Souza Eliane Gonçalves Gomes * Marília Castelo Magalhães Antonio Flávio Dias Ávila
Secretariat for Management and Strategy
Brazilian Agricultural Research Corporation (Embrapa) Brasília – DF – Brazil
[email protected] [email protected] [email protected] [email protected]
* Corresponding author / autor para quem as correspondências devem ser encaminhadas
Recebido em 09/2005; aceito em 09/2006 após 1 revisão Received September 2005; accepted September 2006 after one revision
Resumo
Neste artigo é medida a eficiência econômica dos centros de pesquisa da Empresa Brasileira de Pesquisa Agropecuária (Embrapa). É usado o modelo DEA BCC, cuja medida de eficiência é modelada como função linear das variáveis contextuais capacidade de geração de receita, intensidade de parcerias, melhoria de processos administrativos, racionalização de custos, tamanho e tipo de centro. O modelo é do tipo painel dinâmico, assume correlação intra-temporal estruturada entre os centros de pesquisa e inter-temporal não estruturada. Para desempatar as unidades eficientes é usado um índice heurístico de eficiência que agrega os resultados de eficiência em relação às fronteiras DEA clássica e invertida. O efeito positivo das parcerias na medida de eficiência, invalida as críticas de que o processo de avaliação prejudica a integração e cooperação entre os centros de pesquisa. A melhoria de processos administrativos é a variável mais importante do ponto de vista da significância estatística das variáveis contextuais. Palavras-chave: análise de envoltória de dados; eficiência econômica; variáveis contextuais.
Abstract
In this paper we measure, with a DEA BCC model, the economic efficiency of Embrapa’s (Brazilian Agricultural Research Corporation) research centers. We model the DEA economic efficiency as a linear function of the contextual variables revenue generation capacity, partnership intensity, improvement of administrative processes, cost rationalization, size and type of research centers. The model used is of the type dynamic panel and assumes a structured correlation matrix intra times and unstructured inter times. In order to better discriminate the efficient units we used a heuristic efficiency score that aggregates the efficiencies in relation to the original and inverted DEA frontiers. Partnerships positive effect in the efficiency scores does not confirm the thoughts that Embrapa’s performance evaluation process discourages the integration and cooperation of its research centers. From the point of view of statistical significance, the improvement of administrative processes is the most important indicator among the contextual variables.
1. Introduction
The assessment of productive efficiency of a research public institution is of fundamental importance for its administration. As pointed out in Souza et al. (1999), in times of competition and of budget restrictions, a research institution needs to know how much is possible to increase its production with quality, without using additional resources. A better management of available resources may be accomplished if managers have at their disposal meaningful quantitative measurements of the production process.
In this context, the Brazilian Agricultural Research Corporation (Embrapa) monitors, since 1996, the production process of its 37 research centers, using a nonparametric DEA (Data Envelopment Analysis) production model, which provides a measure of technical efficiency of production for each research center. For more details see Souza et al. (1997, 1999) and Souza & Ávila (2000).
The economic efficiency proposed here to measure the performance in Embrapa’s production model uses a four dimensional output vector, obtained from 28 indicators of marginal productions, and the total production costs as a single input. The DEA model imposes variable returns to scale and input orientation. This approach differs markedly from the actual use of DEA at Embrapa, which is based on the notion of technical efficiency and uses a single output measure (a weighted average of the four categories relative indexes) and a three dimensional input vector (costs with personnel, operational and capital expenditures), under the assumption of constant returns to scale. The motivation to use a combined measure of output and constant returns to scale is to make units more comparable and to avoid too many ties in the evaluation process, since under variable returns to scales the efficiency measurements are larger. Each unit is compared only with units of approximately the same size. In this context our approach with a four dimensional output is a compromise.
Besides efficiency assessment of production, managers are very much interested in the identification of exogenous covariates or contextual variables that may affect or cause economic efficiency. The identification of these variables is of managerial importance since they serve the purpose to identify management practices leading to efficient units.
This article has as a general objective the study of DEA to measure efficiency of production of Embrapa’s research centers. In this context there are three specific objectives. The first is to propose, as an alternative to the current model, the use of a more general measure of efficiency. This measure uses a multidimensional output, total costs as input and is a Farrel measure of economic efficiency under a technology showing variable returns to scale. The multidimensional output is defined by the grouping of marginal output indicators into four production categories: scientific production; production of technical publications; technology diffusion and image; and development of technologies, products and processes. The evolution of the economic efficiency measurements through time is investigated under the optics of a dynamic panel (Greene, 2002).
original in the context of the use of DEA models in two stages regressions, since it takes into account the correlation among the research units, induced by the calculation method involved in the evaluation process of economic efficiency measurements. Particularly, we are interested in the effect induced on efficiency by an indicator of intensity of partnerships, since criticism has been raised to the use of economic efficiency in the evaluation process of Embrapa, with the argument that the process generates unwanted competition inhibiting collaboration among research centers.
2. Material and Methods
2.1 Production data
The efficiency model in use now by Embrapa, considers a combined measure of output. This is a weighted average of marginal indexes each measuring a particular type of production relative to a pre-specified standard. Typically this normalization is defined, for each year, by the average of a particular variable over all research centers. The use of a joint measure of output is motivated by the fact that the fit of a production frontier assumes homogeneity of the production process, and this hypothesis is not verified strictly in Embrapa. Although all research units produce some amount of all the production variables considered, and use the same inputs, they have different perceptions on the relative importance of each production category. A research center specialized in Biotechnology, for instance, views as more important the category of Scientific Production, while a Product oriented center values, typically, as more important the category of Development of Technologies, Products and Processes. Embrapa tries to solve this homogeneity problem using a variable system of weights. Each research system has its own weights. We notice that such system of weights cannot be specified in an automatic way using DEA, due to the lack of homogeneity of the units involved in the evaluation. Another pertinent problem in this context, and also related to the use of DEA, is that an excessive number of production variables will make all research centers efficient. The definition of a priory system of weights, that serves to the purpose of obtaining an univariate measure of output allowing comparisons among units is a complex task. In Embrapa’s case, the weights were defined as a result of a survey study involving about 500 researchers and all company administrators. Each participant in the survey was asked to express his perception on the importance of a given output variable and category of production on a scale 1 (less important) to 5 (more important). Perceptions were expressed by categories of production and within categories of production. The model used in the analysis of this data is known as the Law of the Categorical Judgments, derived from the Law of Comparative Judgements, proposed by Thurstone (1927). The objective of the analysis is to transform the ordinal scale of individual perceptions in a interval scale representative of the population from which the appraisers’ sample was extracted. The relative importance of each variable can then be determined using estimable differences in a continuous scale. More details on this process may be seen in Souza & Ávila (2000) and Souza (2002). The weights derived from Thurstone’s technique are similar to those generated by the AHP method (Saaty, 1994).
abstracts and articles in proceedings of technical meetings. The category of Production of Technical publications groups the publications produced by the research centers aiming agricultural businesses and producers. Typical in this category are instructions and technical recommendations, which are publications written in a simplified language directed to extensionists and farmers. Such publications contain technical recommendations regarding the use of agricultural production systems. The category of Development of Technologies, Products and Processes groups production indicators related to the effort made by a research unit to make its production available to society in the form of a final product, as the production of new cultivars and varieties of plants, for instance. Finally, the category of Diffusion of Technologies and Image includes variables related both to Embrapa’s effort to make its products known to the public and to market its image.
Besides efficiency measurements, Embrapa’s evaluation model also makes use of other contextual variables (Ávila, 2002). These are: the capacity of obtaining research financing other than government (treasure) resources (RECF), improvement of administrative processes (IAPROC), intensity of partnerships (PART), and rationalization of costs (COSTS). The classification variables of interest are type and size. According to their objectives of research, the centers are classified into Product Oriented (15), Basic Themes (9) and Ecoregional (13) ones. Three sizes are considered (small, medium and large).
In this article, the data for production and contextual variables refer to the years of 2001, 2002 and 2003.
2.2 Methods
DEA has for objective the measurement of efficiency of production of units called Decision-Making Units, the so-called DMUs for short. DEA is an optimization process applied to each DMU aiming the estimation of an efficient frontier (piecewise linear frontier). The estimated frontier is composed by the DMUs, which represent the best production practices in the sample (Pareto efficient units). These units are peers or benchmarks for the inefficient ones. The relative efficiency of a given DMU is defined as the ratio of a weighted sum of outputs by a weighted sum of inputs. The weights are shadow prices of outputs and inputs obtained via a linear programming problem (LPP) that seeks to maximize efficiency (the ratio). of the considered sum of products by the considered sum of necessary inputs to generate them. One of the advantages of a DEA frontier estimation over other competitive production models specifications is that it allows the use of both multiple inputs and multiple outputs in the calculation of a measure of efficiency, with or without the incorporation of subjective perceptions on the part of the investigator.
There are two equivalent formulations of a given DEA model. These are known as the Envelopment and the Multipliers formulations. The primal and the dual of a LPP define them. In a simplified way, it can be said that the Envelopment’s formulation defines a feasible production region and projects each DMU on the frontier of this region. Inefficient DMUs are located below the efficient frontier and the efficient DMUs define the frontier. The Multipliers’ formulation (given above) seeks to maximize, for each DMU, a ratio of a weighted sum of outputs by a weighted sum of inputs. In this formulation, the weights are the LPP’s decision variables and are the most favorable to each DMU.
In (1) and in (2) below we present the DEA BCC versions for the Multipliers and Envelopment formulations, with input orientation. Each DMU k, k=1...n, is a production unit that uses r inputs w , ik i=1...r, to produce s outputs yjk, j=1...s; wio and yjo are the
inputs and outputs of DMU o.
In (1), vi and uj are the weights for inputs and outputs, respectively, and u* is a scale factor (when positive indicates that the DMU operates in a region of decreasing returns to the scale; when negative the DMU operates in a region of increasing returns to scale; when null the DMU operates under constant returns to scale). In (2), θo it is the efficiency of the DMU
under investigation; λk represents the contribution of the DMU k in the calculation of the target of the DMU o.
Intuitively, a DMU is efficient if, in the scale that it operates, it is the best practice in terms of the use of available resources (best virtual output/input ratio).
1
1
1 1
Max
sujeito a
1
0,
, 0, ,
s j jo j r i io i r s
i ik j jk
i j
j i
u y u
v w
v w u y u k
u v j i
u ∗ = = ∗ = = ∗ − = − + − ≤ ∀ ≥ ∀ ∈ ℜ (1) 1 1 1 Min sujeito a
0, 0, 1 0, o n
o io ik k
k n
jo jk k
k n
k k
k
w w i
y y j
As pointed out by Ali (1993), the BCC model considers as efficient a DMU with a (strictly) largest value in one of the output vector components, independently of the input vector, and a DMU with a (strictly) smallest value in one of the components of the input vector, independently of the output vector, since the units showing these conditions don’t have any other units to be compared. DMUs in that situation cannot be considered truly efficient and require further investigation. Ali (1993) also points out that any unit satisfying condition (3) will be efficient, independently of the chosen DEA model.
1,...,
1 1 1 1
max
s r s r
jo io k n jk ik
j i j i
y w = y w
= = = =
= (3)
Typically DEA BCC models will show a relatively large number of efficient units. The literature on the subject discusses several approaches that allow discrimination among efficient units. Angulo Meza & Lins (2002) present a revision of the models available to increase the discrimination in DEA models (and consequently to improve the ranking process). As the authors point out the models can be divided into two groups: those that incorporate a priori information from the decision maker (for instance, DEA models with weights restrictions and models of the Value Efficiency Analysis type), and those that do not use prior information in their specifications (for instance, super-efficiency models, cross-evaluation models and DEA multi-objective models).
Leta et al. (2005) suggest the use of the inverted frontier to help in the discrimination process. The inverted frontier, proposed by Yamada et al. (1994) and Entani et al. (2002), shows a pessimistic evaluation of the DMUs. It is derived taking inputsas outputs and vice-versa, and can have two interpretations: it consists of DMUs with the worst managerial practices and could be called the inefficient frontier, or of DMUs with the best practices according to an opposite point of view (for instance, the price of a certain product is seen as the input for the buyer, which seeks minimization, and as the output for the seller, which seeks maximization). Lins et al. (2005) uses this second interpretation in real estate evaluation.
In Leta et al. (2005), the first interpretation led to the suggestion of a composed index that weighs the two efficiency measures derived from the classic and inverted DEA frontiers. Following their approach the best DMUs must show a reasonable level of efficiency relative to the classical frontier and a poor level of efficiency relative to the inverted frontier. The composed index is a weighted average between the efficiency measurement and one minus the efficiency measurement relative to the inverted frontier.
Pimenta & Soares de Mello (2005) suggest the DEA-Savage model for the calculation of the composed index. A range of optimism coefficients (applied to the classical frontier) defines the weights attributed to the efficiency measurements relative to the classical and inverted frontiers. This allows a sensitivity analysis of the efficiency.
Turning back to the problem of evaluating economic efficiency for Embrapa’s research centers, we consider a production process for which there are n=37 production observations
(
c yk, k)
of units k=1...37, where yk is an output vector 4-dimensionalandk
37 37 37
1 1 1
arg min , , , 1, 1,...,37
o k k o k k o k
k k k
y y c c k
θ θ λ λ θ λ
= = =
= ≥ ≤ = = (4)
If θkt represents the economic efficiency of the research center k in time t (t = 2001, 2002, 2003), we postulate the statistical model (5), where βv and γ they are unknown parameters
and xlt represents the observation in time t of the contextual variable xl.
The logarithmic transformation is motivated by Banker & Natarajan (2005), who use the same transformation in their analyses.
( )
1 0 8(
1)
11
log kt l klt log kt kt, 1...37, 2001, 2002, 2003
l
x k t
θ − β β γ θ − − ε
=
= + + + = = (5)
For l=1...4 the contextual variables are, respectively, RECF, PART, COSTS and IAPROC. Three types of research units are considered: Product, Basic Themes and Ecoregional. Two indicator (dummy) variables are necessary to represent type in (5). These correspond to Basic Themes and Product research centers. With the xl notation they correspond to l=5
and l=6, respectively. The factor Size (levels small, medium and large) of a research center may also be represented by two indicator variables. These are x7 (medium) and x8 (large). The random errors εkt show serial and contemporaneous correlation. If ηt=
(
ε1t,...,ε37t)
isthe error vector of period t, we assume Var
( )
ηt = tt(
(
1−ρ)
I+ρJ ,)
ρ <1, where I represents the identity matrix of order 37 and J is a matrix of ones of order 37. The parameter(
)
1 n 1
ρ > − − is the correlation coefficient between any two the research centers, assumed constant over time. Also, Cov
(
η ηt, b)
=σtbJ, t≠b.The assumption on the error structure above in (5) implies nonlinear parametric restrictions and the model becomes nonlinear. In this context, and given the presence of lagged values of the response variable on the right hand side of the equation, we used instrumental variables and three stage nonlinear least squares (Gallant, 1987) in the estimation process. As instruments we used the contextual variables assumed to be non-associated with the error component.
3. Analyses and Results
3.1 DEA-BCC model
The actual DEA CCR model in use by Embrapa is not applied directly to all research units. The population of DMUs is divided into three groups via multivariate cluster analysis applied to their cost vectors. The DEA analysis is then carried out within groups and this justifies the CCR approach, since units within a group will be homogeneous in size.
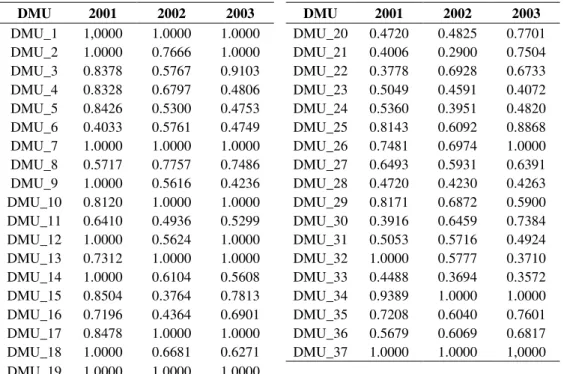
corresponding measure of aggregate output are defined exogenously. Research centers are evaluated jointly. Differences in size are taken into consideration via the BCC restrictions. Table 1 shows economic efficiency under DEA BCC for Embrapa’s research centers for each of the three years under study.
Table 1 – Economic efficiency – DEA BCC and input orientation.
DMU 2001 2002 2003 DMU 2001 2002 2003
DMU_1 1,0000 1.0000 1.0000 DMU_20 0.4720 0.4825 0.7701 DMU_2 1.0000 0.7666 1.0000 DMU_21 0.4006 0.2900 0.7504 DMU_3 0.8378 0.5767 0.9103 DMU_22 0.3778 0.6928 0.6733 DMU_4 0.8328 0.6797 0.4806 DMU_23 0.5049 0.4591 0.4072 DMU_5 0.8426 0.5300 0.4753 DMU_24 0.5360 0.3951 0.4820 DMU_6 0.4033 0.5761 0.4749 DMU_25 0.8143 0.6092 0.8868 DMU_7 1.0000 1.0000 1.0000 DMU_26 0.7481 0.6974 1.0000 DMU_8 0.5717 0.7757 0.7486 DMU_27 0.6493 0.5931 0.6391 DMU_9 1.0000 0.5616 0.4236 DMU_28 0.4720 0.4230 0.4263 DMU_10 0.8120 1.0000 1.0000 DMU_29 0.8171 0.6872 0.5900 DMU_11 0.6410 0.4936 0.5299 DMU_30 0.3916 0.6459 0.7384 DMU_12 1.0000 0.5624 1.0000 DMU_31 0.5053 0.5716 0.4924 DMU_13 0.7312 1.0000 1.0000 DMU_32 1.0000 0.5777 0.3710 DMU_14 1.0000 0.6104 0.5608 DMU_33 0.4488 0.3694 0.3572 DMU_15 0.8504 0.3764 0.7813 DMU_34 0.9389 1.0000 1.0000 DMU_16 0.7196 0.4364 0.6901 DMU_35 0.7208 0.6040 0.7601 DMU_17 0.8478 1.0000 1.0000 DMU_36 0.5679 0.6069 0.6817 DMU_18 1.0000 0.6681 0.6271 DMU_37 1.0000 1.0000 1,0000 DMU_19 1.0000 1.0000 1.0000
As seen in Table 1 there is a large number of efficient units (about 27% of all units in 2001, 22% in 2002 and 30% in 2003). This can be seen in two ways. Firstly, a favorable way, since, in theory, the result indicates that there is a large number of units operating efficiently under variable returns to scale. Secondly, an unfavorable way, since some of the efficient measurements may be spuriously generated by the BCC assumption. Additional analyses are necessary to further discriminate the units.
3.2 Using a Heuristic Index of Efficiency
The composed index minimizing variance is called here Heuristic Index of Efficiency (HIEf), since it is not an efficiency index in the strict sense of the term. It is an index, resulting from
the aggregation of two efficiency measurements. HIEf is defined by the formula
(1 )(1 )
O I
HIEf =aEf + −a −Ef , where EfO and EfI are, respectively, the efficiencies
according to the classical and inverted frontiers. Also,
(
)
(
)
(
)
(
)
2(
)
O O I
O I O I
Var Ef Cov Ef Ef
a
Var Ef Var Ef Cov Ef Ef
+ =
+ + (6)
where Var Ef
(
O)
and Var Ef(
I)
are the variances of EfO and EfI, respectively; and(
O I)
Cov Ef Ef is the covariance between EfO and EfI.
Since Cov Ef Ef
(
O I)
may be negative, the weight a given in (6) may assume negative values, which would destroy the convex combination of EfO and EfI. We expect the value of a tobe positive, since the standard errors of EfO and EfI have similar magnitude. However, if a is negative, one should determine a using a nonlinear programming whose objective function to be minimized is the variance (a quadratic function) subject to the restriction that 0≤ ≤a 1. Table 2 shows HIEF’s for the three time periods under study. The values of a obtained using (6) are 0.648, 0.523, and 0.389 for 2001, 2002 and 2003, respectively. One notices that the discrimination in Table 2 is better than in Table 1.
Table 2 – Values of HIEf – Heuristic Index of Efficiency.
DMU 2001 2002 2003 DMU 2001 2002 2003
3.3 The influence of contextual variables in DEA economic efficiency
To further analyze the efficiency measurements associated with Embrapa’s research centers we now turn to the identification of contextual variables that may affect (cause) economic efficiency, as measured by the DEA BCC model with input orientation. Table 3 displays the estimation results derived from nonlinear three stage least squares. We notice initially that we did not find evidence that β is changing over time.
Table 3 – Three stage nonlinear least square estimation.
Parameter Estimate Standard deviation p-value
ρ -0.001 0.001 0.222
0
β 0.632 0.131 <0.001
1
β -0.165 0.104 0.122
2
β -0.044 0.022 0.055
3
β -0.168 0.146 0.259
4
β -0.141 0.082 0.096
5
β -0.241 0.076 0.004
6
β -0.176 0.066 0.011
7
β 0.130 0.056 0.027
8
β 0.048 0.064 0.459
γ 0.425 0.134 0.003
4. Conclusions
The objectives proposed in this article were reached. We suggested a new measure of production efficiency to evaluate production of the Embrapa’s research system defined by its 37 research centers. The measure of efficiency considered uses a multiple products and total costs and is a Farrel measure of economic efficiency. To further discriminate among efficient units, we used the concept of inverted frontier to generate a composed index with minimum variance.
For the period 2001-2003 we investigated the influence of contextual variables of administrative interest in the efficiency measure, using a dynamic panel data incorporating contemporaneous and serial correlation. We concluded that all contextual variables considered (capacity of own research financing, intensity of partnerships, improvement of administrative processes and rationalization of costs) are positively associated with the economic efficiency. Type and size of a research center also influence economic efficiency. The types Basic Themes and Product are dominant, as well as large and small research centers. In this context we point out the effect of intensity of partnerships has on the economic efficiency measurements. In response to the criticism that the evaluation process would interfere negatively with the willingness of the research centers to cooperate with each other, we showed that higher values of partnership associations are related to larger values of economic efficiency.
The model used in this article was basically classical DEA. The resulting efficiency indexes are objective and show a clear economic interpretation. This approach however may not be the best for managers. We are directing new research to incorporate managerial perceptions into the model using restrictions to the shadow prices generated by the DEA model.
References
(1) Ali, A.I. (1993). Streamlined computation for data envelopment analysis. European Journal of Operational Research, 64, 61-67.
(2) Angulo Meza, L. & Lins, M.P.E. (2002). A review of methods for increasing discrimination in data envelopment analysis. Annals of Operations Research, 116, 225-242.
(3) Ávila, A.F.D. (2002). Avaliação de desempenho das unidades da Embrapa:
metodologia para 2002. Embrapa-SEA, Brasília, Agosto.
(4) Banker, R.D.; Charnes, A. & Cooper, W.W. (1984). Some models for estimating technical scale inefficiencies in data envelopment analysis. Management Science, 30(9), 1078-1092.
(5) Banker, R.D. & Natarajan, R. (2005). Statistical tests based on DEA efficiency scores.
In: Handbook on Data Envelopment Analysis [edited by W.W. Cooper, L.M. Seiford
and J. Zhu], Kluwer International Series, New York, 299-321.
(6) Charnes, A.; Cooper, W.W. & Rhodes, E. (1978). Measuring the efficiency of decision-making units. European Journal of Operational Research, 2, 429-444.
(8) Lins, M.P.E.; Novaes, L.F.L. & Legey, L.F.L. (2005). Real estate value assessment: a double perspective data envelopment analysis. Annals of Operations Research, 138, 79-96.
(9) Gallant, A.R. (1987). Nonlinear Statistical Models. Wiley, New York.
(10) Greene, W.H. (2002). Econometric Analysis. 5ed., Prentice Hall, New York.
(11) Leta, F.R.; Soares de Mello, J.C.C.B.; Gomes, E.G. & Angulo Meza, L. (2005). Métodos de melhora de ordenação em DEA aplicados à avaliação estática de tornos mecânicos. Investigação Operacional, 25(2), 229-242.
(12) Pimenta, H.L.N. & Soares de Mello, J.C.C.B. (2005). Modelo DEA-Savage para análise de eficiência do parque de refino brasileiro. Relatórios de Pesquisa em Engenharia de Produção, 5 (5). Disponível em: http://www.producao.uff.br/rpep/revista-V5-2005.htm. Acesso em: 04 maio 2005.
(13) Saaty, T.L. (1994). The Fundamentals of Decision Making and Priority Theory with the
Analytic Hierarchy Process. RWS Publication, Pittsburgh.
(14) Souza, G.S. (1998). Introdução aos Modelos de Regressão Linear e Não-Linear. Embrapa-SCT, Brasília.
(15) Souza, G.S. (2002). The law of categorical judgement revisited. Brazilian Journal of Probability and Statistics, 16, 123-140.
(16) Souza, G.S.; Alves, E. & Ávila, A.F.D. (1999). Technical efficiency in agricultural research. Scientometrics, 46, 141-160.
(17) Souza, G.S.; Alves, E.; Ávila, A.F.D. & Cruz, E.R. (1997). Produtividade e eficiência relativa de produção em sistemas de produção de pesquisa agropecuária. Revista Brasileira de Economia, 51(3), 281-307.
(18) Souza, G.S. & Ávila, A.F.D. (2000). A psicometria linear da escalagem ordinal: uma aplicação na caracterização da importância relativa de atividades de produção em ciência e tecnologia. Cadernos de Ciência e Tecnologia, 17(3), 11-27.
(19) Thurnstone, L.L. (1927). A law of comparative judgment. Psychological Review, 34, 273-286.
(20) Yamada, Y.; Matui, T. & Sugiyama, M. (1994). New analysis of efficiency based on