neotropical fish:
Pimelodus maculatus
Lacepède, 1803
Santos, HA.
a,b*, Pompeu, PS.
c, Vicentini, GS.
b, and Martinez, CB.
b aDepartamento Acadêmico de Engenharia Civil, Campus II,Centro Federal de Educação Tecnológica de Minas Gerais – CEFET-MG, Av. Amazonas, 7675 Nova Gameleira, CEP 30510-000, Belo Horizonte, MG, Brazil
bCentro de Pesquisas Hidráulicas, Escola de Engenharia, Universidade Federal de Minas Gerais – UFMG, Av. Antônio Carlos, 6627, CEP 31270-901, Belo Horizonte, MG, Brazil
cDepartamento de Biologia, Setor de Ecologia Campus Universitário, Universidade Federal de Lavras – UFLA, CP 3037, CEP 37200-000, Lavras, MG, Brazil
*e-mail: [email protected]
Received October 23, 2006 – Accepted December 19, 2006 – Distributed May 31, 2008 (With 11 figures)
Abstract
The present study used fixed and increasing velocity tests in an experimental apparatus based on Brett’s respirometer to examine prolonged and sustained speeds of the “mandi-amarelo”, Pimelodus maculatus. When comparing the curves of critical speed versus total length between the mandi and the sockeye salmon Oncorhynchus nerka, it is observed that for an equal total length, the mandi presents a greater speed, probably due to water temperature differences. The sustained speed for the species was estimated in 5 lengths per second and the percentage of fatigued fish within time in a certain velocity was established. The data raised for the mandi represents an important contribution to the improve-ment of the handling of the species, providing guidance and criteria for designing several structures, such as fishways, fish screens and guidance systems.
Keywords: critical speed, prolonged speed, fish passages.
Capacidade natatória da espécie neotropical de água doce:
Pimelodus maculatus
Lacepède, 1803
Resumo
No presente estudo, foram utilizados testes de velocidade fixa e progressiva em um aparato experimental baseado no respirômetro de Brett, para examinar as velocidades prolongada e sustentável do mandi-amarelo, Pimelodus maculatus. Quando comparadas as curvas de velocidade crítica versus o comprimento do corpo entre o mandi e o salmão Oncorhynchus nerka, é observado que, para um mesmo comprimento, o mandi apresenta velocidades superiores, pro-vavelmente devido a diferenças na temperatura da água. Foram estimadas a velocidade sustentável da espécie em cinco comprimentos por segundo e a porcentagem de peixes fatigados ao longo do tempo em uma dada velocidade estimada. Os dados obtidos para o mandi representam uma importante contribuição para o manejo da espécie, provendo critérios de projeto para a construção de estruturas como mecanismos de transposição e sistemas de proteção e orientação.
Palavras-chave: velocidade crítica, velocidade prolongada, passagem de peixes.
1. Introduction
Issues involving aquatic life, particularly fish, fish migrations and fish habitats are playing a key role in decisions affecting existing or new works in rivers, in-cluding hydroelectric plants, water supply, river restora-tion and dam removal (Katopodis, 2005). Healthy fish populations depend on habitat connectivity, on suitable habitat features which differ between species and life stages, and on river flow regimes which provide sedi-ment, ground water and nutrient circulation that sustain ecological integrity (Katopodis, 2005). In this context, studies on swimming performance are fundamental,
pro-viding guidance and criteria for maintenance of the con-nectivity in aquatic systems.
tubes are located before and after the central part, reduc-ing the interference of pumps and of the apparatus exit.
To determine the water flow, the apparatus has an electromagnetic flow meter, and the flow generated by the pumps is changed with two frequency converters.
All individuals tested were collected in the São Franciso River in Três Marias, Minas Gerais State, and until the beginning of the tests, they had been observed for at least 24 hours in a maintenance system with water temperature ranging from 27 to 29 °C.
Each fish had been maintained in the laboratory for no more than 7 days before it was tested, so that it did not lose any of its swimming capacity.
After testing, the fishes were returned to the river, in the same location where they had been caught.
The critical speed tests, or increasing velocity tests, were performed based on the experimental procedure described by Brett (1964). A total of 24 individuals were tested between October of 2004 and February of 2005, so that it would range different classes of size (Figure 2).
After the fish’s adaptation to the water temperature of the apparatus and its introduction into the test sec-tion, the test began with one of the pumps in low rota-tion. After a period of 10 minutes, the water speed was increased in steps of 5 cm/s ($V), each lasting 5 minutes ($t). These increment values were based on the possi-bilities of speed control permitted by the apparatus and the total time of the test. After repeating speed increases the fish would no longer resist the flow, due to fatigue, which was considered as the moment when the fish could no longer stay in the test section, after several bursts of swimming activity. The time which the fish swam at such speed (Vmax) until its fatigue was measured.
The values of critical speed were calculated, based on this formula:
Vcrit V t
t V
Vma s
V V V
V x max
$ $ (1)
where Vmax is the maximum speed,$V the speed incre-ment,$t the time interval and tmax the time during which the fish swam in the last time interval.
Swimming performance of fish can fall into one of three general categories: sustained, prolonged, or burst. Sustained swimming occurs at relatively slow speeds and utilizes primarily red muscle fibers which are fueled by energy derived from aerobic metabolism (Beamish, 1978). This allows fish to maintain sustained swim-ming velocities for long periods (at least 200 minutes) without fatiguing (Beamish, 1978). Burst swimming involves white muscle fibers which utilize energy from an anaerobic process to attain relatively high speeds for
15-20 seconds (Beamish, 1978). Prolonged swimming covers a spectrum of velocities between sustained and burst, using both red (aerobic) and white (anaerobic) muscle fibers.
Prolonged speed is the speed more often measured in the laboratory and its main subcategory is the critical speed, which was first defined and employed by Brett (1964), and corresponds to the maximum speed (Vmax) a fish could maintain in a flow whose speed is increased ($V) in a pre-determined time interval ($t). Since its proposition, critical speed has been intensely researched (Hammer, 1995), allowing powerful comparisons be-tween the swimming capacity of all sorts of species.
The present study used fixed and increasing veloc-ity tests to examine prolonged and sustained speeds of the mandi-amarelo,Pimelodus maculatus,a species with distribution and great abundance in the Prata and São Francisco River basins, and great importance in com-mercial fishing (Welcomme, 1985). The objective was to compare the performance of the mandi-amarelo with the sockeye salmon,Oncorhynchus nerka(Walbaum, 1792), whose speeds are utilized in the dimensioning of fish-ways in South America.
2. Materials and Methods
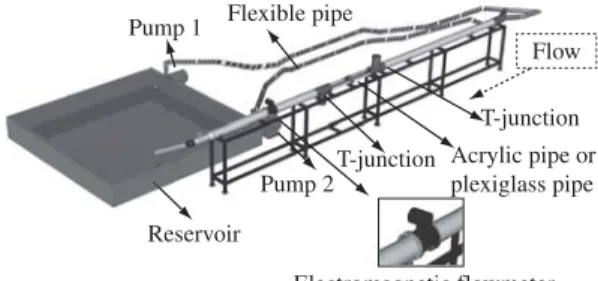
Based on Brett’s respirometer, an experimental ap-paratus was constructed for fish tests. It is basically a wa-ter tunnel where fish are forced to swim against current water that is generated by centrifugal pumps (Figure 1).
The main tube is formed by 3 parts: two parts made of PVC and the central part, where the fish is confined, made of acrylic. There, the fish were introduced into a T-junction with an upward positioned intake and removed from a T-junction with a downward positioned outtake. Fish are confined in the central part by two screens. PVC
Pump 1 Flexible pipe
Reservoir
Pump 2T-junction
T-junction
Electromagnetic flowmeter Acrylic pipe or plexiglass pipe Flow
Figure 1.Design of experimental apparatus.
0.204 0.218 0.232 0.246 0.260 Total length (m)
0.0 1.0 2.0 3.0 4.0 5.0 6.0 7.0 8.0 9.0
Number of indi
viduals
During each test performed, the parameters concern-ing the water quality such as dissolved oxygen, tem-perature and pH, were monitored. After the tests, each fish was weighed (g) and measured (total and standard lengths, maximum height and maximum width – cm).
The solid blocking effect that occurs due to the ob-struction of the flow by the fish’s body in the section test, was corrected for each test according to the equation pro-posed by Pope and Hae (1966):
V V K
C
corrected measured 3 1T3 2(/fish volume) (2)
Volume = 0.45e2L (3)
where K3 is the shape factor, T1the factor considering the layout of the test section (circular sections T1= 0.8), C the cross-sectional area of the tunnel, e the maximum width of the fish (the mean between the maximum width and height) and L the length of the fish.
The relations between the critical speed with the fish length and weight were tested through linear regressions, whose the variables transformed into its natural loga-rithm. The same procedure was adopted for the relations between the prolonged speed and the fatigue time as well as the fatigue time and the percentage of fatigued fish. Statistical significance was indicated by P-values of 0.05 or less. The coefficient of determination was examined and the accepted models have the highest coefficient. All analyses were performed using the Statistica software.
3. Results and Discussion
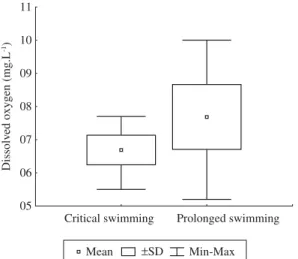
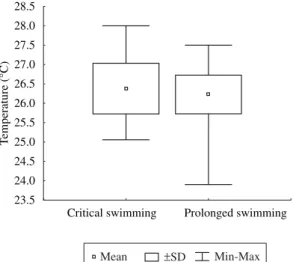
In all tests performed, a satisfactory maintenance of water quality in the experimental apparatus was ob-served, with dissolved oxygen concentrations greater than 5 mg.L–1 (Figure 4), temperatures ranging from 24 o 28 °C (Figure 5), an interval which was observed in the São Francisco River (Sato and Godinho, 2003), and pH ranging from 6 to 9 (Figure 6).
The prolonged speed tests, or fixed velocity tests, were based on the methodology utilized by Brett (1967) and Jones et al. (1974). Percentage values of the esti-mated critical speed (1.47 m/s) for a individual with total length of 23 cm (Table 1) were chosen for these tests. This size was selected due to its high frequency in shoals on the São Francisco River and because this value is close to the size of the specie’s first maturation (19 cm) (Sato and Cardoso, 1988).
A total of 32 individuals were tested between April and May of 2005, the sizes of which were approximately 23 cm (Figure 3).
Each fish was initially submitted to a flow of 0.20 m/s during 10 minutes. Following this, a gradual increase was carried out until the desired speed, at a maximum of 12 minutes.
From this time, a stop watch was started in order to measure the fatigue time, in a test with a maximum dura-tion of 200 minutes. This swimming time was adopted because it is considered the limit between prolonged speed and sustained speed (Beamish, 1978).
In order to eliminate the influence of fish size on the fatigue time, for each evaluated individual the test speed was divided by the fish length (length/s).
Table 1. Utilized values of prolonged speed.
Prolonged Speed in percentage values of Critical Speed (%)
Prolonged Speed (m/s)
61 0.90
68 1.00
75 1.10
81 1.20
88 1.30
95 1.40
102 1.50
108 1.60
0.22 0.23 0.25 0.27 0.29 Total length (m)
0 2 4 6 8 10 12 14 16 18
Number of in
viduals
Figure 3. Number of tested fish per total length classes for prolonged speed determination.
Critical swimming Prolonged swimming 05
06 07 08 09 10 11
Dissolv
ed oxygen (mg.L
-1)
Mean pSD Min-Max
the tested length range, the difference in speed between the two species had a magnitude of 30% (Table 3). This is even more surprising if we consider the fact that the mandi is a bottom swimmer, while the salmon is a water column swimmer, that faces relatively lower flow speeds in nature.
The acquisition of critical velocity values is condi-tioned by various factors, among the most important are the experimental procedures and the test temperature. According to Hammer (1995), this conditioning may cause the comparisons between critical speeds of other species susceptible to errors.
Among the experimental procedures, speed increments ($V) and time increments ($t) influence significantly in the critical speed value obtained (Farlinger and Beamish, 1977). Table 4 shows the values of critical speed that would be obtained for the species Micropterus salmoides (Lacepède, 1802) (Farlinger and Beamish, 1977) when the experimental increments utilized were equal to the ones adopted in the tests of the mandi and the sockeye salmon.
Analyzing only the influence of the experimental procedures, a greater speed in salmon was expected. This way, the differences among the methodologies employed cannot be pointed to as being responsible for the swim-ming capacity observed.
Significant relations were observed between the critical speed and the size of fishes tested. The total length was the variable presenting the greatest explica-tive power (Figure 7), followed by the standard length (p=0.006, r2=0.30) and weight (p = 0.011,r2 = 0.26). The strongest relation between the critical speed devel-oped and the total length reflects the importance of the caudal fin, one of the propulsion elements in fish, which present locomotion patterns of the sub-carangiformes type (Webb, 1994), such as the case of the mandi.
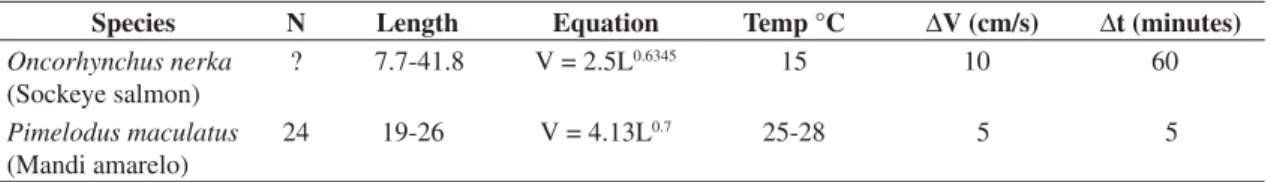
When comparing the curves of critical speed versus total length between the mandi and the sockeye salmon Oncorhynchus nerka, it is observed that for an equal total length, the mandi presents superior critical speed (Figure 8). Table 2 presents the experimetnal conditions in which the critical speed curves were obtained for these two species, as well as the referred equations. For
Critical swimming Prolonged swimming 23.5
24.0 24.5 25.0 25.5 26.0 26.5 27.0 27.5 28.0 28.5
Temperature (°C)
Mean pSD Min-Max
Critical swimming Prolonged swimming 6.8
7.0 7.2 7.4 7.6 7.8 8.0 8.2 8.4
pH
M
ean pSD Min-Max
2.90 2.95 3.00 3.05 3.10 3.15 3.20 3.25 3.30 ln (Total length)
4.70 4.75 4.80 4.85 4.90 4.95 5.00 5.05 5.10 5.15 5.20
ln (Critical speed)
R2 = 0.45
p 0.001 y = 2.8 + 0.7 x
Figure 5. Values of temperature observed during the critical and prolonged speed tests.
Figure 6. Values of pH observed during the critical and pro-longed speed tests.
0.00 0.20 0.40 0.60 0.80 1.00 1.20 Total length (m)
0.0 0.5 1.0 1.5 2.0 2.5 3.0 3.5
Critical speed (m/s)
Oncorhynchus nerka Pimelodus maculatus
Vcrit = 2.5 * L0.6345
Vcrit = 4.13 * L0.7
Figure 7. Ln (Critical speed) x Ln (Total length).
Temperature has been considered the main environ-mental factor related to the swimming capacity of fish (Videler, 1993). In a general way, a decrease of approxi-mately 10 °C in the water temperature, promotes a de-crease ranging from 24 to 37% in the swimming capacity (Table 5). Therefore, considering the fact that the mandi swims in waters 10 °C warmer than the ones in which salmon does, the difference of 30% between the salmon and the mandi’s critical speeds can be explained by only considering this difference in temperature.
Even though critical velocity is a powerful tool for comparing swimming capacity among the species (Hammer, 1995), its employment is limited concerning the dimensioning of fishways, since this speed is low-er than the speed developed in open channels (Peake, 2004). Besides, studies have shown that the methods used to determine critical speed, in particular the time and the speed increments, greatly affect measurements of maximum endurance (Farlinger and Beamish, 1977). At the end of step tests, the fishes swim rapidly and prob-ably anaerobically, whereas during endurance tests, they swim relatively slowly and most of them probably swim aerobically (Kolok, 1992). Consequently, step tests tend to underestimate the endurance of fishes by pre-exhaust-ing them to anaerobic levels.
Endurance tests provide a more accurate measure of a fish’s ability to swim for a length of time at a given speed (Kolok, 1992). Thus, for the dimensioning of fish passage mechanisms, it is more usual to utilize prolonged speed (Katopodis, 2005), which allows us to obtain the specific information on how long (endurance time) or how far (swimming distance) a particular fish can swim against a given water velocity (Katopodis, 1992).
In the case of mandi, the relations between the developed speed and fatigue time are presented in Figures 9 and 10, which correspond to fatigue time per speed class, and to the prolonged speed per time class respectively.
The limit between the speeds in sustained mode and prolonged mode is very slight, considering the fact that sustained speeds are the ones maintained for a period of time greater than 200 minutes (Beamish, 1978). As swimming speed decreases within the prolonged enve-lope, time to fatigue increases and approaches a value of approximately 200 minutes (Beamish, 1978). If speed is further reduced, a shift to sustained swimming occurs. Thus, on a typical endurance curve, the point of inflection between sustained and prolonged modes corresponds to a fatigue time of exactly 200 minutes. In spite of this, our results indicate that, for the mandi, this inflection occurs at a value near 5.0 lengths per seconds (Figure 9). For the tested species, speeds between 5 and 6.5 lengths per sec-ond would correspsec-ond to the prolonged mode, whereas velocities lower than 5 lengths per second would cor-respond to the sustained mode. Thus, for an individual with size close to the first maturation (19 cm), these values would correspond to speeds lower than 0.95 m/s and between 0.95 and 1.23 m/s for sustained speed and prolonged speed, respectively.
For each speed class, it was also possible to evaluate the percentage of fatigued fish within time (Figure 11). For speeds of 5.1, 6.0 and 6.8 lengths per second, 50% of the fish fatigued after 84, 32 and 0.7 minutes respectively.
As rivers are increasingly altered by hydroelectric facilities, fishways have been installed to allow volition-al movement of juvenile and adult fish. If a passage is not facilitated, they may congregate below obstructions in large numbers. The concentration of mandi shoals downstream of hydroelectric dams has caused concern in Brazil, especially in the Paraná River basin, since the killing of fish due to the intake of thousand of individuals inside the turbines has became frequent. The swimming behavior of mandi, the locomotion of which occurs pref-erentially on the river bottom, and its higher swimming Table 2. Experimental conditions of the critical speed curves of the mandi and the salmon.
Species N Length Equation Temp °C $V (cm/s) $t (minutes)
Oncorhynchus nerka (Sockeye salmon)
? 7.7-41.8 V = 2.5L0.6345 15 10 60
Pimelodus maculatus (Mandi amarelo)
24 19-26 V = 4.13L0.7 25-28 5 5
Table 3. Absolute values of the mandi’s and the salmon’s critical speed.
Species Vcrit (m/s)
Length 19 cm
Vcrit (m/s) Length 26 cm
Mandi 1.291 1.61
Sockeye salmon 0.872 1.06
Vcrit Vcrit
Vcrit
salmon mandi
salmon
(%) 32.5 33.8
Table 4. Critical speed of the Micropterus salmoides.
$V (cm/s) $t (minutes) Vcrit (m/s)
5 5 0.499
overcoming in number large-sized migrators species such as the dourado (Salminusspp.) and the curimatã (Prochilodus spp.) (Fernandez, et al., 2004; Vono et al., 2004; Bizzoto, 2006). In these cases, the continuous presence of shoals downstream from the dam indicates the difficulties in attracting all shoals towards the fish-way, or the necessity of installation of new structures which would support the large number of migrating fish.
In this context, the data raised for the mandi repre-sents an important contribution for the handling of the species, adding to the current “Ichthyomechanical Data Base”, which provides guidance and criteria for design-ing several structures, such as fishways, fish screens, guidance systems and assists with estimating the range of swimming performance abilities for several fish spe-cies and sizes (Katopodis, 2005). It’s also important to highlight the importance of knowledge of the swimming capacity of several target species for the dimensioning of a fishway, a number which on some Brazilian rivers can be more than ten, with different swimming behaviors. Particularly important will be the collecting of swim-ming capacity data for species of Characiformes fish, water column swimmers which have great importance for fishing in the South American continent (Welcomme, 1985).
Acknowledgements –– We are grateful to CEMIG for the logistics and financial support. Special thanks to César Augusto Table 5. Influence of temperature in the critcal speed of five fish species.
Species Situation 1 Situation 2 $T
(°C)
(%) of variation in
speed
Author Temp.
(°C)
Speed (m/s)
Temp. (°C)
Speed. (m/s)
Oncorhynchus nerka 15 4.12* 5 3.26* 10 29.8 Brett (1964)
Salvelinus namaycush 17.5 0.53 8 0.35 9.5 35.2 Gibson and Fry (1953)
Oncorhynchus kisutch 23 7.5* 13 5.7* 10 24.0 Glova and McInerney (1977)
Perca flavescens 20 0.33 10 0.245 10 25.8 Otto and Rice (1974)
3.5 4.0 4.5 5.0 5.5 6.0 6.5 7.0 Speed (length/s)
–40 –20 0 20 40 60 80 100 120 140 160 180 200 220
T
ime to f
adigue (minutes)
Mean pSD Min-Max
Mean = 6.0982-0.0728*x
–2 0 2 4 6 8 10 12 14 16 18 20 22 24 Fatigue time /10 (minutes/10) 3.5
4.0 4.5 5.0 5.5 6.0 6.5 7.0 7.5
Prolonged speed (l/s)
F(12.19) = 4.3711 p = 0.002
Mean pSD Min-Max
0.0 0.2 0.4 0.6 0.8 1.0 Percent fatigued
0 20 40 60 80 100 120 140 160 180 200 220
T
ime to f
atigue (minutes)
R2 = 0.999
p 0.001 y = –30.6 + 229.3 x
R2 = 0.60
p = 0.025
y = –50.6 + 166.6 x
R2 = 0.92
p = 0.011 y = –0.5 + 2.3 x 5.1p 0.3 (l/s)
6.0p 0.4 (l/s) 6.8p 0.3 (l/s)
y = –50.6 + 166.6 x
y = –50.6 + 166.6 x
Figure 9. Time to fatigue per speed class (lengths/s) second for mandi Pimelodus maculatus.
Figure 10. Prolonged speed x Fatigue time.
Figure 11. Percentage of mandis fatigued within time for three different speed classes.
performance when compared with temperate region fishes, certainly contributes to these fatal events for the fish. However, the construction of fishways which are ef-ficient can be pointed as one of the possible solutions for this problem.
KATOPODIS, C., 1992. Introduction to Fishway Design. Fisheries and Oceans Canada, Winnpeg. 68 p.
-, 2005. Developing a toolkit for fish passage, ecological flow management and fish habitat works. Journal of Hydraulic Research, vol. 43, no. 5, p. 451-467.
KOLOK, A. S., 1992. The swimming performance of individual largemouth bass (Micropterus salmoides) are repeatable. Journal of Experimental Biology, vol. 170, no. 1, p. 265-270. PEAKE, S. and FARRELL, AP., 2004. Locomotory behaviour and post-exercise physiology in relation to swimming speed, gait transition and metabolism in free-swimming smallmouth bass (Micropterus dolomieu). The Journal of Experimental Biology, vol. 207, no. 9, p. 1563-1575.
HAE-JR, WHJ. and POPE, A., 1966. Low-Speed Wind Tunnel Testing. 2 ed. New York: John Wiley and Sons. 534p.
QUIRÓS, R., 1989. Structures assisting the migrations of non-salmonid fish: Lation America. FAO Copescal Technical Document, vol. 756, no. 5, 41 p.
REIS, RE., KULLANDER, SO. and FERRARIS-Jr., CJ., 2003, Check list f the freshwater fishes of South and Central America. Porto Alegre: EDIPUCRS. 729 p.
SATO, Y. and CARDOSO, EL., 1988. Reprodução induzida do mandi-amarelo (Pimelodus maculatus). In Coletânea de resumos dos encontros da Associação Mineira de Aqüicultura. Brasília: CODEVASF. 137 p.
SATO, Y. and GODINHO, HP., 2003. Migratory fishes of the São Francisco River. In CAROLSFELD, J., HARVEY, B., ROSS, C. and BAER, A., Migratory fishes of South America. Victoria: World Fisheries Trust. 371 p.
VIDELER, JJ., 1993. Fish swimming. Londres: Chapman and Hall. 160 p.
VONO, V., BIZZOTTO, PM., GODINHO, HP., GODINHO, AL. and KYNARD, B., 2004. Fish passage at the Igarapava Fish Ladder, River Grande, Brazil. In International Congress on the Biology of Fish Tropical Hotel Resort, Manaus Brazil. 5 p. WEBB, PW., 1994. The biology of fish swimming. In MADDOCK, L., BONE, Q. and RAYNER, JMV (orgs). Mechanics and physiology of animal swimming. Cambridge: Harvard University Press. 250 p.
WELCOMME, RL., 1985. River fisheries. FAO Fish. Tech. Pap., no. 262, p. 330 p.
Muniz Toledo and Lívia Duarte Ventura Melo, students who helped us on the experimental tests; Geraldo Garcia, Vicente Pimenta and Paulo Roberto, workers who helped us on the construction of experimental apparatus.
References
BEACH, MH., 1984. Fish pass design-criteria for the design and approval of fish passes and other structures to facilitate the passage of migratory. Ministry of Agriculture, Fisheries and Food - Directorate of Fisheries Research, no. 78, p. 1-46. BEAMISH, FWH., 1978. Swimming capacity. In HOAR, WS., RANDALL, DJ., Fish Physiology. 1. ed. Londres: Academic Press. 576 p.
BIZOTTO, PM., 2006. Trânsito de peixes na escada da UHE-Igarapava, Rio Grande, Alto Paraná. (Dissertação de Mestrado) – Pós-graduação em Zoologia de Vertebrados da PUC Minas, Belo Horizonte, Brasil. p. 52. .
BRETT, JR., 1964. The respiratory metabolism and swimming performance of young Sockeye Salmon. Journal of the Fisheries Research Board of Canadá, vol. 21, no. 5, p. 1183-1226. -, 1967. Swimming performance of Sockeye Salmon (Oncorhynchus nerka) in relation to fatigue time and temperature. Journal of the Fisheries Research Board of Canada, vol. 21, no. 8, p. 1731-1741.
CLAY, CH., 1995. Design of fishways and other fish facilities. Boca Raton: CRC Press. 248 p.
FARLINGER, S. and BEAMISH, FWH., 1977. Effects of time and velocity increments on the critical swimming speed of Largemouth Bass (Micropterus salmoides). Transaction American Fisheries Society, vol. 106, no. 5, p. 436-439. FERNANDEZ, DR., AGOSTINHO, AA. and BINI, LM., 2004. Selection of an experimental fish ladder located at the dam of the Itaipu Binacional, Paraná river, Brazil. Brazilian Archives of Biology and Technology, vol. 47, no. 4, p. 579-586.
HAMMER, C., 1995. Fatigue and exercise tests with fish. Comparative Biochemistry and Physiology, vol. 112A, no. 1, p. 1-20.