www.atmos-chem-phys.net/12/6953/2012/ doi:10.5194/acp-12-6953-2012
© Author(s) 2012. CC Attribution 3.0 License.
Chemistry
and Physics
Aerosol optical depth over the Arctic: a comparison of
ECHAM-HAM and TM5 with ground-based, satellite and
reanalysis data
J. von Hardenberg1, L. Vozella1,*, C. Tomasi2, V. Vitale2, A. Lupi2, M. Mazzola2, T. P. C. van Noije3, A. Strunk3, and A. Provenzale1
1Institute of Atmospheric Sciences and Climate – CNR, Turin, Italy 2Institute of Atmospheric Sciences and Climate – CNR, Bologna, Italy 3Royal Netherlands Meteorological Institute, de Bilt, The Netherlands
*now at: Dipartimento di Fisica Generale, Universit`a degli Studi di Torino, Turin, Italy
Correspondence to:J. von Hardenberg ([email protected])
Received: 11 January 2012 – Published in Atmos. Chem. Phys. Discuss.: 28 March 2012 Revised: 13 July 2012 – Accepted: 21 July 2012 – Published: 2 August 2012
Abstract. We compare ground-based measurements of
aerosol optical depth and ˚Angstr¨om parameter at six Arc-tic stations in the period 2001–2006 with the results from two global aerosol dynamics and transport models, ECHAM-HAM and TM5. Satellite measurements from MODIS and the MACC reanalysis product are used to examine the spa-tial distribution and the seasonality of these parameters and to compare them with model results. We find that both mod-els provide a good reproduction of the ˚Angstr¨om parameter but significantly underestimate the observed AOD values. We also explore the effects of changes in emissions, model reso-lution and the parametrization of wet scavenging.
1 Introduction
The Arctic is extremely vulnerable to past and future cli-mate change, through complex interactions which can lead to severe regional impacts on the local hydrology, cryosphere and ecosystems, and to feedbacks on the global climate sys-tem (IPCC AR4, 2007). Significant changes have already oc-curred during recent decades, involving loss of sea-ice and snow-cover (e.g., Serreze et al., 2007) and affecting other important components of the environment (e.g., Post et al., 2009; Richter-Menge and Overland, 2011, and references therein). Anthropogenic and natural atmospheric aerosols
play a crucial role in these processes. While concentrations in the Arctic are low on average, they reach a maximum in spring, forming the so-called Arctic haze, composed mainly of sulfates, particulate organic matter, black carbon and dust, and believed to be mainly anthropogenic (Shaw, 1995; Quinn et al., 2007). The direct climatic effect of aerosols on the ra-diative balance of the atmosphere, through absorption and scattering of incoming short-wave radiation, is particularly significant in the polar areas, because of the high surface albedo due to snow and ice, leading to atmospheric warm-ing and reduction of the solar radiation reachwarm-ing the sur-face. Indirect effects linked with cloud droplet formation are also expected to be important in the Arctic owing to the low aerosol number concentrations in these areas (Law and Stohl, 2007). The deposition of carbonaceous particles on snow re-duces the surface albedo, leading to changes in snow tem-perature and structure, modifications in seasonal snow melt-ing and agmelt-ing, sea ice thinnmelt-ing and glacier reduction (Flan-ner et al., 2009). On a global scale these processes have been recognized to contribute significantly to the climatic forcing of these aerosols (Holland and Bitz, 2003; Hansen and Nazarenko, 2004; Flanner et al., 2007; Ramanathan and Carmichael, 2008).
processes leads to a difficult identification of the transport pathways, which has advanced only recently (see, e.g., Koch and Hansen, 2005; Stohl, 2006; Shindell et al., 2008; Hird-man et al., 2010a,b; Huang et al., 2010; Bourgeois and Bey, 2011).
Global atmospheric and aerosol models are important tools for studying climatic feedbacks and for estimating their impact on the climate system. They also provide boundary conditions for higher resolution regional models. In both cases, a reasonable representation of the concentration and optical properties of aerosols over the Arctic is required. However, the verification of these models has been per-formed mainly on the global scale, focussing at low and mid latitudes, and their skill in the Arctic is still largely unex-plored. Aerosol concentration measurements in the Arctic are sparse, and the main source of data for model verification is provided by measurements of atmospheric optical proper-ties collected by a network of a small number of measuring stations and by satellite observations.
In this work we compare the aerosol optical properties as modeled by two state-of-the-art aerosol models with ground-based station measurements in the Arctic. We consider the at-mospheric aerosol transport and chemistry model TM5 (Krol et al., 2005) and the global climate model ECHAM5 (Roeck-ner et al., 2003), which has been shown to perform well in Arctic areas (Walsh et al., 2008), coupled with the aerosol transport and dynamics module HAM (Stier et al., 2005). A comprehensive comparison in terms of aerosol burdens and optical properties on a global scale with other models has been performed in the framework of the aerosol model inter-comparison initiative AeroCom (Textor et al., 2006; Kinne et al., 2006). A comparison focused on the Arctic has been reported in Shindell et al. (2008). Here we compare mod-eled aerosol optical depths and ˚Angstr¨om coefficients with ground-based measurements (Tomasi et al., 2007), analyzing the role of different aerosol components. In order to compare spatial distributions of optical depth, we also consider remote sensing data from the MODIS satellites and reconstructed fields from the recent reanalysis project MACC. We explore the sensitivity of modeled Arctic aerosol optical depths to different emission datasets and model resolutions, consider-ing also a simple change in the parametrization of wet scav-enging for HAM which has been recently suggested (Bour-geois and Bey, 2011).
In the following, Sect. 2 provides information on the available station, satellite and reanalysis data and describes the ECHAM-HAM and TM5 models. In Sect. 3 we report and discuss the comparison between observed and modeled aerosol optical properties. Concluding remarks are provided in Sect. 4.
0˚
60˚
120˚ 180˚
−120˚
−60˚
0˚
60˚
120˚ 180˚
−120˚
−60˚
Alert Alert
Summit Summit
Barrow Barrow
Ny Alesund Ny Alesund
Alomar Alomar
Sodankyla Sodankyla
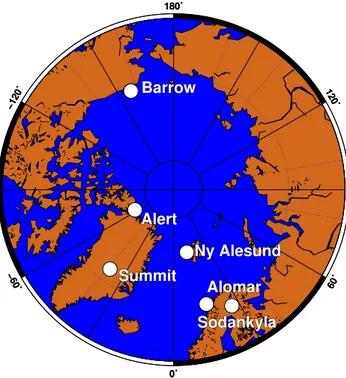
Fig. 1.Location of the six measurements stations considered in this work.
2 Models and data
2.1 Ground-based measurements
We focus on long timeseries of sun photometer measure-ments of the daily mean values of AOD (500 nm) collected by groups participating in the POLAR-AOD programme (Aerosols Optical Depth in Polar regions; see Tomasi et al. (2007) and http://polaraod.isti.cnr.it:8080/Polar/index.jsp) at six Arctic sites, in the period 2001–2006 (Fig. 1). The mea-surement sites and periods which are available are: Bar-row (Alaska, 71◦19′N, 156◦36′W) from 2002/2 to 2005/10, Alert (Canada, 82◦28′N, 62◦30′W) from 2004/8 to 2006/5, Summit (Greenland, 72◦20′N, 38◦45′W) from 2001/3 to 2005/7, Ny ˚Alesund (Norway, 78◦58′N, 11◦54′E) from 1994/3 to 2006/4 (used from 2001 to 2006 in this work), ALOMAR (Norway, 69◦17′N, 16◦00′E) from 2002/5 to 2006/4 and Sodankyl¨a (Finland, 67◦22′N, 26◦38′E) from 2004/5 to 2006/4. The average errors on daily AOD mea-surements at these sites due to instrumental characteristics, calibration errors, and atmospheric corrections for Rayleigh scattering and gaseous absorption, range from 0.018 (Sum-mit) to 0.035 (Barrow). The ˚Angstr¨om turbidity parameter
α was derived by fitting a power law to spectra of AOD
the available ˚Angstr¨om coefficients (the resulting values are lower by about 10 % on average).
2.2 Satellite measurements and reanalysis
Satellite observations of AOD and ˚Angstr¨om parameter are provided by the Moderate Resolution Imaging Spectrora-diometer (MODIS) aboard the Terra and Aqua satellites. Specifically the Aerosol Cloud Water Vapor Ozone Daily L3 Global 1Deg CMG collection products were used. In this work we use data starting in 2001 (Terra) and in July 2002 (Aqua). ˚Angstr¨om parameters are based on AODs at 470 nm and 660 nm over the land and 550 nm and 865 nm over the ocean.
We also consider an aerosol reanalysis product provided by the MACC (Monitoring Atmospheric Composition and Climate) project (Benedetti et al., 2009), which uses the ECMWF IFS cycle 36R1 model with a prognostic aerosol scheme at resolution T255L60, assimilating MODIS AOD observations. Aerosol reanalysis data are available starting from 1 January 2003. To our knowledge a complete valida-tion of the MACC reanalysis product in the Arctic is still missing. In this work we treat the MACC reanalysis as an ad-ditional source of spatially extended AOD observations and we use it as an ‘interpolator’ to provide reference data also in months when satellite observations at high latitudes are scarce.
2.3 ECHAM5-HAM and emissions
The ECHAM5-HAM model couples the global climate model ECHAM5 (Roeckner et al., 2003) with the HAM module (Hamburg Aerosol Module; Stier et al. (2005); Lohmann and Hoose (2009)), which models the dynamics, the microphysics and the transport of the main atmospheric aerosols and their radiative feedbacks. In particular HAM contains the microphysical core M7 (Vignati et al., 2004), based on the representation of particle distributions as the su-perposition of log-normal modes peaked at different particle size classes, and reproduces the main aerosol emission, sedi-mentation and wet and dry scavenging processes. The aerosol compounds included are sulfates, black carbon, organic mat-ter, sea salt and mineral dust. The emissions of dust, sea salt and oceanic dimethyl sulfide (DMS) are computed on-line, while other natural and anthropogenic emissions are pre-scribed. Secondary Organic Aerosols (SOA) emissions are prescribed monthly and added to Particulate Organic Matter emissions, as described in Stier et al. (2005) (19 Tg C yr−1
globally). The main optical and microphysical properties of the aerosols, such as optical depth, and their number and mass concentrations are simulated by the model. In this study we set the spatial resolution to T42 in spectral space (corre-sponding to a resolution of about 2.8◦×2.8◦on a Gaussian
grid). The vertical resolution is set to 19 vertical levels from the surface up to 10 hPa.
We integrate the ECHAM-HAM model using a ”nudg-ing” technique to force the model to stay close to the dynamical wind fields provided by the ECMWF ERA-Interim database (Dee et al., 2011) in the period 2000-2006. The nudging fields were prepared using the IN-TERA package (Ingo Kirchner, http://wekuw.met.fu-berlin. de/∼IngoKirchner/nudging/nudging/). The initial year is used for spinup, and we consider model results in the period 2001–2006. Since transport processes play an important role in determining the concentration of Arctic aerosols (Shindell et al., 2008), nudging was used in order to allow the model runs to reproduce as close as possible the main tropospheric winds in the period of interest and to allow a direct compari-son with observed data over a limited range of years.
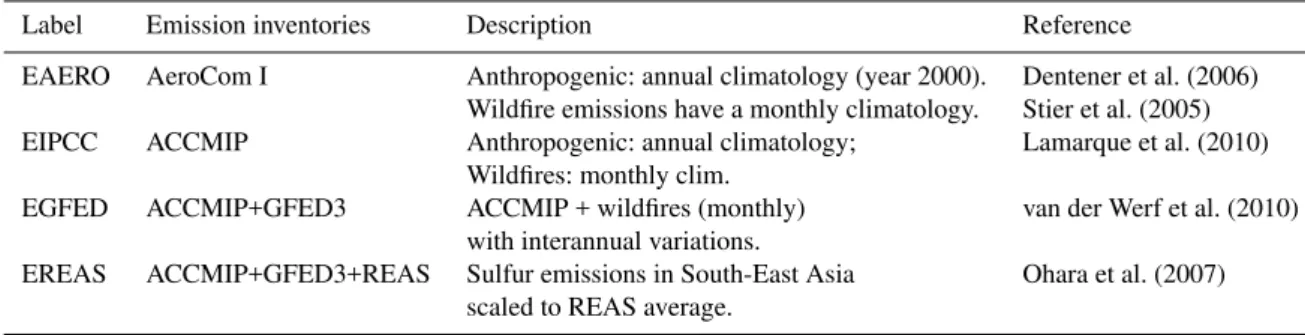
In this work we explore the use of different aerosol emis-sion databases as boundary conditions for ECHAM-HAM, which are summarized in Table 1 together with the labels used to identify them. Table 2 details the total anthropogenic and wildfire emissions for these datasets, both globally and for the northern hemisphere excluding the equatorial area (north of 10◦N). In particular we use the AeroCom-I (Den-tener et al., 2006) and the ACCMIP (Atmospheric Chem-istry and Climate Model Intercomparison Project, Lamarque et al., 2010) inventories, both for the year 2000. Anthro-pogenic fossil-fuel and bio-fuel emissions for sulfur, black and organic matter are annual data. Wildfire burning emis-sions are represented as monthly climatologies. Since fires in Siberia, Canada and Alaska have been found to provide a significant contribution to Arctic pollution (Law and Stohl, 2007; Stohl, 2006; Stocks et al., 1998; Koch and Hansen, 2005), with important interannual variability, the choice of biomass burning emissions datasets may play an important role. Variability in these emissions, interacting with interan-nual changes in circulation, may lead to significant changes in Arctic aerosol concentrations. While ACCMIP includes data from the Global Fire Emission Database 2 (GFED2), we also explore ACCMIP emissions using the more recent GFED3 monthly biomass burning emission database (van der Werf et al., 2010) and we allow these emissions (sulfur, black carbon and organic matter) to vary annually instead of using a climatological mean.
Koch and Hansen (2005) showed that, while the largest contribution in terms of sulfate aerosols to Arctic AOD comes from Russia, South-East Asia contributes with a sig-nificant fraction. Since there is a sigsig-nificant difference in terms of sulfate emissions between the REAS and AC-CMIP emission datasets, we explore the possible impact of a change in anthropogenic SO2emissions in the
South-East Asia region. To this end, we consider the latter emis-sions (ACCMIP+GFED3), rescaling ACCMIP 2000 anthro-pogenic sulfate emissions in the region 95–135◦E–10–50◦N to the REAS database (Ohara et al., 2007) averaged over the years 2001–2006 (i.e. we multiply the ACCMIP anthro-pogenic SO2emissions in this region by a factor 1.7). In all
Table 1.Emission datasets used for ECHAM5-HAM runs.
Label Emission inventories Description Reference
EAERO AeroCom I Anthropogenic: annual climatology (year 2000). Dentener et al. (2006)
Wildfire emissions have a monthly climatology. Stier et al. (2005)
EIPCC ACCMIP Anthropogenic: annual climatology; Lamarque et al. (2010)
Wildfires: monthly clim.
EGFED ACCMIP+GFED3 ACCMIP + wildfires (monthly) van der Werf et al. (2010)
with interannual variations.
EREAS ACCMIP+GFED3+REAS Sulfur emissions in South-East Asia Ohara et al. (2007)
scaled to REAS average.
Table 2.Anthropogenic emissions for each emission dataset (in [Tg yr−1]).
Global emissions Emissions north of 10◦N
EAERO EIPCC EGFED EREAS EAERO EIPCC EGFED EREAS
BC Fossil fuel 3.03 3.06 3.06 3.06 2.58 2.53 2.53 2.53
Biofuela 1.63 2.09 2.09 2.09 1.14 1.57 1.57 1.57
Wildfire 3.04 2.61 2.07 2.07 0.54 0.61 0.45 0.45
OCd Fossil fuel 2.44 4.25 4.25 4.25 1.96 3.17 3.17 3.17
Biofuela 6.47 8.45 8.45 8.45 4.53 6.28 6.28 6.28
Wildfire 24.7 23.2 18.1 18.1 5.38 6.99 5.32 5.32
SU Highb 95.2 91.0 91.0 104.4 85.5 77.6 77.6 91.1
Lowc 13.0 12.7 12.8 15.7 11.5 10.9 10.9 13.8
Wildfire 4.09 3.83 2.29 2.29 0.74 1.07 0.62 0.62
aBiofuel = biomass burning + agricultural waste + fuelwood;bSU high = sulfur from industry + powerplants + shipping;cSU low = sulfur
from domestic + roads + off road;dParticulate organic matter = 1.4×Organic Carbon.
in the model as described in Stier et al. (2005) and Dentener et al. (2006). We use the Balkanski et al. (2004) scheme for on-line dust emissions and Schulz et al. (2004) for on-line sea-salt emissions. Other emissions and parametrizations are as described in Stier et al. (2005) and in Lohmann and Hoose (2009).
In the following we also explore a simple change in the model wet scavenging parametrization introduced recently by Bourgeois and Bey (2011) to better reproduce the ob-served optical properties and concentrations of aerosols in the Arctic region. HAM parametrizes wet scavenging us-ing the precipitation formation rate of the ECHAM5 cloud scheme and computing the fraction of tracer that is embedded in cloud water using simple size-dependent and cloud-type dependent scavenging coefficients, based on measurements from Henning et al. (2004). Bourgeois and Bey (2011) ex-plored reducing these coefficients, based on a re-evaluation of the results in Henning et al. (2004) and following papers, leading to an increase in BC and sulfate lifetimes and to in-creased burdens in the Arctic, while the global and annual scavenged masses remained similar. We apply this modifica-tion using the same parameters as described in their paper.
2.4 TM5
TM5 is a global three-dimensional atmospheric chemistry and transport model (Krol et al., 2005). Aerosol microphys-ical processes are modeled using the aerosol dynamics mod-ule M7 (Vignati et al., 2004). It represents sulphate, black carbon, organic carbon, sea salt and mineral dust in seven in-ternally mixed soluble or insoluble log-normal size modes. Gas-particle partitioning of ammonium nitrate is calculated using the EQSAM thermodynamic equilibrium model, as de-scribed in Aan den Brugh et al. (2011). The gas-phase chem-istry scheme is based on the Carbon Bond Mechanism 4 (CMB4) and is given in Huijnen et al. (2010). In our setting, the horizontal resolution is 3×2 degrees and the vertical grid
comprises 34 hybridσ-pressure levels. Atmospheric
dynam-ical fields are provided by ECMWF ERA-Interim reanalysis data (Dee et al., 2011).
(a)
month
lat
ERA−Interim mm/day
2 4 6 8 10 12 60 70 80 90 0 1 2 3 month lat MACC mm/day
2 4 6 8 10 12 60 70 80 90 0 1 2 3 month lat ECHAM mm/day
2 4 6 8 10 12 60 70 80 90 0 1 2 3 month lat
ECHAM nudged mm/day
2 4 6 8 10 12 60 70 80 90 0 1 2 3 (b) month lat ERA−Interim frac.
2 4 6 8 10 12 60 70 80 90 0.5 0.6 0.7 0.8 0.9 month lat MACC frac.
2 4 6 8 10 12 60 70 80 90 0.5 0.6 0.7 0.8 0.9 month lat ECHAM frac.
2 4 6 8 10 12 60 70 80 90 0.5 0.6 0.7 0.8 0.9 month lat
ECHAM nudged frac.
2 4 6 8 10 12 60 70 80 90 0.5 0.6 0.7 0.8 0.9
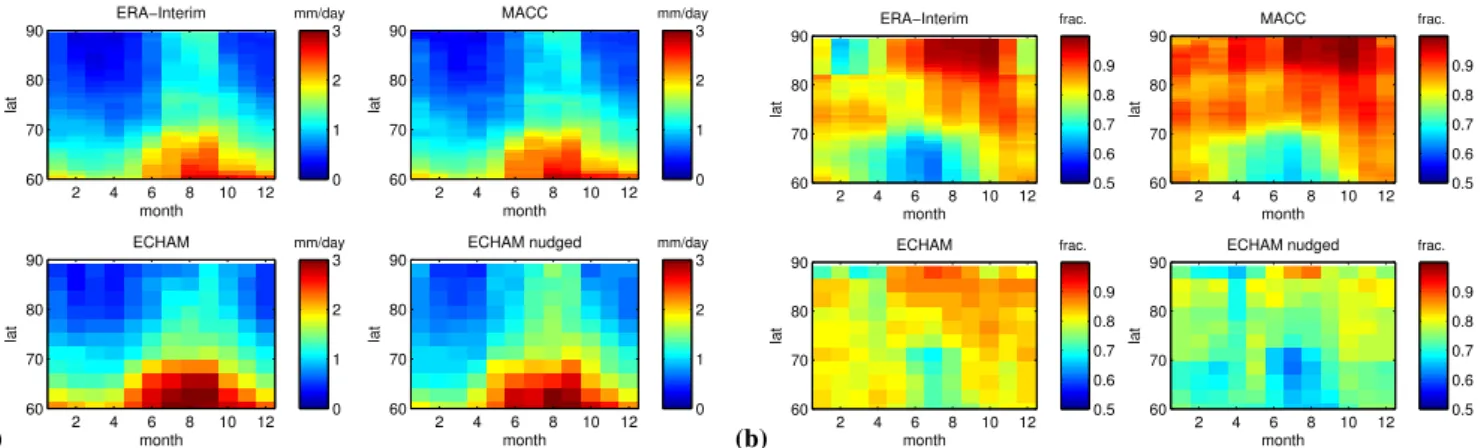
Fig. 2. Zonal averages of precipitation and total cloud cover as a function of month and latitude for models and reanalyses used in this study. The total precipitation fields are monthly averaged in the period 2003-2006 (common to all datasets) for ERA-Interim, MACC, ECHAM (the
EAERO run) and for ECHAM nudged to ERA-Interim (EAERO).(a)Total precipitation.(b)Total cloud cover fraction.
Emissions of sea salt, oceanic DMS and nitrogen oxides (NOx) from lightning are calculated online, while other nat-ural emissions are prescribed. Sea-salt emissions are parame-terized as described in Vignati et al. (2010). The schemes ap-plied for DMS and lightning NOx are the same as in Huijnen et al. (2010). The emissions of mineral dust are prescribed using the AeroCom-I dataset for the year 2000 (Dentener et al., 2006). Biogenic emissions of isoprene and other nat-ural emissions are prescribed based on yearly and monthly datasets compiled by the MACC project (total SOA emission fields correspond to 19 Tg yr−1). The implementation of the
emission heights for the different sources and anthropogenic sectors has been revised compared to the description given in Huijnen et al. (2010).
3 Results
3.1 Model precipitation
In the Arctic wet removal processes are the main mechanisms for aerosol removal (gravitational sedimentation plays a mi-nor role because the aerosol is dominated by small particles). For these reasons the ability of a global climate model in re-producing reasonably the atmospheric branch of the water cycle is crucial, in particular cloud and precipitation fields at high latitudes and their seasonality. We compare Arctic precipitation climatologies in ERA-Interim, MACC and in the ECHAM model, reporting in Fig. 2a zonally averaged to-tal precipitation fields, as a function of the month, averaged over the period 2003–2006, common to all datasets. Both a nudged and free simulation of ECHAM are shown. While av-erage precipitation is comparable in winter months, ECHAM shows slightly higher precipitation in summer, compared both to MACC and ERA-Interim, mainly south of 70◦N, par-ticularly for the non-nudged simulation. Investigation of spa-tial maps (not shown) reveals that this excess summer
pre-cipitation occurs mainly over the areas from eastern Siberia to Alaska. This difference may be particularly relevant for removal of OC, BC and sulfur aerosols emitted by summer fires in these areas. Figure 2b also reports a comparison of to-tal cloud covers (as a fraction) in the different models. While MACC shows the highest cloud fraction in all months at high latitudes, and while cloud cover in ECHAM, in particular in the nudged run, is lower compared to ERA-Interim and MACC, the differences remain of the order of 0.1.
3.2 Timeseries and monthly aerosol climatologies
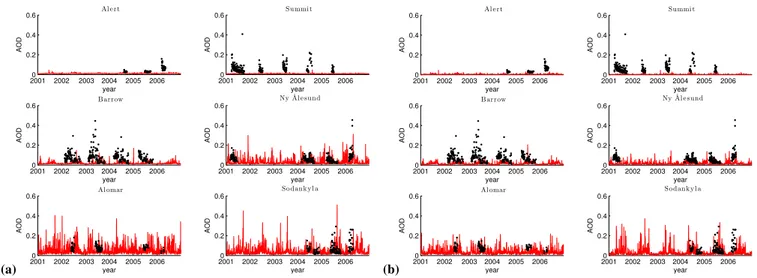
Figure 3a and b compare daily values of AOD observed at the measurement sites with those modeled at the nearest gridpoint by ECHAM-HAM (using the EIPCC emissions) and TM5. As the figures clearly show, AOD measurements are available only for limited periods and with several gaps, different for each site. For the Ny ˚Alesund, Sodankyla and ALOMAR sites, both models are capable of reproducing ex-treme values of AOD comparable to observations. At Barrow, Alert and Summit a significant underestimation of observed values is apparent for both models. In evaluating these plots it is important to recall the extreme intermittency observed in Arctic haze, fire smoke and Asian dust transport episodes, which often take place over few days. While the model sim-ulations are based on realistic wind fields (with TM5 us-ing ERA-Interim fields and ECHAM nudged to the same), and may be able to reproduce correctly transport episodes from low latitudes, aerosol emissions used here are based on monthly climatologies, so that the daily variability of local sources and the interaction between individual fire episodes and specific transport patterns may not be reproduced.
(a)
20010 2002 2003 2004 2005 2006 0.2
0.4 0.6
year
AOD
Al e rt
20010 2002 2003 2004 2005 2006 0.2
0.4 0.6
year
AOD
Summi t
20010 2002 2003 2004 2005 2006 0.2
0.4 0.6
year
AOD
Barrow
20010 2002 2003 2004 2005 2006 0.2
0.4 0.6
year
AOD
Ny ˚Al e sund
20010 2002 2003 2004 2005 2006 0.2
0.4 0.6
year
AOD
Al omar
20010 2002 2003 2004 2005 2006 0.2
0.4 0.6
year
AOD
Sodank y l a
(b)
20010 2002 2003 2004 2005 2006 0.2
0.4 0.6
year
AOD
Al e rt
20010 2002 2003 2004 2005 2006 0.2
0.4 0.6
year
AOD
Summi t
20010 2002 2003 2004 2005 2006 0.2
0.4 0.6
year
AOD
Barrow
20010 2002 2003 2004 2005 2006 0.2
0.4 0.6
year
AOD
Ny ˚Al e sund
20010 2002 2003 2004 2005 2006 0.2
0.4 0.6
year
AOD
Al omar
20010 2002 2003 2004 2005 2006 0.2
0.4 0.6
year
AOD
Sodank y l a
Fig. 3.Time series of daily mean of AOD (550 nm) at the indicated Arctic sites. The black symbols are the observations and the continuous
lines the model results: panel(a)ECHAM5-HAM (EIPCC emissions) results; panel(b)results obtained using TM5. The station data for
AOD were measured at 500 nm and interpolated to 550 nm using the observed ˚Angstr¨om parameters.
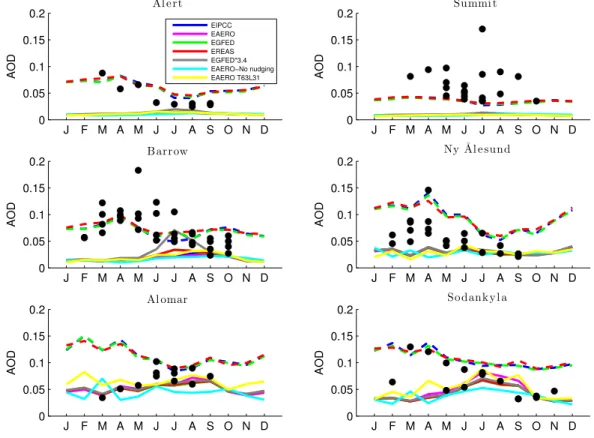
average. The figure also reports the results from the MACC reanalysis and the MODIS Terra and Aqua climatologies. At some sites (Ny ˚Alesund, Sodankyla and Barrow) ground-based observations, MODIS and MACC data display similar values. For these sites we observe that the MACC dataset agrees well with the observations, also in terms of season-ality. A significant late spring-early summer maximum of AOD is clearly visible, with maximum average AOD val-ues exceeding 0.1. At these sites, both ECHAM-HAM and TM5 produce values of AOD which are significantly lower than the observations, particularly during the spring maxi-mum. Only at the rather meridional station of Sodankyla the modeled AOD reaches 0.06 for both TM5 and the ECHAM-HAM models, but with a peak in July instead of March–April as for the observations and the MACC reanalysis. The other Scandinavian station, ALOMAR, shows larger differences between station data and satellite data, particularly in spring. In this particular case though, the agreement between station data and modeled AOD is good, particularly for ECHAM-HAM. At Alert the modeled AOD is significantly smaller than station data, MODIS and MACC observations (there are some significant differences also between these datasets, pre-sumably for the lack of reliable satellite data in this area). At Summit, MACC estimates are very different from observed data during the whole year, presumably because there are no MODIS satellite data available for this location. Mod-eled AODs are significantly lower than both ground-based measurements and the MACC reanalysis. To summarize, the models underestimate AOD, except at Sodankyla and ALO-MAR, and they peak in summer, while the observations, gen-erally, show a maximum in spring (as documented also in Shaw (1995)).
It has been suggested in Bourgeois and Bey (2011) that the amount of aerosols transported to the Arctic is sensitive
to the magnitude of wet removal, suggesting a revision of the wet scavenging parameters used in the ECHAM-HAM model. We tested this approach, using the parameter values suggested in that paper, and the resulting AOD climatology is shown as a blue line in Fig. 4. We see a significant increase of AOD at all latitudes, leading to a reasonable agreement of summer AOD values with observations at all sites. Like the observations, the AOD modeled with the Bourgeois and Bey (2011) parametrization displays a peak in spring, but instead of presenting a minimum in winter as suggested by MACC and by the available measurements, it is minimum in sum-mer.
The monthly climatology of the ˚Angstr¨om parameter is reported in Fig. 4b. While the exact values of the ˚Angstr¨om parameter shown here can be compared only with difficulty, as they were all obtained with slightly different methods (a caveat discussed in Tomasi et al. (2007)), comparing their seasonal variations is certainly of interest. While the ob-served AODs have been found to peak around April–May, the ˚Angstr¨om parameter is found to peak in June-July in the measurements, suggesting that there is a summer shift to-wards finer particles. The TM5 and ECHAM-HAM results are close to the observations and the reanalysis, particularly in the summer months, at all sites, except for Summit. Both models show a seasonal variation with a single main max-imum which is reached around June–July for Barrow, Ny
˚
(a)
J F M A M J J A S O N D 0
0.05 0.1 0.15 0.2
AOD
Al e rt
J F M A M J J A S O N D 0
0.05 0.1 0.15 0.2
AOD
Summi t
J F M A M J J A S O N D 0
0.05 0.1 0.15 0.2
AOD
Barrow
J F M A M J J A S O N D 0
0.05 0.1 0.15 0.2
AOD
Ny ˚Al e sund
J F M A M J J A S O N D 0
0.05 0.1 0.15 0.2
AOD
Al omar
J F M A M J J A S O N D 0
0.05 0.1 0.15 0.2
AOD
Sodank y l a
(b)
J F M A M J J A S O N D 0
1 2 3
Exponent
α
A l ert
J F M A M J J A S O N D 0
0.5 1 1.5 2
Exponent
α
S u m m i t
J F M A M J J A S O N D 0
1 2 3
Exponent
α
B a rrow
J F M A M J J A S O N D 0
0.5 1 1.5 2
Exponent
α
N y ˚A l esu n d
J F M A M J J A S O N D 0
0.5 1 1.5 2
Exponent
α
A l o m a r
J F M A M J J A S O N D 0
0.5 1 1.5 2
Exponent
α
S o d a n kyl a
Fig. 4.Observed and modeled seasonal climatologies of AOD at 550 nm (panel(a)) and of the ˚Angstr¨om parameter (panel(b)) at the mea-surement sites. Observations are shown as black dots (to illustrate interannual variability, we report the individual values for each year). Model results are represented by the continuous lines: ECHAM5-HAM (EIPCC emissions) (green), ECHAM5-HAM with the correction suggested by Bourgeois and Bey (2011) (blue), TM5 (red). MACC data are shown for comparison (red circles) together with MODIS-Aqua
(+) and MODIS-Terra (x) observations. For the ˚Angstr¨om parameter both the land (magenta) and the ocean (blue) MODIS products are
re-ported. All model data and MODIS-Terra observations (where available) are averaged over the years 2001–2006. MODIS-Aqua observations are averaged over the years 2002–2007 and MACC data are averaged over the years 2003–2006. The station data for AOD were measured at
500 nm and interpolated to 550 nm using the observed ˚Angstr¨om parameters.
MODIS MACC
(a) (b)
Fig. 5.Maps of average AOD in different periods of the year. Monthly means are calculated in the period 2003 to 2006, common to all
datasets. Panels:(a)MODIS Terra,(b)MACC. Grey areas indicate missing data.
even if the modeled values are still far from the observations for all months. At other sites the modification leads only to a marginal increase in the value of the ˚Angstr¨om parameter. To summarize, the ˚Angstr¨om parameter is reasonably repro-duced at most stations by both models, indicating that the dis-tribution of particle sizes is captured correctly, together with its seasonality, characterized by a peak in summer. The main exception is the Summit station, located at very high altitude on the Greenland ice sheet, where both TM5 and ECHAM-HAM display an excess of fine particles.
3.3 Spatial distributions
ECHAM-HAM (EIPCC) TM5
(a) (b)
Fig. 6.Maps of average AOD in different periods of the year. Monthly means are calculated in the period 2003 to 2006, common to all
datasets. Panels:(a)ECHAM-HAM (EIPCC emissions),(b)TM5.
ECHAM-HAM (EIPCC) + wet dep. mod. ECHAM-HAM (EGFED) + wet dep. mod.
(a) (b)
Fig. 7.Maps of average AOD in different periods of the year. Monthly means are calculated in the period 2003 to 2006, common to all
datasets. Panels:(a)ECHAM-HAM (EIPCC) with the Bourgeois and Bey (2011) modification.(b) ECHAM-HAM (EGFED) with the
Bourgeois and Bey (2011) modification.
than reported by MODIS in Scandinavia in July–August and higher over the Atlantic in July–October; nonetheless there is a general agreement between the two datasets, both in spatial distributions and amplitudes, suggesting that the MACC re-analysis provides a reasonable interpolation of available ob-servations in these areas. Both the satellite and the reanaly-sis datasets are characterized by a large spatial variability in AOD, with significant differences between the Atlantic and the Pacific sector and an average decrease of AOD with lat-itude. MACC predicts low AOD values from November to February, which, while they cannot be verified with MODIS observations, find some confirmation from station data (see Fig. 4). For these reasons, in the following we are
encour-aged to use the MACC reanalysis as a reference to compare with modeled AOD distributions.
peaks in December-January and confirm this conclusion. The contribution of the Atlantic in winter is much weaker in TM5 than in ECHAM-HAM possibly due to differences in the emission parametrization. Increased values of AOD over northern America and Russia in May–August, possibly as-sociated mainly with fires, are present as spatial features in both model runs, but underestimated in amplitude. Spatial maps of the contribution of organic carbon (not shown) con-firm this view showing contributions over Siberia and North-ern Canada in these months. Overall, as already seen for the monthly climatologies at the station locations, the modeled data do not show the observed seasonality of Arctic AOD, characterized by a pronounced peak in late spring and early summer. Average amplitudes over large areas are underesti-mated by almost one order of magnitude in some months.
Introduction of the Bourgeois and Bey (2011) modifica-tion, in Fig. 7a, leads in general to larger amplitudes which are, in all seasons, closer to the observed (MODIS) and re-analysis (MACC) data. However, the spatial distribution and seasonality still display significant points of disagreement with the observations. Very high Atlantic AOD from January to March compares well with the MACC reanalysis (but does not find strong support in MODIS observations), and AOD over Scandinavia and western Russia appears to be better reproduced. The high AOD observed over northern Amer-ica and east Russia in May to August is underestimated by more than a factor of two. The spatial structure observed in the data, with high AOD concentrated particularly over the continents, is totally absent in the model results. The spatial maps show clearly how the modeled AOD reaches a mini-mum in summer, while the extreme values observed in late winter/spring are still underestimated. Overall the seasonal variability seems lower than observed, compare for example the change between July–August and September–November with the MODIS observations.
Previous works (Law and Stohl, 2007; Stohl, 2006; Stocks et al., 1998) suggest that fires in spring and summer in these regions can be the dominant source of sulfur and black and organic carbon. In Fig. 7b we report also results from the ECHAM-HAM model using the EGFED emissions, which include a better representation of fires in these regions and interannual variability. The overall picture does not change much, even if some patches of higher AOD can now be found on the continental masses of North America and Russia in summer.
3.4 Sensitivity to emissions, resolution and nudging
We further explore the ECHAM-HAM model sensitivity to changes in the emission databases in Fig. 8, which re-ports, for the different emissions, the monthly AOD clima-tologies at the measurements sites for which ground-based data are available. We find clearly that, while these emis-sion databases differ significantly in terms of annual aver-age emissions (see the budgets reported in Table 1), their
impact on Arctic AOD is scarcely significant in the model simulations, irrespective of whether or not the Bourgeois and Bey (2011) modification is used. Neither a better representa-tion of Arctic fire emissions (EGFED), including interannual variability, nor the increased emissions in Southeast Asia, do impact the modeled Arctic AOD. In principle it is possible that interannual variations in atmospheric circulation may in-teract with the timing of major fires in the Arctic, leading to differences in summer aerosol concentrations. Our results indicate that this is not the case. A simulation (not shown) using a monthly climatology based on the EGFED emissions leads to results which are almost indistinguishable from the EGFED simulation with interannual variations.
For comparison we also report the results obtained (for the same years) from a climatological, non-nudged ECHAM-HAM simulation using the EAERO emissions. The results display some small differences with respect to the nudged runs, particularly at the European stations of Ny ˚Alesund, ALOMAR and Sodankyla, in keeping with the view that the details of the atmospheric circulation and of the associated transport processes influence the aerosol distribution. How-ever, the differences between the nudged and non-nudged runs are rather small, and in all cases the simulated AOD remains smaller than the observations at all sites.
Two recent publications (Kaiser et al., 2012; Huijnen et al., 2012) recommend to enhance particulate emissions from wildfires with a global corrective factor of 3.4 in order to compensate for an observed discrepancy between bottom-up and top-down aerosol emission estimates. We tested this suggestion performing an experiment with the EGFED emis-sions, in which OC and BC emissions are multiplied by this factor, also reported in Fig. 8. We find a significant increase from June to August for Barrow, where modeled AOD be-comes comparable with observations. Indeed in this area summer fires in Siberia, Alaska and Canada can have a sig-nificant impact. The differences compared to the other simu-lations remain extremely small at all other stations.
Finally, the role of model resolution is also explored, con-sidering a nudged ECHAM-HAM simulation (with EAERO emissions) at a higher horizontal and vertical resolution (T63 with 31 vertical levels), also reported in Fig. 8, averaged for the years 2001 to 2003. We find that, while there are some differences in the average AOD observed in individual months (possibly due to the shorter period over which the cli-matology has been computed), these do not cure in any way the underestimation of the AOD which we already discussed. This result is in agreement with Shindell et al. (2008), where it has been shown that, in an intermodel comparison, hori-zontal model resolution does not show any clear effect on aerosol transport towards the Arctic.
3.5 Contribution of aerosol compounds
J F M A M J J A S O N D 0
0.05 0.1 0.15 0.2
AOD
Al e rt
J F M A M J J A S O N D
0 0.05 0.1 0.15 0.2
AOD
Summi t
J F M A M J J A S O N D
0 0.05 0.1 0.15 0.2
AOD
Barrow
J F M A M J J A S O N D
0 0.05 0.1 0.15 0.2
AOD
Ny ˚Al e sund
J F M A M J J A S O N D
0 0.05 0.1 0.15 0.2
AOD
Al omar
J F M A M J J A S O N D
0 0.05 0.1 0.15 0.2
AOD
Sodank y l a
EIPCC EAERO EGFED EREAS EGFED*3.4 EAERO−No nudging EAERO T63L31
Fig. 8.Comparison of AOD modeled with ECHAM-HAM for different emission databases, averaged over the years 2001–2006. Emissions used are EAERO (continuous magenta line), EIPCC (blue), EGFED (green), EREAS (red). The same emissions, using also the Bourgeois and Bey (2011) parametrization are dashed. A simulation with the EGFED dataset, in which OC and BC emissions from wildfires have been multiplied by a factor 3.4, is reported in gray. A simulation with the EAERO emissions and without nudging is reported in cyan. We also report one simulation (ECHAM-HAM, EAERO) at a higher resolution of T63L31 (in yellow- averaged over the years 2001–2003). Ground-based station observations are reported with black dots as in Fig. 4.
Arctic (defined as the area north of 60◦N) of the total AOD and of the fraction associated with each aerosol compound (organic carbon, black carbon, sea salt, sulfur and dust). For MACC and TM5, ambient aerosol contributions to total AOD are reported (i.e. the contribution of their water content is in-cluded) while for ECHAM-HAM we report dry compound contributions and diagnosed aerosol water as a separate com-ponent. As the MACC results (Fig. 9a) clearly show, there is a predominant role of sulfates in determining the total AOD, accounting for about half of it. An “Arctic-haze” spring max-imum in April–May is clearly visible, with a progressive de-cay during summer, reaching a minimum in December. Sea salt has an opposite seasonality, reaching a minimum in sum-mer and a maximum in winter, compatible with a contribu-tion of Atlantic sea salt emissions in winter which we have described above, possibly due to stronger mesoscale pertur-bations. Organic carbon peaks and contributes significantly to total AOD from May to August. As already mentioned, spatial maps of its distribution (not shown) confirm an as-sociation with wildfires in Siberia and norther Canada in that period. Also black carbon peaks in summer, but shows
(a) 0 0.02 0.04 0.06 0.08 0.1 0.12 0.14 0.16
2 4 6 8 10 12
AOD month MACC OC BC*10 SS SU DU Total (b) 0 0.01 0.02 0.03 0.04 0.05
2 4 6 8 10 12
AOD month TM5 OC BC*10 SS SU DU NO3*10 WAT Total (c) 0 0.01 0.02 0.03 0.04 0.05
2 4 6 8 10 12
AOD month ECHAM-HAM OC*5 BC*50 SS*5 SU*5 DU*5 WAT Total (d) 0 0.02 0.04 0.06 0.08 0.1 0.12 0.14 0.16
2 4 6 8 10 12
AOD
month
ECHAM-HAM + wet scav. mod. OC*5 BC*50 SS*5 SU*5 DU*5 WAT Total (e) 0 0.05 0.1 0.15 0.2
2 4 6 8 10 12
Arctic Burden [Tg]
month ECHAM-HAM OC BC*10 SS SU DU (f) 0 0.05 0.1 0.15 0.2
2 4 6 8 10 12
Arctic Burden [Tg]
month TM5 OC BC*10 SS SU DU NO3*10
Fig. 9. (a)Averages over the Arctic (north of 60◦N) of the contribution to total AOD of different compounds for the MACC reanalysis (these
are ambient aerosol contributions, i.e. including water);(b)average AOD of different compunds in the TM5 model (ambient aerosols).(c)the
same for the ECHAM-HAM (EIPCC) simulation (a direct comparison is not possible since diagnosed aerosol water is treated as a separate
compound in HAM diagnostics and the dry aerosol contributions are shown);(d)the same as(c)for the ECHAM-HAM (EIPCC) simulation
with the (Bourgeois and Bey, 2011) wet scavenging modification.(e)average total burdens (in Tg) over the Arctic for the ECHAM-HAM
(EIPCC) simulation.(f)average total burdens (in Tg) over the Arctic for the TM5 simulation. A factor 1.4 has been used to convert particulate
organic matter to organic carbon for TM5. MACC data are averaged over the years 2003–2006. TM5 and ECHAM-HAM data are averaged over the years 2001–2006. AOD and burdens of black carbon have been multiplied by 10 for clarity in all panels. An additional factor of 5
has been applied to show the seasonalities of dry AOD contributions of individual compounds for ECHAM-HAM in panels(c)and(d).
about a factor of three. Nitrates provide a very small contri-bution to total AOD, comparable to that of black carbon in winter. The aerosol water contribution to total AOD, shown in the figure, appears to be dominated mainly by the the sea-sonality of sulfates, with a contribution by sea-salt in win-ter. These effects in terms of AOD are associated with cor-responding seasonalities in terms of total Arctic loads (bur-dens) which we report in Fig. 9f. The seasonal cycles of sea-salt, organic carbon, nitrate and sulfate burdens correspond to similar cycles in terms of AOD. While a significant dust load is present, we have seen above that it does not contribute much to the total AOD. Overall the partition in terms of the contribution of individual aerosol compounds to total AOD is similar between TM5 and MACC, leading to the conclusion that (provided the MACC reanalysis is reliable), the under-estimation of total AOD may be due to mechanisms which affect all compounds, such as errors in long range transport or underestimated aerosol residence times for this model.
The AOD contributions of individual compounds for the ECHAM-HAM simulations (using EIPCC emissions) are re-ported in Fig. 9c and the corresponding Arctic burdens are reported in Fig. 9e. In this case, since aerosol water content is treated as an additional optically active compound in HAM and its contribution is saved separately in the diagnostics, we report the dry contributions to the total AOD of each com-pound and, separately, the contribution of diagnosed aerosol
water. The total AOD, while on average comparable to that reported by TM5 and much smaller than the MACC average, presents a smaller seasonal variability compared to MACC. Also in this case AOD peaks in August, while high values in April are absent. Sulfates follow the same pattern, with a weak summer maximum and no sign of a spring peak. We find again that organic and black carbon are concentrated in summer months. The total burdens, reported in Fig. 9e are, compared to TM5, lower in terms of sulfates, black carbon and dust and similar for organic carbon and sea salt.
by ECHAM-HAM with the wet scavenging modification re-mains smaller than indicated by MACC.
4 Discussion and conclusions
An underestimation of modeled concentrations of sulfates and black carbon in the Arctic has already been evidenced in Shindell et al. (2008) for several current models, including TM5 and ECHAM-HAMMOZ (ECHAM-HAM + gas phase chemistry module MOZART; Pozzoli et al. (2008)). Com-parison with a large number of other models in that study has allowed to determine a great diversity in model results, at-tributed mainly to differences in aerosol physical and chem-ical processing mechanisms, while emissions and transport processes play a minor role. Particularly the bad reproduc-tion of black carbon surface concentrareproduc-tions at Alert and Bar-row shown in that study, suggested that there may exist also issues in the interpretation and comparison of measurements and modeled concentrations. Low BC concentrations in the Arctic and a wide model diversity have also been reported in the AeroCom model comparison in Koch et al. (2009). In Textor et al. (2006) ECHAM-HAM and TM5 show sig-nificantly lower total polar burdens of aerosols, for all com-pounds, compared with other AeroCom models. Bourgeois and Bey (2011) verified that ECHAM-HAMMOZ underes-timates the export of aerosols from the planetary boundary layer to the free troposphere and consequently underesti-mates long-range transport from polluted areas in the mid-latitudes to the Arctic. In comparison the model is successful in reproducing long-range transport of CO, suggesting that dry transport processes are reasonably well modeled. They suggested a reduction of the wet scavenging parameters in the model, finding significant improvement.
In this work, we explored the skill of TM5 and ECHAM-HAM in these areas in deeper detail, focusing on the optical parameters AOD and ˚Angstr¨om, which are directly observed by ground-based and satellite measurements, comparing both their spatial structure and the amplitudes measured at the lo-cation of six Arctic stations. The ˚Angstr¨om parameter is rea-sonably reproduced at most stations by both models, indi-cating that the distribution of particle sizes is captured cor-rectly, together with its seasonality, characterized by a peak in summer. The main exception is the Summit station where both TM5 and ECHAM-HAM overestimate the parameter; this station is located at high altitude on the Greenland ice sheet, so that orographic effects and model resolution may play a role. The AOD results from in-situ stations show a se-vere underestimation in amplitude of observed values and an absence of the strong seasonality found in the observations, with a peak in summer rather than in late spring. This under-estimation is also confirmed by spatial maps of AOD com-pared with currently available satellite and reanalysis prod-ucts. The latter are highly uncertain in polar areas, but to-gether with the station measurements they confirm an
under-estimation of AODs and burdens by the models over most of the Arctic. Spatial maps show also that some observed fea-tures, such as the appearance of areas with very high AOD over north America and northern Russia from May to Au-gust, are not reproduced in the model simulations. While specific properties of individual measurement stations such as their position and elevation may of course play a role, the satellite and reanalysis comparisons suggest that the problem is mainly over the entire region and that other mechanisms, such as emissions, transport and scavenging processes, may be at the origin of this mismatch. We verified, for ECHAM-HAM, that changes in emission databases or in model reso-lution do not have a significant impact on the Arctic distribu-tions of modeled AOD. The only exception is an experiment following Kaiser et al. (2012), in which particulate emis-sions from wildfires were enhanced with a corrective factor, which provides AOD values comparable to station observa-tions, but only for Barrows in summer and with little effect for other stations. There are also no significant differences if the model is free to run in a climatological mode or forced by nudging to follow observed winds. When we test the modi-fication of wet scavenging suggested by Bourgeois and Bey (2011) we find much higher AODs, comparable in a yearly and spatially averaged sense with observations, but still with very different seasonality and spatial structure. In particular, values in autumn and winter appear too high, and a summer minimum appears, while areas with high AOD over northern Russia and America in summer are not reproduced. These differences in seasonality may be linked with the higher sum-mer precipitation in ECHAM compared to MACC and ERA-Interim, reported in Sect. 3.1. While the wet-scavenging pa-rameters are reduced in the modification, summer precipita-tion at high latitudes can still contribute to significant wet scavenging, leading to low summer aerosol concentrations.
Croft et al. (2010) compared different in-cloud aerosol scav-enging parametrization schemes for ECHAM-HAM, finding large variabilities in aerosol mass and number burdens, and improved agreement with recent diagnostic and prognostic scavenging schemes, particularly at high latitudes. Improved schemes for below-cloud scavenging by snow in ECHAM-HAM are discussed in Croft et al. (2009).
Another source of discrepancy can be related to differ-ences in transport mechanisms between the models and the real atmosphere. While large-scale winds are similar, mesoscale dynamics and transport barriers are poorly rep-resented by the global models considered here. Future devel-opments should thus also consider aerosol dynamics in high resolution regional and global models capable of describing mesoscale processes.
It is important to notice that a comparison between aerosol measurements and model results in the Arctic area is particu-larly difficult. Indeed, aerosol measurements are particuparticu-larly challenging and scarce in polar areas. As shown in this work, ground-based, satellite and reanalysis datasets may display significant differences which can be caused by insufficient statistics, uncertainty associated with the measurements, is-sues in their interpretation and conversion, and differences in spatial and temporal resolution. We conclude noting that the spatial maps of observed AOD, from satellites and reanal-ysis, show a large spatial variability of this parameter over the Arctic, suggesting that measurements at single stations can be hardly representative of larger areas. On the other hand, ground-based measurements are essential to calibrate and validate satellite measurements and reanalysis datasets. Due to the impact of changes in the Arctic for the global climate, the extensions of the currently available measure-ment network, the collection and availability of long-term measurements and the exploration of methods to bound data reliability are important future goals.
Acknowledgements. This work has been performed with the com-puting resources provided by the CASPUR supercomcom-puting center, Rome, in the framework of projects std10-302 and ext-06-EARTH. The ground-based measurement data were collected and provided by the groups and institutions participating in the POLAR-AOD programme. We acknowledge and thank the POLAR-AOD teams for the collection and the post-processing of the data and for making them available. In particular we acknowledge R. S. Stone (GMD/NOAA), C. Wehrli (PMOD/WMO), A. Herber (AWI), V. E. Cachorro (GOA-UVA) and V. Aaltonen (FMI). Fire emissions from the Global Fire Emissions Database version 3 (GFED3) database have been used. We would like to acknowledge the work of the GEIA ACCENT team, for providing and maintaining the emission data portal and in particular, the authors of the ACCMIP, GFED3 and REAS emission datasets. We acknowledge the AeroCom and MACC working groups for providing access to their respective datasets. MACC and ERA-Interim data were downloaded from the ECMWF data service portal. MODIS data were downloaded from the Giovanni online data system, developed and maintained by the NASA GES DISC and we acknowledge the MODIS mission
scientists and associated NASA personnel for the production of the data. We thank Q. Bourgeois and I. Bey for useful discussions.
Edited by: Y. Balkanski
References
Balkanski, Y., Schulz, M., Claquin, T., Moulin, C., and Ginoux, P.: Emission Of Atmospheric Trace Compounds, chap. Global emis-sions of mineral aerosol: formulation and validation using satel-lite imagery, 239–267, Ed. Kluwer, 2004.
Benedetti, A., Morcrette, J.-J., Boucher, O., Dethof, A., Enge-len, R. J., Fisher, M., Flentjes, H., Huneeus, N., Jones, L., Kaiser, J. W., Kinne, S., Mangold, A., Razinger, M., Sim-mons, A. J., Suttie, M., and the GEMS-AER team: Aerosol analysis and forecast in the ECMWF Integrated Forecast Sys-tem. Part II: Data assimilation, J. Geophys. Res., 114, D13205, doi:10.1029/2008JD011115, 2009.
Bourgeois, Q. and Bey, I.: Pollution transport efficiency toward the Arctic: Sensitivity to aerosol scavenging and source regions, J. Geophys. Res., 116, D08213, doi:10.1029/2010JD015096, 2011. Browse, J., Carslaw, K. S., Arnold, S. R., Pringle, K., and Boucher, O.: The scavenging processes controlling the sea-sonal cycle in Arctic sulphate and black carbon aerosol, At-mos. Chem. Phys. Discuss., 12, 3409–3465, doi:10.5194/acpd-12-3409-2012, 2012.
Aan den Brugh, J. M. J., Schaap, M., Vignati, E., Dentener, F., Kah-nert, M., Sofiev, M., Huijnen, V., and Krol, M. C.: The European aerosol budget in 2006, Atmos. Chem. Phys., 11, 1117–1139, doi:10.5194/acp-11-1117-2011, 2011.
Croft, B., Lohmann, U., Martin, R. V., Stier, P., Wurzler, S., Fe-ichter, J., Posselt, R., and Ferrachat, S.: Aerosol size-dependent below-cloud scavenging by rain and snow in the ECHAM5-HAM, Atmos. Chem. Phys., 9, 4653–4675, doi:10.5194/acp-9-4653-2009, 2009.
Croft, B., Lohmann, U., Martin, R. V., Stier, P., Wurzler, S., Feichter, J., Hoose, C., Heikkil¨a, U., van Donkelaar, A., and Ferrachat, S.: Influences of in-cloud aerosol scavenging pa-rameterizations on aerosol concentrations and wet deposition in ECHAM5-HAM, Atmos. Chem. Phys., 10, 1511–1543, doi:10.5194/acp-10-1511-2010, 2010.
Dee, D. P., Uppala, S. M., Simmons, A. J., Berrisford, P., Poli, P., Kobayashi, S., Andrae, U., Balmaseda, M. A., Balsamo, G., Bauer, P., Bechtold, P., Beljaars, A. C. M., van de Berg, L., Bid-lot, J., Bormann, N., Delsol, C., Dragani, R., Fuentes, M., Geer, A. J., Haimberger, L., Healy, S. B., Hersbach, H., H´olm, E. V., Isaksen, L., K˚allberg, P., K¨ohler, M., Matricardi, M., McNally, A. P., Monge-Sanz, B. M., Morcrette, J.-J., Park, B.-K., Peubey, C., de Rosnay, P., Tavolato, C., Th´epaut, J.-N., and Vitart, F.: The ERA-Interim reanalysis: configuration and performance of the data assimilation system, Q. J. Roy. Meteorol. Soc., 137, 553– 597, doi:10.1002/qj.828, 2011.
Flanner, M. G., Zender, C. S., Randerson, J. T., and Rasch,
P. J.: Present-day climate forcing and response from
black carbon in snow, J. Geophys. Res., 112, D11202, doi:10.1029/2006JD008003, 2007.
Flanner, M. G., Zender, C. S., Hess, P. G., Mahowald, N. M., Painter, T. H., Ramanathan, V., and Rasch, P. J.: Springtime warming and reduced snow cover from carbonaceous particles, Atmos. Chem. Phys., 9, 2481–2497, doi:10.5194/acp-9-2481-2009, 2009.
Hansen, J., and Nazarenko, L.: Soot climate forcing via snow and ice albedos, Proceedings of the National Academy of Sciences of the United States of America, 101, 423–428, doi:10.1073/pnas.2237157100, 2004.
Henning, S., Bojinski, S., Diehl, K., Ghan, S., Nyeki, S., and Wein-gartner E.: Aerosol partitioning in natural mixed-phase clouds, Geophys. Res. Lett., 31, L06101, doi:10.1029/2003GL019025, 2004.
Hirdman, D., Sodemann, H., Eckhardt, S., Burkhart, J. F., Jeffer-son, A., Mefford, T., Quinn, P. K., Sharma, S., Str¨om, J., and Stohl, A.: Source identification of short-lived air pollutants in the Arctic using statistical analysis of measurement data and par-ticle dispersion model output, Atmos. Chem. Phys., 10, 669–693, doi:10.5194/acp-10-669-2010, 2010.
Hirdman, D., Burkhart, J. F., Sodemann, H. , Eckhardt, S. , Jeffer-son, A., Quinn, P. K. , Sharma, S. , Str¨om, J. and Stohl, A.: Long-term trends of black carbon and sulphate aerosol in the Arctic: changes in atmospheric transport and source region emissions, Atmos. Chem. Phys., 10, 9351–9368, doi:10.5194/acp-10-9351-2010, 2010.
Holland, H. H. and Bitz, C. M.: Polar amplification of cli-mate change in coupled models, Clim. Dynam., 21, 221–232, doi:10.1007/s00382-003-0332-6, 2003.
Huang, L., Gong, S. L., Sharma, S., Lavou, D., and Jia, C. Q.: A trajectory analysis of atmospheric transport of black carbon aerosols to Canadian high Arctic in winter and spring (1990– 2005), Atmos. Chem. Phys., 10, 5065–5073, doi:10.5194/acp-10-5065-2010, 2010.
Huijnen, V., Williams, J., van Weele, M., van Noije, T., Krol, M., Dentener, F., Segers, A., Houweling, S., Peters, W., de Laat, J., Boersma, F., Bergamaschi, P., van Velthoven, P., Le Sager, P., Es-kes, H., Alkemade, F., Scheele, R., N´ed´elec, P., and P¨atz, H.-W.: The global chemistry transport model TM5: description and eval-uation of the tropospheric chemistry version 3.0, Geosci. Model Dev., 3, 445–473, doi:10.5194/gmd-3-445-2010, 2010.
Huijnen, V., Flemming, J., Kaiser, J. W., Inness, A., Leit˜ao, J., Heil, A., Eskes, H. J., Schultz, M. G., Benedetti, A., Hadji-Lazaro, J., Dufour, G., and Eremenko, M.: Hindcast experiments of tropo-spheric composition during the summer 2010 fires over western Russia, Atmos. Chem. Phys., 12, 4341–4364, doi:10.5194/acp-12-4341-2012, 2012.
IPCC, 2007: Climate Change 2007: The Physical Science Basis. Contribution of Working Group I to the Fourth Assessment Re-port of the Intergovernmental Panel on Climate Change, edited by: Solomon, S., Qin, D., Manning, M., Chen, Z., Marquis, M., Averyt, K. B., Tignor, M., and Miller, H. L., Cambridge Univer-sity Press, Cambridge, UK and New York, NY, USA.
Kaiser, J. W., Heil, A., Andreae, M. O., Benedetti, A., Chubarova, N., Jones, L., Morcrette, J.-J., Razinger, M., Schultz, M. G., Suttie, M., and van der Werf, G. R.: Biomass burning
emis-sions estimated with a global fire assimilation system based on observed fire radiative power, Biogeosciences, 9, 527–554, doi:10.5194/bg-9-527-2012, 2012.
Kinne, S., Schulz, M., Textor, C., Guibert, S., Balkanski, Y., Bauer, S. E., Berntsen, T., Berglen, T. F., Boucher, O., Chin, M., Collins, W., Dentener, F., Diehl, T., Easter, R., Feichter, J., Fillmore, D., Ghan, S., Ginoux, P., Gong, S., Grini, A., Hendricks, J., Herzog, M., Horowitz, L., Isaksen, I., Iversen, T., Kirkev˚ag, A., Kloster, S., Koch, D., Kristjansson, J. E., Krol, M., Lauer, A., Lamarque, J. F., Lesins, G., Liu, X., Lohmann, U., Montanaro, V., Myhre, G., Penner, J., Pitari, G., Reddy, S., Seland, O., Stier, P., Take-mura, T., and Tie, X.: An AeroCom initial assessment – optical properties in aerosol component modules of global models, At-mos. Chem. Phys., 6, 1815–1834, doi:10.5194/acp-6-1815-2006, 2006.
Koch, D. and Hansen, J.: Distant origins of Arctic black carbon: A Goddard Institute for Space Studies ModelE experiment, J. Geophys. Res., 110, D04204, doi:10.1029/2004JD005296, 2005. Koch, D., Schulz, M., Kinne, S., McNaughton, C., Spackman, J. R., Balkanski, Y., Bauer, S., Berntsen, T., Bond, T. C., Boucher, O., Chin, M., Clarke, A., De Luca, N., Dentener, F., Diehl, T., Dubovik, O., Easter, R., Fahey, D. W., Feichter, J., Fillmore, D., Freitag, S., Ghan, S., Ginoux, P., Gong, S., Horowitz, L., Iversen, T., Kirkev˚ag, A., Klimont, Z., Kondo, Y., Krol, M., Liu, X., Miller, R., Montanaro, V., Moteki, N., Myhre, G., Penner, J. E., Perlwitz, J., Pitari, G., Reddy, S., Sahu, L., Sakamoto, H., Schuster, G., Schwarz, J. P., Seland, Ø., Stier, P., Takegawa, N., Takemura, T., Textor, C., van Aardenne, J. A., and Zhao, Y.: Eval-uation of black carbon estimations in global aerosol models, At-mos. Chem. Phys., 9, 9001–9026, doi:10.5194/acp-9-9001-2009, 2009.
Krol, M., Houweling, S., Bregman, B., van den Broek, M., Segers, A., van Velthoven, P., Peters, W., Dentener, F., and Bergamaschi, P.: The two-way nested global chemistry-transport zoom model TM5: algorithm and applications, Atmos. Chem. Phys., 5, 417– 432, doi:10.5194/acp-5-417-2005, 2005.
Lamarque, J.-F., Bond, T. C., Eyring, V., Granier, C., Heil, A., Klimont, Z., Lee, D., Liousse, C., Mieville, A., Owen, B., Schulz, M. G., Shindell, D., Smith, S. J., Stehfest, E., Van Aardenne, J., Cooper, O. R., Kainuma, M., Mahowald, N., McConnell, J. R., Naik, V., Riahi, K., and van Vuuren, D. P.: Historical (1850– 2000) gridded anthropogenic and biomass burning emissions of reactive gases and aerosols: methodology and application, At-mos. Chem. Phys., 10, 7017–7039, doi:10.5194/acp-10-7017-2010, 2010.
Law, K. S. and Stohl, A.: Arctic air pollution: origins and impacts, Science, 315, 1537–1540, doi:10.1126/science.1137695, 2007. Lohmann, U. and Hoose, C.: Sensitivity studies of different aerosol
indirect effects in mixedphase clouds, Atmos. Chem. Phys., 9, 8917–8934, doi:10.5194/acp-9-8917-2009, 2009.
Ohara, T., Akimoto, H., Kurokawa, J., Horii, N., Yamaji, K., Yan, X., and Hayasaka, T.: An Asian emission inventory of an-thropogenic emission sources for the period 1980–2020, At-mos. Chem. Phys., 7, 4419–4444, doi:10.5194/acp-7-4419-2007, 2007.
Tam-storf, M. P., Tyler, N. J. C., van der Wal, R., Welker, J., Wookey, P. A., Martin Schmidt, N., and Aastrup, P.: Ecological Dynam-ics Across the Arctic Associated with Recent Climate Change, Science, 1355–1358, doi:10.1126/science.1173113, 2009. Pozzoli, L., Bey, I., Rast, S., Schulz, M. G., Stier, P., and
Fe-ichter, J.: Trace gas and aerosol interactions in the fully cou-pled model of aerosol-chemistry-climate ECHAM5- HAM-MOZ: 1. Model description and insights from the spring 2001 TRACE-P experiment, J. Geophys. Res., 113, D07308, doi:10.1029/2007JD009007, 2008.
Quinn, P. K., Shaw, G., Andrews, E., Dutton, E. G., Ruoho-Airola, T., and Gong, S. L.: Arctic Haze: Current trends and knowledge gaps, Tellus B, 59, 99–114, doi:10.1111/j.1600-0889.2006.00238.x, 2007.
Ramanathan, V. and Carmichael G.: Global and regional climate changes due to black carbon, Nature Geosci., 1, 221–227, doi:10.1038/ngeo156, 2008.
Richter-Menge, J., and Overland, J. E. (Eds.): Arctic Report Card, 2011, http://www.arctic.noaa.gov/reportcard, last access: 15 March 2012.
Roeckner, E., B¨auml, G., Bonaventura, L., Brokopf, R., Esch, M., Giorgetta, M., Hagemann, S., Kirchner, I., Kornblueh, L., Manzini, E., Rhodin, A., Schlese, U., Schulzweida, U., and Tompkins, A.: The atmospheric general circulation model ECHAM5. PART I: Model description, Report 349, Max Planck Institute for Meteorology, Hamburg, Germany, available online at: http://www.mpimet.mpg.de, 2003.
Schulz, M., de Leeuw, G., and Balkanski, Y.: Emission Of Atmo-spheric Trace Compounds, chap. Sea-salt aerosol source func-tions and emissions, 333–359, Ed. Kluwer, 2004.
Serreze, M. C., Holland, M. M., and Stroeve, J.: Perspectives on the Arctic’s shrinking sea-ice cover, Science, 315, 1533–1536, doi:10.1007/s10584-011-0101-1, 2007.
Shaw, G. E.: The Arctic haze phenomenon, B. Am.
Meteorol. Soc., 76, 2403–213,
doi:10.1175/1520-0477(1995)076<2403:TAHP>2.0.CO;2, 1995.
Shindell, D. T., Chin, M., Dentener, F., Doherty, R. M., Faluvegi, G., Fiore, A. M., Hess, P., Koch, D. M., MacKenzie, I. A., Sander-son, M. G., Schultz, M. G., Schulz, M., StevenSander-son, D. S., Teich, H., Textor, C., Wild, O., Bergmann, D. J., Bey, I., Bian, H., Cuve-lier, C., Duncan, B. N., Folberth, G., Horowitz, L. W., Jonson, J., Kaminski, J. W., Marmer, E., Park, R., Pringle, K. J., Schroeder, S., Szopa, S., Takemura, T., Zeng, G., Keating, T. J., and Zu-ber, A.: A multi-model assessment of pollution transport to the Arctic, Atmos. Chem. Phys., 8, 5353–5372, doi:10.5194/acp-8-5353-2008, 2008.
Stier, P., Feichter, J., Kinne, S., Kloster, S., Vignati, E., Wilson, J., Ganzeveld, L., Tegen, I., Werner, M., Balkanski, Y., Schulz, M., Boucher, O., Minikin, A. and Petzold, A.: The aerosol-climate model ECHAM5-HAM, Atmos. Chem. Phys., 5, 1125–1156, doi:10.5194/acp-5-1125-2005, 2005.
Stocks, B. J., Fosberg, M. A., Lynham, T. J., Mearns, L., Wotton, B. M., Yang, Q., Jin, J.-Z., Lawrence, K., Hartley, G. R., Mason, J. A., and McKenney, D. W.: Climate change and forest fire poten-tial in Russian and Canadian boreal forests, Clim. Change, 38, 1–13, doi:10.1023/A:1005306001055 1998.
Stohl, A.: Characteristics of atmospheric transport into
the Arctic troposphere, J. Geophys. Res., 111, D11306, doi:10.1029/2005JD006888, 2006.
Stroeve, J., Holland, M. M., Meier, W., Scambos T., and Serreze, M.: Arctic sea ice decline: faster than forecast, Geophys. Res. Lett., 34, L09501, doi:10.1029/2007GL029703, 2007.
Textor, C., Schulz, M., Guibert, S., Kinne, S., Balkanski, Y., Bauer, S., Berntsen, T., Berglen, T., Boucher, O., Chin, M., Dentener, F., Diehl, T., Easter, R., Feichter, H., Fillmore, D., Ghan, S., Ginoux, P., Gong, S., Grini, A., Hendricks, J., Horowitz, L., Huang, P., Isaksen, I., Iversen, I., Kloster, S., Koch, D., Kirkev˚ag, A., Krist-jansson, J. E., Krol, M., Lauer, A., Lamarque, J. F., Liu, X., Mon-tanaro, V., Myhre, G., Penner, J., Pitari, G., Reddy, S., Seland, Ø., Stier, P., Takemura, T., and Tie, X.: Analysis and quantifica-tion of the diversities of aerosol life cycles within AeroCom, At-mos. Chem. Phys., 6, 1777–1813, doi:10.5194/acp-6-1777-2006, 2006.
Tomasi, C., Vitale, V., Lupi, A., Di Carmine, C., Campanelli, M., Herber, A., Treffeisen, R., Stone, R. S., Andrews, E., Sharma, S., Radionov, V., von Hoyningen-Huene, W., Stebel, K., Hansen, G. H., Myhre, C. L., Wehrli, C., Aaltonen, V., Lihavainen, H., Virkkula, A., Hillamo, R., Str¨om, J., Toledano, C., Ca-chorro, V., Ortiz, P., de Frutos, A. M., Blindheim, S., Frioud, M., Gausa, M. Zielinsky, T., Petelski, T., and Yamanouchi, T.: Aerosols in polar regions: A historical overview based on optical depth and in situ observations, J. Geophys. Res., 112, D16205, doi:10.1029/2007JD008432, 2007.
Vignati, E., Wilson, J., and Stier, P.: M7: An efficient size-resolved aerosol microphysics module for large-scale aerosol transport models, J. Geophys. Res., 109, D22202, doi:10.1029/2007JD008432, 2004.
Vignati, E., Facchini, M. C., Rinaldi, M., Scannell, C., Ceburnis, D., Sciare, J., Kanakidou, M., Myriokefalitakis, S., Dentener, F., and O’Dowd, C. D.: Global scale emission and distribution of sea-spray aerosol: Sea-salt and organic enrichment, Atmos. Environ., 44, 670–677, doi:j.atmosenv.2009.11.013, 2010.
van Vuuren, D. P., Edmonds, J., Kainuma, M., Riahi, K., Thom-son, A. M., Hibbard, K., Hurtt, G. C., Kram T., Krey, V., Lamar-que, J.-F., Masui, T., Meinshausen, M., Nakicenovic, N., Smith, S. J., and Rose, S.: The representative concentration pathways: an overview, Clim. Change, 109, 5–31, doi:10.1007/s10584-011-0148-z, 2011.
van der Werf, G. R., Randerson, J. T., Giglio, L., Collatz, G. J., Mu, M., Kasibhatla, P. S., Morton, D. C., DeFries, R. S., Jin, Y., and van Leeuwen, T. T.: Global fire emissions and the contribution of deforestation, savanna, forest, agricultural, and peat fires (1997– 2009), Atmos. Chem. Phys., 10, 11707–11735, doi:10.5194/acp-10-11707-2010, 2010.