Article
Printed in Brazil - ©2015 Sociedade Brasileira de Química0103 - 5053 $6.00+0.00
A
*e-mail: [email protected]
Determination of Pesticides in Soil Using a Hyphenated Extraction Technique
Carlos E. S. Soares,a Antônio A. Neves,*,a Maria E. L. R. Queiroz,a André F. Oliveira,a Anna I. G. Costa,a Roberta C. Assisa and Carlos Eduardo O. Andradea,b
aDepartamento de Química, Universidade Federal de Viçosa, 36570-900 Viçosa-MG, Brazil
bCentro Federal de Educação e Tecnologia de Minas Gerais (CEFET-MG),
Campus Timóteo, Timóteo-MG, Brazil
A new method for the extraction of pesticide residues from soil was developed, optimized, validated and applied to real samples. The technique consisted of combining single-drop microextraction and solid-liquid extraction with low temperature partitioning (SLE/LTP-SDME) followed by analysis using gas chromatography with electron capture detection (GC/ECD). This method was used to determine the presence of alachlor, methyl parathion, trifluralin, endrin, lindane, dieldrin and dichloro-diphenyl-trichloroethane (4,4’-DDT) in soil samples. Recoveries ranging from 67.2 to 122.5% were achieved, coefficients of variation (repeatability) were lower than 22.4% and limits of detection ranged from 0.18 to 0.59 µg kg-1. Recovery from soils fortified with different concentrations of the pesticides ranged from 61.5 to 123.5%. The new method combines the primary advantages of the two techniques: purification of the sample using SLE/LTP and preconcentration using SDME. The new method also enables the determination of low volatility compounds without requiring the sample to be heated.
Keywords: soil, pesticide, single-drop microextraction, solid-liquid extraction with low temperature partitioning
Introduction
Pesticides are widely used in agriculture to control pests and diseases with the goal of increasing productivity and improving the quality of products (animal or vegetable).1,2 However, the presence of pesticide residues can harm many organisms in different environmental compartments.
Soil, which is a vital agricultural resource, has a high capacity to retain and store chemical substances such as pesticides. Once adsorbed onto soil particles, these compounds may be rapidly degraded or in the case of persistent chemicals, may be slowly released into the atmosphere, subterranean aquatic systems and living organisms.3,4
The extraction of pesticides from soil typically requires techniques that can release residues that are strongly retained due to their interaction with soil particles.5 The methods used include mechanical agitation in the presence of solvents, sonication,6-8 microwave irradiation,9 solid-liquid extraction10,11 and QuEChERS.12-15 Solid phase extraction6,16,17 enables the acquisition of extracts that are
of higher purity and have higher concentration factors. However, despite its effectiveness, solid phase extraction is a slow process and requires the use of large volumes of chemical reagents.4
Therefore, there have been relatively few published studies concerning the application of SDME to solid samples.21
An alternative method for the extraction of analytes from complex matrices, such as soil, is the use of solid-liquid extraction with low temperature partitioning (SLE/LTP), which is analogous to liquid-liquid extraction with low temperature partitioning (LLE/LTP).22,23 The advantage of this technique is that only a single step is required to obtain extracts that are sufficiently pure to be directly analyzed by gas chromatography (GC), without requiring additional clean-up steps. However, a disadvantage of this technique is that the sample is diluted because in most cases, the solvent/sample ratio used is 2:1.22-25
The difficulties associated with the use of SDME can be circumvented by combining it with SLE/LTP,23 exploiting the advantages offered by the two techniques. The application of SLE/LTP to solid samples enables the acquisition of extracts that are pure and do not contain particulate material, while SDME provides high concentration factors, enabling analysis with quantification limits that comply with statutory limit values for chemical pollutants.
The goal of this study was to develop, optimize and validate a hyphenated extraction method that could provide a pure extract with a high enrichment factor for the determination of pesticides in soil. The hyphenation involved SLE/LTP and single-drop microextraction SDME.
Experimental
Standards, reagents and samples
The pesticide standards employed were trifluralin (99.3%, m/m), alachlor (99.0%, m/m), lindane (99.8%, m/m), methyl parathion (99.9%, m/m), dieldrin (97.9%, m/m), endrin (99.3%, m/m), and 4,4’-DDT (98.8%, m/m), which were obtained from Sigma-Aldrich. The physical and chemical properties of these compounds are listed in Table 1.
The solvents acetonitrile, ethyl acetate, and n-hexane (Vetec, HPLC grade) were used in the extractions, and Milli-Q water (Millipore) was used during optimization and validation of the SDME method.
Samples of different soils were collected in the municipality of Manhuaçu (Minas Gerais, Brazil), which is an important coffee-producing region. The samples were collected at a depth of 0-20 cm then air-dried, crushed and sieved through a 2 mm screen.
Preparation of standard solutions
Stock standard solutions of each pesticide were prepared in acetonitrile at concentrations of 1000 mg L-1.
A working standard solution containing 10.0 mg L-1 of all of the pesticides in acetonitrile was prepared by appropriate dilution of the stock solutions. The standard solutions were stored in a freezer at approximately −20 °C.
The external standards procedure was used for the quantification of the compounds, with analytical curves constructed after dilution of the working standard solution in acetonitrile.
Chromatographic analysis (GC/ECD)
A Shimadzu GC-17A gas chromatograph was fitted with an electron capture detector (ECD) and a manual injector. The compounds were separated on an HP-5 capillary column (Agilent Technologies) with a length of 30 m, an internal diameter of 0.25 mm and a stationary phase composed of 5% diphenylsiloxane and
95% dimethylsiloxane at a film thickness of 0.1 µm.
Nitrogen was used as the carrier gas at a flow rate of 1.2 mL min-1. The following column temperature program was used: initial temperature of 150 °C, maintained for 1 min, followed by an increase to 200 °C at 40 °C min-1, which was held for 2 min, then an increase to 210 °C at 5 °C min-1, which was held for 3 min, an increase to 220 °C at 3 °C min-1 and an increase to 290 °C at 40 °C min-1, which was held for 2 min. The total analysis time was 16.5 min. The temperatures of the injector and detector were maintained at 280 and 300 °C, respectively. A 1 µL volume of the organic extract was injected into the chromatograph at a split ratio of 1:5.
Solid-liquid extraction with low temperature partitioning combined with single-drop microextraction (SLE/LTP-SDME)
Optimization of the combined techniques was performed in two stages, with SLE/LTP as the first stage and SDME as the second stage.
Optimization of the first stage (SLE/LTP) employed a 23 full factorial design to evaluate the influences of different factors on the extraction efficiency. These factors included the following: (i) type of agitation (vortex for 1 min, level −) or (shaker table for 30 min, level +); (ii) quantity of ethyl acetate in the extractant mixture (0.2 mL, level −) or (1.5 mL, level +); and (iii) freezing time (3.5 h, level −) or (6 h, level +). The extracts obtained after SLE/LTP were analyzed by GC/ECD.
previously optimized and validated for nine pesticides by Soares et al.27
The extraction consisted of placing 4.0 g of soil sample into an extraction medium consisting of a 1:2 ratio of an aqueous phase (4.0 mL of water) and an organic phase (7.8 mL of acetonitrile and 0.2 mL of ethyl acetate). The mixture was vortex agitated for 1 min and then placed in a freezer at −20 ºC for 3.5 h. After separation of the phases by freezing of the soil and the aqueous phase, the supernatant containing the extractant phase and the analytes of interest was filtered using a glass funnel and qualitative filter paper with a pore size of 14 µm. The organic phase was evaporated to dryness under vacuum using a rotary evaporator (Model 802, Fisatom) and
a temperature-controlled water bath (Model TE-184, Tecnal). The analytes were then recovered in 30 mL of Milli-Q water in a 35 mL glass flask fitted with a Teflon cap and a silicone septum. A 10 µL microsyringe with a steel needle (Model 701 RN, Hamilton) containing n-hexane was introduced into the flask, and the needle was submerged into the aqueous sample. The plunger was slowly depressed, injecting a 1.6 µL microdroplet into the solution at a depth of approximately 2.0 cm. The microdroplet was then held in contact with the sample under agitation at 155 rpm and 17 ºC for 30 min. After the extraction, an aliquot of 1.0 µL was injected into the GC/ECD. Prior to each extraction, the microsyringe was washed 10 times with the extraction solvent to ensure that Table 1. Physical and chemical properties of the pesticides26
Pesticide Structural formula Chemical group Class Molar mass
log Kow pH = 7,
20 ºC
Solubility in water at 20-25 ºC /
(mg L-1)
Ebullition point / ºC
Trifluralin
CH3 CH3
N
F F
NO2 NO2
dinitroaniline herbicide 325.28 5.27 0.194 140.0
Alachlor
C H3
C H3
CH3
O Cl O
N chloroacetanilide herbicide 269.76 3.09 148 404.0
Lindane
Cl Cl
Cl Cl Cl Cl
organochlorine insecticide 290.82 3.61 7.3 323.4
Methyl parathion CH3
O
CH3
O
S
P O
O2N
organophosphorus insecticide and acaricide 263.23 3.0 55 143
Endrin Cl
Cl Cl Cl O
Cl Cl
organochlorine insecticide and raticide 380.91 5.06 2.5 × 10⁻¹ 416.2
Dieldrin Cl
Cl Cl Cl O
Cl Cl
organochlorine insecticide 380.90 5.37 1.95 × 10⁻¹ 416.2
4,4’-DDT
Cl Cl
Cl Cl Cl
it was clean and that air bubbles were eliminated. All of the analyses were performed in triplicate.
Validation of the analytical method
Samples of red-yellow argisoil with pH 5.2, organic matter 33 dag kg-1, clay 54%, silt 14% and sand 32% were used. The fortification was performed by adding suitable amounts of analyte standard solution. The stock solution was added in small volume of water enough to moisten the soil sample. The soil was mixed and dried at room temperature.
The following parameters were used to validate the SLE/LTP-SDME-GC/ECD method: selectivity, linearity of the response, limits of detection and quantification, accuracy, precision (repeatability and intermediate precision) and enrichment factor.
Statistical analyses
The data obtained were evaluated using ANOVA with Tukey’s post-hoc test and a 95% confidence level. These tests were performed using Statistica v.8 software.
Results and Discussion
Chromatographic conditions
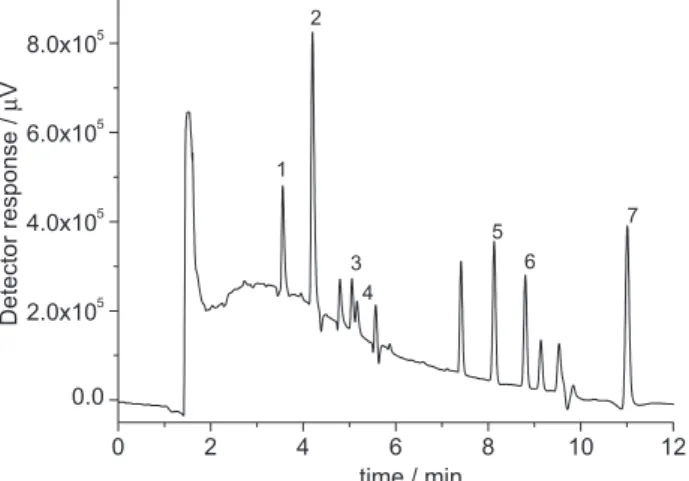
The chromatographic conditions described resulted in good separation of the peaks for the seven pesticides, as shown in Figure 1.
Optimization of the SLE/LTP-SDME experimental conditions
Optimization of the hyphenated SLE/LTP-SDME technique was performed in two stages. The first stage was
optimization of the SLE/LTP and the second stage was optimization of the SDME.
Optimization of the extraction step (SLE/LTP)
The objective of optimizing the extraction was to maximize the percentages of the pesticides extracted from the soil and to provide sample cleanup. A 23 factorial design was used, and the analyses were performed in duplicate.
Effects of the factors
The analysis showed that for all of the compounds studied, the freezing time and the volume of ethyl acetate did not significantly influence the chromatographic response (at the 95% confidence level, α < 0.05) (Figure 2). However, the agitation method showed a significant effect for all of the analytes, with the best results obtained using vortex agitation for 1 min.
Similar findings for freezing time were reported by Goulart et al.28 for the analysis of carbamates in water and by Vieira et al.23 for the analysis of pyrethroids in water. For the agitation method, the results were in agreement with those of Pinho et al.29 for the analysis of pesticide residues in honey in which vortex agitation provided the best extraction. The addition of ethyl acetate, which caused small alterations in the polarity of the extraction solvent, did not have any significant effect on the extraction percentages of the analytes. This result was in agreement with the findings of Magalhães et al.30 for the determination of cocaine in human liver samples.
The second order interaction between the factors of agitation and refrigeration showed a significant effect for the majority of the compounds, with the exception of methyl parathion, endrin and dieldrin. The best conditions were with vortex agitation and a freezing time of 3.5 h or agitation on a shaker table for 30 min with a freezing time of 6 h. Therefore, the first option was selected because it provided the most rapid analysis.
Optimization of the preconcentration step (SDME)
Optimization of the preconcentration step was described in an earlier study by Soares et al.27 therefore, it will only be summarized here.
Agitation speeds between 60 and 250 rpm were evaluated using an exposure time of 30 min, with the best results obtained for 155 rpm. Different microdroplet volumes were evaluated; no significant variations in the response were observed. Therefore, a volume of 1.6 µL was selected. This microdroplet volume was injected into the aqueous phase
0 2 4 6 8 10 12
0.0 2.0x10⁵ 4.0x10⁵ 6.0x10⁵ 8.0x10⁵
time / min
Detector response /
V
µ
1 2
7
6 5 3
4
Figure 1. Chromatogram obtained for a standard solution containing 100 µg L-1 of the pesticides in acetonitrile. Trifluralin (1); lindane (2);
for different lengths of time. The chromatographic response increased with the exposure time; thus, duration of 30 min was selected. The effects of salt addition (NaH2PO4) and temperature were significant (with negative levels in both cases), while the effect of the extraction solvent was not significant. The best experimental conditions were hexane as the extraction solvent, a sample temperature of 17 ºC, and no modification of the ionic strength of the solution.
Validation of the analytical method
Selectivity
Under the chromatographic conditions employed, pesticide-free samples showed no interfering peaks at the retention times of the pesticides (identified using a sample fortified at a concentration of 30 µg L-1), Figure 3. This result confirmed that the proposed method was selective.
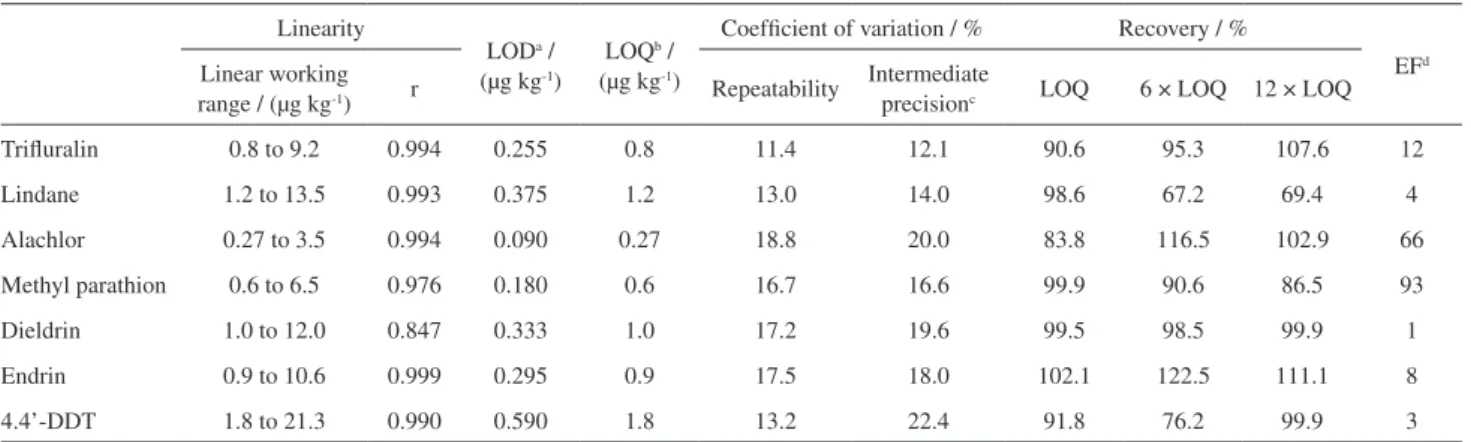
Linearity
The linearity of the method was evaluated by constructing analytical curves using seven points (in triplicate, n = 21).
The application of linear regression models used weighting to compensate for the heteroscedasticity observed in the data. The correlation coefficients (r) ranged from 0.847 (endrin) to 0.999 (dieldrin) (Table 2), demonstrating Figure 2. Pareto charts for the effects of different factors on extraction of the pesticides, considering agitation type, volume of ethyl acetate and freezing time.
0,0 2,0x10⁵
4,0x10⁵
6,0x10⁵
0 2 4 6 8 10 12
0,0 2,0x10⁵
4,0x10⁵
6,0x10⁵
(b) (a)
Detector response /
V
µ
Detector response /
V
µ
time / min 1
2 3
4
5 6 7
Figure 3. Chromatograms obtained for (a) blank soil sample and (b) a sample fortified at 30 µg L-1; trifluralin (1); lindane (2); methyl
that a good correlation was obtained between the concentrations and the peak areas.
Limits of detection (LOD) and quantification (LOQ)
The LOD and LOQ values were determined using the parameters of the analytical curves.The limits of detection were calculated using equation 1, where s is the standard deviation of the response obtained for the blank and S is the slope of the analytical curve. In an analogous manner, the limits of quantification were calculated using equation 2.
LOD = 3.3 × (s/S) (1)
LOQ = 10 × (s/S) (2)
The values obtained for LOD and LOQ ranged from 0.09 to 0.59 µg kg-1 and from 0.27 to 1.77 µg kg-1, respectively (Table 2). The new proposed method provided quantification limits that were lower than those reported by Salemi et al.,31 who obtained a range from 0.7 to 6.6 µg kg-1 for the analysis of organophosphorus pesticides in soil using the headspace method Rouviére et al.16 obtained values between 2.1 and 635 µg kg-1 using QuEChERS to determine aromatic organochlorine compounds in soil.
Accuracy
The accuracy of the technique was evaluated using recovery tests at three concentrations (LOQ, 6 × LOQ and 12 × LOQ). The percentage recoveries ranged from 67.2 to 122.5% (Table 2).
Precision
The repeatability and intermediate precision were evaluated (Table 2). The repeatability of the SLE/LTP-SDME technique for the determination of the pesticides in soil was calculated using the coefficient of variation for seven repetitions of the optimized procedure. This evaluation
involved the same day preparation and analysis of seven soil sample extracts fortified with the analytes at concentrations equivalent to six times the limit of quantification (6 × LOQ) of each pesticide. The intermediate precision was obtained as the coefficient of variation of the peak areas obtained after preparation and analysis of the soil sample extracts fortified with the compounds at levels equivalent to 6 × LOQ on three different days (days 1, 3 and 5) using seven repetitions. The values obtained for the coefficients of variation were lower than 23%, therefore complying with the analytical quality norms established by the Ministério da Agricultura, Pecuária e Abastecimento (MAPA). Table 2 provides the primary results for the parameters obtained during validation of the SLE/LTP-SDME method.
Enrichment factor (EF)
Enrichment of the analytes in the solvent was determined from the analytical curves constructed for each compound. The enrichment factor (EF) ranged from 3 to 93 (Table 2), hence compensating for the dilution caused by the SLE/LTP step. An exception was dieldrin, for which an EF value of one was obtained (for the concentration employed in this study).
A literature search indicated that the studies conducted to date for the analysis of low volatility pesticides present in soil have employed headspace analysis.31 This technique involves heating the sample, therefore requiring the use of organic solvents with higher ebullition points. Furthermore, long extraction times of approximately 60 min are required for the analysis of organochlorine compounds using the headspace method.32 In SDME, the extraction solvents used are hexane or toluene, which have lower ebullition points.33,34 An additional advantage of the new proposed hyphenated technique is that it enables the rapid extraction of low volatility compounds (such as organochlorines) without the need to heat the sample.
Table 2. Figures of merit for validation of the SLE/LTP-SDME method
Linearity
LODa /
(µg kg-1)
LOQb /
(µg kg-1)
Coefficient of variation / % Recovery / %
EFd
Linear working
range / (µg kg-1) r Repeatability
Intermediate
precisionc LOQ 6 × LOQ 12 × LOQ
Trifluralin 0.8 to 9.2 0.994 0.255 0.8 11.4 12.1 90.6 95.3 107.6 12
Lindane 1.2 to 13.5 0.993 0.375 1.2 13.0 14.0 98.6 67.2 69.4 4
Alachlor 0.27 to 3.5 0.994 0.090 0.27 18.8 20.0 83.8 116.5 102.9 66
Methyl parathion 0.6 to 6.5 0.976 0.180 0.6 16.7 16.6 99.9 90.6 86.5 93
Dieldrin 1.0 to 12.0 0.847 0.333 1.0 17.2 19.6 99.5 98.5 99.9 1
Endrin 0.9 to 10.6 0.999 0.295 0.9 17.5 18.0 102.1 122.5 111.1 8
4.4’-DDT 1.8 to 21.3 0.990 0.590 1.8 13.2 22.4 91.8 76.2 99.9 3
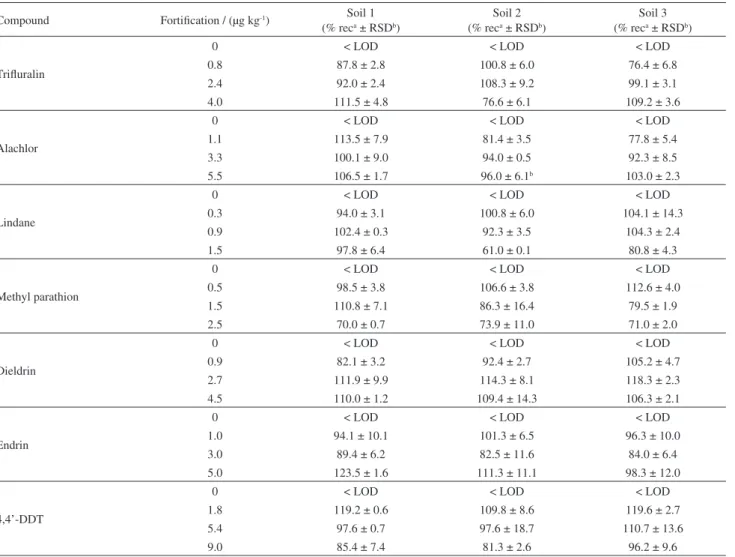
Application of the analytical method using real soil samples
The developed procedure was used for the analysis of three soil samples collected in the municipality of Manhuaçu, an important coffee-growing region of Minas Gerais State where there is intensive use of pesticides. The results showed that the samples were not contaminated by the target compounds. The possible influence of matrix effects on the extraction of the pesticides was evaluated by fortifying the soil samples at concentrations equivalent to 1, 3 and 5 times the LOQ of each pesticide.
The extraction efficiencies obtained for the three soils and the three fortification levels ranged from 61.5 to 123.5% (Table 3). The range of values was greater than that obtained in the validation procedure (Table 2), which was expected because of the differences between the complex matrices of the three soils (and the associated matrix effects), as well as the lower analyte concentrations employed. Therefore, the calculation of recoveries
employed analytical curves constructed for standards prepared in the sample matrix. The analyte identification was made by comparison of standard of pesticides retention time of pure solvent.
Conclusions
Solid-liquid extraction with low temperature partitioning combined with single-drop microextraction is a new extraction technique that, when associated with gas chromatography, enables the multi-residue determination of pesticides in soil. The procedure exploits the benefits of the two extraction techniques, enabling the analysis of a range of pesticides present in complex solid samples with low limits of quantification. The SLE/LTP step enables the cleanup of the sample by removing particulate material and turbidity, while the SDME step concentrates the analytes. In addition, low volatility compounds in solid samples can be determined without requiring heat.
Table 3. Recovery percentages for fortified soil samples
Compound Fortification / (µg kg-1) Soil 1
(% reca ± RSDb)
Soil 2 (% reca ± RSDb)
Soil 3 (% reca ± RSDb)
Trifluralin
0 < LOD < LOD < LOD
0.8 87.8 ± 2.8 100.8 ± 6.0 76.4 ± 6.8
2.4 92.0 ± 2.4 108.3 ± 9.2 99.1 ± 3.1
4.0 111.5 ± 4.8 76.6 ± 6.1 109.2 ± 3.6
Alachlor
0 < LOD < LOD < LOD
1.1 113.5 ± 7.9 81.4 ± 3.5 77.8 ± 5.4
3.3 100.1 ± 9.0 94.0 ± 0.5 92.3 ± 8.5
5.5 106.5 ± 1.7 96.0 ± 6.1b 103.0 ± 2.3
Lindane
0 < LOD < LOD < LOD
0.3 94.0 ± 3.1 100.8 ± 6.0 104.1 ± 14.3
0.9 102.4 ± 0.3 92.3 ± 3.5 104.3 ± 2.4
1.5 97.8 ± 6.4 61.0 ± 0.1 80.8 ± 4.3
Methyl parathion
0 < LOD < LOD < LOD
0.5 98.5 ± 3.8 106.6 ± 3.8 112.6 ± 4.0
1.5 110.8 ± 7.1 86.3 ± 16.4 79.5 ± 1.9
2.5 70.0 ± 0.7 73.9 ± 11.0 71.0 ± 2.0
Dieldrin
0 < LOD < LOD < LOD
0.9 82.1 ± 3.2 92.4 ± 2.7 105.2 ± 4.7
2.7 111.9 ± 9.9 114.3 ± 8.1 118.3 ± 2.3
4.5 110.0 ± 1.2 109.4 ± 14.3 106.3 ± 2.1
Endrin
0 < LOD < LOD < LOD
1.0 94.1 ± 10.1 101.3 ± 6.5 96.3 ± 10.0
3.0 89.4 ± 6.2 82.5 ± 11.6 84.0 ± 6.4
5.0 123.5 ± 1.6 111.3 ± 11.1 98.3 ± 12.0
4,4’-DDT
0 < LOD < LOD < LOD
1.8 119.2 ± 0.6 109.8 ± 8.6 119.6 ± 2.7
5.4 97.6 ± 0.7 97.6 ± 18.7 110.7 ± 13.6
9.0 85.4 ± 7.4 81.3 ± 2.6 96.2 ± 9.6
Acknowledgments
The authors are grateful for the financial support provided by the Brazilian agencies CAPES, CNPq and FAPEMIG (CEX-APQ-01155-13).
References
1. Araújo, S. M. M.; Lemos, R. N. S.; Queiroz, M. E. R.; Nunes, G. S.; Pesticidas: Rev. Ecotox. Meio Amb. 2001, 11, 1. 2. Brondi, S. H. G.; Lanças, F. M.; J. Braz. Chem. Soc. 2005, 16,
650.
3. Gonçalves, C.; Alpendurada, M. F.; Talanta2005, 65, 1179. 4. Rashid, A.; Nawaz, S.; Barker, H.; Ahmad, I.; Ashraf, M.;
J. Chromatogr. A2010, 1217, 2933.
5. Babić, S.; Petrović, M.; Kastelan-Macan, M.; J. Chromatogr. A 1998, 823, 3.
6. Bouaid, A.; Ramos, L.; Gonzalez, M. J.; Fernández, P.; Cámara, C.; J. Chromatogr. A2001, 939, 13.
7. Lambropoulou, D. A.; Albanis, T. A.; Anal. Chim. Acta2004,
514, 125.
8. Tor, A.; Aydin, M. E.; Özcan, S.; Anal. Chim. Acta2006, 559, 173.
9. Papadakis, E. N.; Papadopoulou-Mourkidou, E.; J. Chromatogr.
A2002, 962, 9.
10. Bandoniene, D.; Gfrerer, M.; Lankmayr, E. P.; J. Biochem.
Biophys. Methods2004, 61, 143.
11 Andreu, V.; Picó, Y.; TrAC, Trends Anal. Chem. 2004, 23, 772. 12. Lesueur, C.; Gartner, M.; Mentler, A.; Fuerhacker, M.; Talanta
2008, 75, 284.
13. Pinto, C. G.; Laespada, M. E. F.; Martín, S. H.; Ferreira, A. M. C.; Pavón, J. L. P.; Cordero, B. M.; Talanta2010, 81, 385.
14. Masiá, A.; Vásquez, K.; Campo, J.; Picó, Y.; J. Chromatogr. A 2015, 1378, 19.
15. Bladek, J.; Rostkowski, A.; Miszczak, M.; J. Chromatogr. A 1996, 754, 273.
16. Rouvière, F.; Buleté, A.; Cren-Olivé, C.; Arnaudguilhem, C.;
Talanta2012, 93, 336.
17. Doong, R. A.; Liao, P. L.; J. Chromatogr. A2001, 918, 177. 18. Smith, R. M.; J. Chromatogr. A2003, 1000, 3.
19. Oliveira, A. R. M.; Magalhães, I. R. S.; Santana, F. J. M.; Bonato, P. S.; Quím. Nova2008, 31, 637.
20. Xu, L.; Basheer, C.; Lee, H. K.; J. Chromatogr. A2007, 1152, 184.
21. Amvrazi, E. G.; Tsiropoulos, N. G.; J. Chromatogr. A2009,
1216, 2789.
22. Goulart, S. M.; Queiroz, M. E. L. R.; Neves, A. A.; Queiroz, J. H.; Talanta2008, 75, 1320.
23. Vieira, H. P.; Neves, A. A.; Queiroz, M. E. L. R.; Quím. Nova
2007, 30, 535.
24. Sousa, F. A.; Costa, A. I. G.; Queiroz, M. E. L. R.; Teófilo, R. F.; Neves, A. A.; Pinho, G. P.; Food Chem. 2012, 135, 179. 25. Pinho, G. P.; Neves, A. A.; Queiroz, M. E. L. R.; Silvério, F. O.;
Food Chem. 2010, 121, 251.
26. http://sitem.herts.ac.uk/aeru/iupac/ accessed in June 2015. 27. Soares, C. E S.; Neves, A. A.; Queiroz, M. E. L. R.; Oliveira,
A. F.; Costa, A. I. G.; Assis, R. C.; Andrade, C. E. O.; J. Braz.
Chem. Soc. 2014, 25, 2016.
28. Goulart, S. M.; Alves, R. D.; Neves, A. A.; Queiroz, J. H.; Assis, T. C.; Queiroz, M. E. L. R.; Anal. Chim. Acta2010, 671, 41. 29. Pinho, G. P.; Neves, A. A.; Queiroz, M. E. L. R.; Silvério, F.
O.; Food Control2010, 21, 1307.
30. Magalhães, E. J.; Queiroz, M. E. L. R.; Penido, M. L. O.; Paiva, M. A. R.; Teodoro, J. A. R.; Augusti, R.; Nascentes, C. C.;
J. Chromatogr. A2013, 1309, 15.
31. Salemi, A.; Rasoolzadeh, R.; Nejad, M. M.; Vosough, M.; Anal.
Chim. Acta2013, 769, 121.
32. Prates, C. B.; Gebara, S. S.; Ré-Poppi, N.; Quím. Nova2011,
34, 1260.
34. Cortada, C.; Vidal, L.; Tejada, S.; Romo, A.; Canals, A.; Anal.
Chim. Acta2009, 638, 29.
34. Carlos, E. A.; Alves, R. D.; Queiroz, M. E. L. R.; Neves, A. A.;
J. Braz. Chem. Soc.2013, 24, 1217.
Submitted: April 26, 2015