Article
Printed in Brazil - ©2015 Sociedade Brasileira de Química0103 - 5053 $6.00+0.00A
*e-mail: [email protected]
New and Sensitive Electroquantification of Sulfentrazone in Soil by
Differential-Pulse Voltammetry
Mariana N. Catrinck,a Leonardo L. Okumura,*,a Antonio A. Silva,a Adelir A. Saczkb and
Marcelo F. Oliveirac
aUniversidade Federal de Viçosa, 36570-000 Viçosa-MG, Brazil
bUniversidade Federal de Lavras, 37200-000 Lavras-MG, Brazil
cDepartamento de Química, Universidade de São Paulo, 14040-901 Ribeirão Preto-SP, Brazil
In this work, a new and sensitive electroanalytical methodology was developed and validated to quantify sulfentrazone in soil samples. Sulfentrazone was initially characterized qualitatively using cyclic voltammetry (CV). Its oxidation occurred by diffusion (mass transport) on a glassy carbon electrode (GCE) via irreversible transfer of one electron close to a peak potential of +0.936 V vs. Ag|AgCl, 3.0 mol L-1 KCl, in 0.10 mol L-1 KOH. Differential-pulse voltammetry (DPV) was the most sensitive and selective technique, with limits of detection (LOD) of 1.94 and 2.19 mmol L-1 and limits of quantification (LOQ) of 6.46 and 7.31 mmol L-1, in the absence and presence of soil matrix, respectively. The reproducibility of the method ranged between 2.65 and 4.2%, with intermediate precision between 5.32 and 10.9%. The recovery rate ranged between 88.5 and 103%. Additionally, the accuracy of the electroanalytical method was validated by comparing the results with data from a standard analytical methodology of high-performance liquid chromatography (HPLC/UV-Vis).
Keywords: voltammetry, sulfentrazone, glassy carbon electrode, differential-pulse voltammetry
Introduction
The increasing world population and the consequent need to boost food production have revolutionized the techniques employed in agricultural practice. One of the most important changes in this field has been the
use of pesticides along with fertilizers.1 About 600
active ingredients are used in agrochemical formulations applied worldwide, 350 of which comprise 98% of the most commonly employed pesticides, which are also the major constituents of agrochemicals with routine application in South American agriculture, including
Brazil.2 As far as chemical features are concerned, these
agrochemicals are very diverse with different functional groups, which are responsible for different mechanisms of action, biotransformation and elimination. Some classes of chemicals consist of organochlorines, carbamates, organophosphates, pyrethroids, urea derivatives, nitro compounds and bipyridyls, some of which pose health and
environmental risks.3
Despite the growing concern about contamination of natural resources due to inappropriate farming practices, about 60-70% of the pesticides applied in agricultural
fields do not reach the target surface.4 Instead, they
eventually reach the soil directly or indirectly, where
they accumulate.5 In this environment, these compounds
are prone to sorption, leaching, and/or degradation by physical, chemical and biological processes. Their
permanence in soil will depend on the local conditions.6
Additionally, the vast Brazilian territory includes different classes of soil, which vary in terms of physical and chemical properties. Even the same soil may exhibit different characteristics depending on depth, which affects
herbicide retention and degradation.7
Among the herbicides that have long half-lives in soil and that have found application in large areas in Brazil,
sulfentrazone, or (N
-[2,4-dichloro-5-[4-(difluoromethyl)-4,5-dihydro-3-methyl-5-oxo-1H-1,2,4-triazol-1-yl] phenyl]
methanesulfonamide) (Figure 1), stands out.5 However, no
the oxidation of protoporphyrinogen (IX) to protoporphyrin
(IX) in chlorophyll biosynthesis.8
The analytical methods that have been recently reported in the literature for the determination of sulfentrazone in soil matrix rely on gas chromatography (GC) and high-performance liquid chromatography (HPLC) coupled
with various detectors, such as electron capture,9 mass
spectrometry10 and diode array.11,12
Despite being versatile, sensitive and efficient, chromatographic methods are expensive and time-consuming. Another issue is that it is not possible to directly apply chromatographic procedures to the analysis of concentrated samples, which would degrade the column and impair performance. Indeed, chromatographic methods
can only measure residual levels in water, soils and crops.13
In recent years, researchers have conducted many studies aiming to develop sufficiently selective, sensitive, precise, accurate and inexpensive methods that can rapidly detect agrochemicals in various matrices. Among many reported analytical techniques, electrochemical methods are highlighted. They provide rapid and reliable results while consuming small amounts of reagent and generally
dismissing complicated sample preparation steps.14 In 1970,
Hance15 pioneered the use of electrochemical techniques
to determine pesticide residues. In his work, he used polarography to investigate the electrochemical behavior of 35 herbicides in five different supporting electrolyte solutions. He noted that 28 out of those 35 pesticides were electroactive for some electrolytes, which allowed him to construct standard curves and apply them to the analysis of real water samples.
To the best of our knowledge, no reports of a quantitative method to analyze sulfentrazone in soil matrices exist. On
the other hand, the manuscript proposed by Lima et al.16
was the characterization of the electrochemical behavior of sulfentrazone in protic media and the subsequent determination of its degradation and toxicity products using single stranded DNA as biosensor. Nevertheless, there was no indication in his work on the matrix that was used to prepare the calibration curve and which voltammetric analysis was made (real samples). Therefore, in the present study we attempted to establish an accurate, simple and sensitive electroanalytical method to determine
sulfentrazone in soil samples using a voltammetric-based methodology.
Experimental
Reagents and sulfentrazone stock solutions
All chemicals were analytical grade and were used without any further purification. Ultrapure water obtained on a Millipore Milli-Q system (USA) was employed in all analytical and electrochemical assays, and also to construct the analytical curves. High-purity sulfentrazone
(N
-[2,4-dichloro-5-[4-(difluoromethyl)-4,5-dihydro-3-methyl-5-oxo-1H-1,2,4-triazol-1-yl]-phenyl]
methane-sulfonamide, Figure 1) was used as received from Sigma-Aldrich (Pestanal, analytical standard, USA). The
sulfentrazone stock solution (i.e., 20.00 mmol L-1) was
prepared in methanol (Fisher, HPLC grade, USA) on a daily basis; it was added to the system by direct transfer of quantitative aliquots and completion to a final volume of 10.0 mL in a conventional voltammetric cell.
Sodium hydroxide (99.0%) and potassium chloride (97.0%) were purchased from Synth (Brazil); potassium hydroxide (85.0%), lithium chloride (99.0%), chromium chloride (III) (97.0%), potassium nitrate (99.0%), ammonium chloride (99.5%) and dimethylformamide (DMF) were obtained from Vetec (Brazil). Hydrochloric acid and nitric acid, with purity of 36.5% and 65%, respectively, were acquired from Vetec (Brazil). Carbonate buffer (pH 10) and
tetrabutylammonium tetrafluoroborate (TBABF4) with purity
of 95.0% were provided by ACROS Organics (Belgium). Aqueous solutions of sulfuric acid (95.0%) and sodium chloride (97.0%) provided by Vetec (Brazil) were also used.
Soil samples
Soil samples were collected from the experimental field “Diogo Alves de Mello”, located in the Federal University of Viçosa (Viçosa, Minas Gerais, Brazil), with latitude 20°46’3”N and longitude 42º52’20”W. All samples were collected from layers located 0.0 to 20.0 cm away from the soil surface, air-dried, sieved through a 2 mm mesh sieve and stored in dark polyethylene containers in a freezer at –20 ºC. Tables 1 and 2 present the chemical and physical data from the analysis of the soil samples. All analyses were carried out in the Laboratório de Análises de Solo e Plantas (UFV/ DPS/Viçosa), according to the methodology established by
the Instituto Agronômico de Campinas (IAC).17 Additionally,
an overview of all employed methods are shown, such as: pH measurement with Digimed pHmeter, model DM-22; determination of P and K by the Mehlich 1 extraction and
N
N N
F
F O
Cl Cl
N H
S O
O
1 2
4
after molybdenum blue reaction, with product monitoring at
660 nm; Ca2+ and Mg2+ were extracted with 0.1 mol L-1 KCl
solution and determined by complexometric titration
with EDTA; Al3+ was also extracted with 0.1 mol L-1 KCl
solution and determined by acid-base titration with NaOH; H + Al (soil acidity potential) and SB (sum of bases) was determined by acid-base titration with NaOH; CTC(t) (cation exchange capacity), CTC(T) (cation exchange capacity at pH 7), V (base saturation) and m (aluminum saturation) theoretical values were obtained from H + Al and SB results; OM (organic matter) value was obtained by redox titration with K2Cr2O7.
Voltammetric measurements
Voltammetry was performed on a PGSTAT 128 N Autolab potentiostat (Eco-Chemie, Utrecht, The Netherlands) interfaced with a microcomputer operating with a General Purpose Electrochemical System (GPES) software (Version 4.9) for data acquisition. An electrochemical cell
containing 0.10 mol L-1 KOH as supporting electrolyte and
equipped with Ag|AgCl| 3.0 mol L-1 KCl reference electrode,
a Pt wire auxiliary electrode, and a glassy carbon working
electrode with geometric area of 0.071 cm2 were used for all
measurements. All electrodes were acquired from Metrohm (Switzerland). Oxygen was removed by bubbling purified nitrogen gas through the solution in all experiments. Before each voltammetric measurement, the glassy carbon surface was polished with alumina 0.3 and 0.05 µm (Buehler, USA) on an alumina polishing pad for 3 min, rinsed with purified water, and sonicated for 5 min in methanol.
Electrochemical detection of sulfentrazone
Three voltammetric modes were applied to detect sulfentrazone, such as linear sweep voltammetry (LSV),
differential-pulse voltammetry (DPV), and square-wave voltammetry (SWV). All measurements were carried out at 25.0 ± 0.1 ºC, at least in triplicate. The voltammetric parameters were optimized, and the analytical curve was constructed by adding aliquots of sulfentrazone stock solution (to obtain concentrations ranging from 1.00 to
100 mg L-1) into the electrochemical cell containing the
supporting electrolyte solution. The analytical curves were obtained via linear regression least-square fit data,
by plotting the current peak versus the concentration
of sulfentrazone in two different situations: (i) addition
of standard solution only and (ii) addition of standard
solution in the presence of the soil matrix. To construct the calibration curve in the presence of soil matrix for sulfentrazone using the DPV technique, 10.0 mL of the
supporting electrolyte solution containing 0.10 mol L-1
KOH was added into the assay tube containing 2.00 g of soil. Then, the tube was subjected to vertical stirring for 1 h, at room temperature. After stirring, the tube contents were transferred to the electrochemical cell, without any separation or filtration step, and measurements were made so as to obtain the desired concentrations of sulfentrazone,
varying from 1.00 to 100.0 mg L-1. Additionally, HLPC
experiments were also accomplished to study the accuracy (reproducibility and repeatability) of the proposed electroanalytical method and to validate it.
HPLC conditions
The conditions employed during chromatographic analysis were: mobile phase consisting of water (acidified with 0.01% phosphoric acid) and acetonitrile, at a
50:50 (v/v) ratio; flow rate of 1.0 mL min-1; injection
volume: 20 µL; column temperature: 30 °C; wavelength: 214 nm. All analyses were performed in triplicate in
a Shimadzu C18 column. The sulfentrazone signal was
identified by comparison of the retention time with that of an authentic sample. Quantification was performed by comparing the areas in the chromatograms of the extracts with those obtained via the standard method of external calibration. The results obtained from the apparent recovery test conducted by using the voltammetric method were statistically compared with those from the chromatographic
Table 1. Chemical composition of the arable layer (0-20 cm) of the soil used in the experiments
pH Chemical composition / (mmol L
-1)
Ve / % mf / % OMg /
(dg kg-1)
P K Ca2+ Mg2+ Al3+ H + Ala SBb CTC (t)c CTC (T)d
6.40 0.15 2.86 0.72 0.18 0.00 0.28 1.92 1.92 2.20 63.0 0 3.50
aH + Al: soil acidity potential; bSB: sum of bases; cCTC(t): cation exchange capacity; dCTC(T): cation exchange capacity at pH 7; eV: base saturation; fm:
aluminum saturation; gOM: organic matter.
Table 2. Physical composition of the arable layer (0-20 cm) of the soil used in the experiments
Clay / (g kg-1) Silt / (g kg-1) Sand / (g kg-1) Textural
classification
tests. The F (Fisher-Snedecor) and Student’s t-tests at 95% confidence level were employed.
Results and Discussion
Electrochemical behavior of sulfentrazone
Initially, it was established which electrolyte solution was suitable to determine sulfentrazone by electrolysis in
0.10 mol L-1 solutions of NaOH, KOH, KCl, KNO
3, HCl,
H2SO4, acetate buffer pH 5.0, phosphate buffer pH 7.0 and
DMF/tetrabutylammonium tetrafluoroborate.
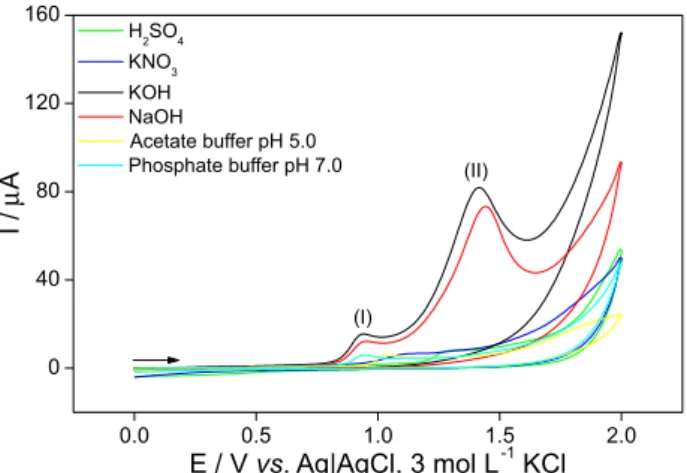
There were no voltammetric responses for sulfentrazone (oxidation or reduction) in KCl, HCl and non-aqueous DMF/tetrabutylammonium tetrafluoroborate solutions. Moreover, the anodic potential scans presented in Figure 2 revealed that cyclic voltammetry offered better responses in terms of current intensity for KOH, NaOH and phosphate buffer solution (pH 7.0).
The responses of the tested supporting electrolyte
solutions of NaOH, KOH, KNO3, H2SO4, acetate buffer
pH 5.0 and phosphate buffer pH 7.0 were compared with
respect to the anodic current intensity (Ipa), to evaluate
and select the best conditions for further studies on the electrochemical behavior of sulfentrazone in the positive potential window. Figure 2 also compares the peak currents and peak potentials obtained for sulfentrazone in each supporting electrolyte solution.
In accordance with the studies carried out by Lima et al.,16
sulfentrazone is a weak acid and the acid-base equilibrium is related to the N-2 iminium-imine group on the triazine ring. The structure of sulfentrazone has four nitrogen
groups. The GC-MS experiments performed by Lima et al.
identified (A or B) and C (Scheme 1) as the main products of the electrolysis of sulfentrazone in aqueous medium with pH 7.0. A captodative effect stabilizes the cation-radical based on N-4 in the triazine nucleus after the first electron oxidation. The release of difluorocarbene, revealed
by GC-MS, is expected from an α-elimination from the
ylide group [R−C=N+−N+−CF
2-], since difluorocarbene
is a relatively stabilized structure, due to the interaction of the lone pairs of its two fluorine substituents with the carbene center. In summary, the electrooxidation process is followed by hydration or oxidation of the methyl group on the heterocycle and ring opening of the triazole group, as shown in Scheme 1.
At the moment, it is impossible to assign the origin of the anodic peak potential (I and II) of the sulfentrazone as being only the presence of the substance C in the proposed Lima’s scheme. Nevertheless, a simple explanation for this conflicting behavior is not available at this stage.
At +0.94 V (peak I), KOH and NaOH gave similar responses in terms of anodic peak potential, with lower standard deviation in the replicates. Hence, KOH was chosen to be used as supporting electrolyte during the
R Cl
N
N N O
CH3
F
F
R Cl
N
HN NH O
CH2OH
R Cl
N
HN NH O
R Cl
N
NH2
NH2
O Cl
Cl Cl
OH
CH3
Cl
R = -NHSO2CH3
Sulfentrazone
A
B
C or
[O]
-:CF2
Scheme 1. A possible route for the electrochemical oxidation of sulfentrazone.
0.0 0.5 1.0 1.5 2.0
0 40 80 120 160
H2SO4 KNO3 KOH NaOH
Acetate buffer pH 5.0 Phosphate buffer pH 7.0
I /
µ
A
E / Vvs. Ag|AgCl, 3 mol L-1KCl (I)
(II)
Figure 2. Cyclic voltammograms obtained with the GCE using 0.10 mol L-1 solutions of: KOH; NaOH; KNO
3; phosphate buffer pH 7.0;
acetate buffer pH 5.0 and H2SO4 as the supporting electrolyte solution in
the analysis of 1.00 mmol L-1 of sulfentrazone.
0.0 0.5 1.0 1.5 2.0
0 40 80 120 160
H2SO4
KNO3
KOH NaOH
Acetate buffer pH 5.0 Phosphate buffer pH 7.0
I /
µ
A
E / Vvs. Ag|AgCl, 3 mol L-1KCl
(I)
development of the proposed electrochemical methodology, because this condition provided the best value of current intensity and selectivity. Besides, the oxidation peak potential at approximately +1.40 V (peak II) seems to be more suitable for electroanalytical purposes. Nevertheless, the peak potential I was chosen because of the improved selectiveness and robustness to the voltammetric method under such condition.
In order to prove that sulfentrazone is in its original and non-protonated form, according to the proposition shown in Scheme 1, calculations on the AlfaDist.12v.7
spreadsheet18 were made to determine the distribution of
species in terms of pKa. Since the pKa of sulfentrazone is
6.56 and the pH of the 0.10 mol L-1 KOH solution is roughly
13, after pH 8 the sulfentrazone is in the molecular form, which is the appropriate form to be analyzed according to these calculations.
Once the parameters defined above were fixed, three types of working electrodes were tested: glassy carbon (GCE), gold (Au), and boron-doped diamond (BDD) in cyclic voltammetry (CV) experiments. First, the voltammogram of the blank was recorded; then, voltammetric readings were conducted at least three times,
using 1.00 mmol L-1 sulfentrazone. The GCE was selected
to develop the methodology because it afforded sharper peaks, lower peak potential values, high current intensity, and better repeatability (RSD lower than 2%) between voltammetric measurements as compared with the other electrodes.
The electrochemical behavior of sulfentrazone was also investigated by CV on GCE between +0.00 V and +1.20 V,
using a 0.10 mol L-1 KOH supporting electrolyte solution. A
well-defined anodic peak was detected near +0.94 V using
a scan rate (ν) of 100 mV s-1, which was attributed to the
oxidation of the herbicide. The absence of a cathodic peak potential in the reverse scan suggested that sulfentrazone oxidation involved an irreversible electron transfer, or that coupled chemical reactions occurred after the electrodic
process.19
We verified linear relationships between the anodic
current peak (Ipa) and the square root of the scan rate (ν1/2)
for the anodic peak potential obtained at +0.94 V. This linear relationship between peak current and square root of the scan rate indicates that the electrode process is controlled
by mass transport.20 If the applied potential is large enough,
the electron transfer kinetics will increase to the point where
the current is under diffusion control, and Ipa is linear with
ν1/2, even in the case of irreversible systems.
The current function (Ipa/ν1/2) also remained virtually
constant for all the anodic peaks registered under different scan rates, indicating an irreversible electron transfer
process (which means complicated charge transfer
reactions).21
Still regarding CV diagnostics, the peak current reduced significantly after the second sweep, but remained
unchanged after the 10th cycle (with no visible anodic peak
potential). This phenomenon may have stemmed from adsorption of sulfentrazone or its redox products at the electrode surface, which culminated in fouling behavior of the GCE electrode. Therefore, for analytical purposes, the voltammogram corresponding to the first cycle were always recorded.
According to Brett,22 it is possible to calculate the
theoretical number of electrons transferred in the redox process using experimental DPV data and equation 1:
1/2
3.52RT W
nF
= (1)
where n is the number of electrons transferred, F is Faraday’s
constant (96485.3399 C mol-1), T is the temperature in Kelvin
(298 K), R is the general gas constant (8.314 J K-1 mol−1),
W1/2 is the width at half potential peak height for the
electrochemical process (obtained experimentally). Using equation 1, the value of n was calculated as 1.00 (replicates = 3). Hence, one electron was transferred from the analyte to the surface of the glassy carbon and gold electrode during sulfentrazone oxidation (strictly for the peak I).
Optimization of SWV, LSV and DPV conditions for sulfentrazone analysis
Figure 3 illustrates the best voltammogram undertaken after an evaluation of the optimal parameters for the SWV, LSV and DPV techniques regarding sulfentrazone analysis. Lower sulfentrazone concentrations led to sharper and better defined peaks as well as smaller background current, as compared with CV and LSV, which resulted in improved resolution. Hence, it was possible to apply these techniques to the quantitative analysis of sulfentrazone.
the best voltammogram for sulfentrazone analysis: the peak currents increased up to 100 Hz and remained stable thereafter, with slight reduction in peak current and no deformation in the voltammetric shape of the sulfentrazone oxidation peak. Finally, by fixing the amplitude at 40 mV and the frequency at 100 Hz, the effect of potential step increment was investigated in the 1-15 mV range. Potential steps higher than 10 mV resulted in constant sulfentrazone current peak height until 15 mV. Therefore, the optimal conditions for sulfentrazone analysis at the GCE were amplitude of 40 mV, frequency of 100 Hz and potential step of 10 mV, which corresponded to an effective scan rate of
100 mV s-1.
The DPV mode using GCE was also evaluated. The
optimized parameters were: scan rate of 40 mV s-1 (studied
range: 2-75 mV s-1), amplitude of 100 mV (studied range:
10-150 mV), and pulse time of 2 ms (studied range:
2-20 ms), in 0.10 mol L-1 KOH supporting electrolyte
solution.
Finally, the LSV mode using GCE was also assessed.
The optimized parameters were: scan rate of 200 mV s-1
(studied range: 10-200 mV s-1) and potential step of
1 mV (studied range: 1-30 mV). Comparison of the voltammograms obtained for sulfentrazone oxidation using the different techniques showed that DPV provided the best results regarding the intensity of the anodic current (Figure 3). Therefore, several differential-pulse voltammograms were registered for sulfentrazone oxidation at different concentrations for quantification purposes.
Voltammetric methodology and analytical curves
As already mentioned, in 1.00 mmol L-1 sulfentrazone
standard solution, the current peak obtained in the DPV mode was higher than those achieved by SWV and
LSV. The DPV technique yielded the best selectivity and sensitivity, as well as better-defined anodic peak at
+0.88 V versus Ag|AgCl| 3.0 mol L-1 KCl (Figure 3).
Sulfentrazone was determined by DPV (sulfentrazone
concentrations ranging from 1.00 to 100 mg L-1) under the
optimized conditions, aiming for better electrochemical reproducibility. Analytical curves were then obtained for this substance.
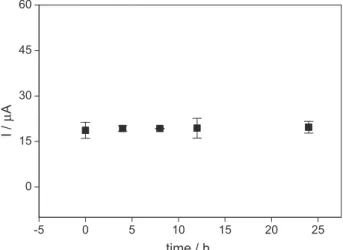
After checking the possibility of direct analysis of the herbicide in the soil matrix and in its absence, an investigation was made on whether sulfentrazone sorption and/or degradation occurred in the soil under the conditions of analysis. The graph depicted in Figure 4 shows that the
peak current (Ip) remained practically constant along the
contact with 130 mmol L-1 sulfentrazone. Therefore, no
herbicide sorption and/or degradation in the soil occurred under the analytical conditions for a period of 24 h. After ensuring that there was no herbicide sorption and/or degradation during the study period, the time required to extract the analyte from the soil matrix for voltammetric purposes was investigated. Sulfentrazone desorbed
immediately after contact with the 0.10 mol L-1 KOH
electrolyte support solution, and the current intensity (Ip)
remained almost constant over a period of 5 h.
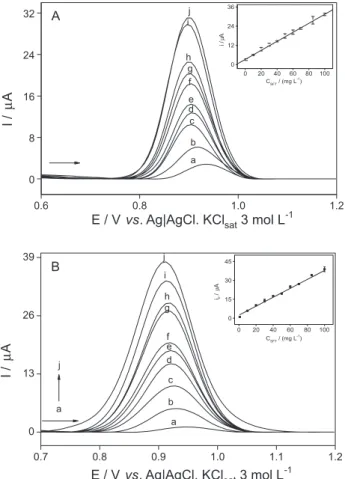
Figure 5 presents the analytical curves for this particular study. Good linear response was achieved for all concentrations, according to the linear regression least-square fit equations listed in Table 3. Two analytical curves were obtained using the electroanalytical method developed
herein, as follows: (i) DPV for sulfentrazone with no
soil matrix, i.e., using only the standard sulfentrazone in
supporting electrolyte solution (Figure 5A); (ii) DPV for
sulfentrazone with soil matrix, to verify how the matrix
0.0 0.2 0.4 0.6 0.8 1.0 1.2
0 20 40 60 80 100 120 140
(a) (b) (c)
E / Vvs. Ag|AgCl, 3 mol L-1KCl
I /
µ
A
Figure 3. Comparison between (a) LSV; (b) SWV and (c) DPV experiments in optimized conditions for 1.00 mmol L-1 SFT at GCE in
0.10 mol L-1 KOH.
-5 0 5 10 15 20 25
0 15 30 45 60
I /
µ
A
time / h
Figure 4. Sorption/degradation assessment of 130 mmol L-1 sulfentrazone
in soil matrix in the presence of KOH 0.10 mol L-1 supporting electrolyte
solution using GCE and DPV. Electrochemical conditions were scan rate: 40 mV s-1; amplitude: 100 mV; time of pulse: 2 ms.
0.0 0.2 0.4 0.6 0.8 1.0 1.2
0 20 40 60 80 100 120 140
(a) (b) (c)
E / Vvs. Ag|AgCl, 3 mol L-1KCl
I /
µ
A
Figure 3. Comparison between (a) LSV; (b) SWV and (c) DPV experiments in optimized conditions for 1.00 mmol L-1 SFT at GCE in
affected the sulfentrazone electrochemical response (Figure 5B). All these assays were performed with the same sulfentrazone concentration range that had been employed to construct all analytical curves during the development of the analytical method.
Better limits of detection (LOD) and quantification (LOQ) were obtained for the analytical curve in the absence of the matrix (soil) as compared with the results achieved in the presence of the matrix. Therefore, the intensity of the peak current was more sensitive to sulfentrazone concentration in the absence of soil. The matrix effect was evaluated statistically by testing the
model identity. According to Regazzi,23 a model identity
test can be applied in order to evaluate whether a set of equations may be represented by a common equation. However, there was a significant difference between
the two calibration curves (p < 0.001); therefore, it
was concluded that there was a matrix effect. Then, the analysis must be performed by the standard addition method (spike).
The two analytical curves shown above evidence this slightly different sensitivity after fast comparison of the two slopes obtained for sulfentrazone analysis, as indicated in Table 3.
LOD and LOQ for sulfentrazone (Table 4) were
determined using the equations LOD = 3 × sy/x / b and
LOQ = 10 × sy/x / b, where sy/x and b are the estimated
standard deviation of the blank (n = 12) and the slope of the analytical curve, respectively, with a 95% (K = 3)
confidence level.24 These results attested to the analytical
potentiality of the DPV technique with respect to sulfentrazone determination in the absence and in the presence of soil samples that lie below the maximum residue limits (MRL) established by the Brazilian legislation.
Finally, satisfactory precision was obtained with the developed technique: repeatability of the current peak and peak potential (expressed as the percentage coefficient of variation) of several independent determinations on three samples of soil in different concentration levels over the same day) gave lower than 5% in all cases (triplicate experiments, at least). Likewise, the reproducibility of the current peak and peak potential as a result of eight independent determinations on two different samples over five days (in triplicate) was lower than 5%. In terms of accuracy, expressed as relative error, the coefficient of variation was in the order of 1-3%.
Table 3. Linear regression least-square fit data of the analytical curves for quantitative determination of sulfentrazone using the DPV method
Matrix Linear regression least-square fit r2
Absence Ip (A) = 3.22 ×10⁻⁶ + 2.82 ×10⁻⁷ CaSFT 0.997
Presence Ip (A) = 2.37 ×10⁻⁶ + 3.54 ×10⁻⁷ CSFT 0.990
aC
SFT: concentration of sulfentrazone in mg L-1.
0.6 0.8 1.0 1.2
0 8 16 24
32 A
0 20 40 60 80 100
0 12 24 36
i /
µ
A
j i
h g f
e d c
b
I /
µ
A
E / Vvs. Ag|AgCl. KCl
sat3 mol L
-1
a
0.7 0.8 0.9 1.0 1.1 1.2
0 13 26 39
0 20 40 60 80 100
0 15 30 45
ip
/
µ
A
C C
SFT SFT
/ (mg L / (mg L
-1 -1
) )
j
i
h g
f e d
c
b
I /
µ
A
E / Vvs. Ag|AgCl. KCl
sat3 mol L
-1
a j
B
a
Figure 5. Analytical curves in the absence of soil (A) DPV electrooxidation of sulfentrazone at different concentrations: blank; (a) 5.0; (b) 10.0; (c) 20.0; (d) 30.0; (e) 40.0; (f) 50.0; (g) 60.0; (h) 70.0; (i) 85.0 and (j) 100.0 mg L-1 and in presence of soil; (B) DPV electrooxidation of
sulfentrazone at different concentrations: as stated above. Conditions: GCE in 0.10 mol L-1 KOH as supporting electrolyte solution.
Table 4. Limits of detection and quantification and other analytical parameters
Matrix b Sb
LOD LOQ
(mg L-1) (mg kg-1) (µmol L-1) (mg L-1) (mg kg-1) (µmol L-1)
Absence 2.82 × 10⁻⁷ 7.06 × 10⁻⁸ 0.750 − 1.94 2.50 − 6.46
Determination of sulfentrazone in soil samples by DPV
Soil samples were analyzed under the same conditions as those employed to construct the analytical curves in
0.10 mol L-1 KOH using GCE. To assess the applicability
of the proposed voltammetric-based method to the analysis of soil samples, three samples of soils were studied. The voltammograms were examined in sample solutions containing the supporting electrolyte and various aliquots of the soil matrix solutions. No anodic peak was detected for the samples, which demonstrated that detectable residues of sulfentrazone did not exist in these matrices.
The procedures for sulfentrazone analysis followed the standard addition method carried out after addition of known amounts of sulfentrazone to various samples (five consecutive additions to final concentrations of 5.0,
10.0, 15.0, 20.0 and 25.0 mg L-1) containing the proposed
contaminated samples in three different levels (5.0, 40.0
and 75.0 mg L-1). The results clearly demonstrated a
linear relationship for all the samples evaluated by DPV. The electrochemical response was also satisfactory. The recoveries from different samples lay in the range of 88.5 to 103% for DPV and 85.9 to 116% for HPLC (Table 5).
On the basis of these recovery experiments, it could be concluded that deviations in the recovery values were due to random errors, since values were higher and lower than expected, demonstrating that this methodology is not biased or does not incur systematic errors.
Moreover, the results obtained from the apparent recovery tests were compared statistically by the F
(Fisher-Snedecor) and Student’s t-test at 95% confidence
in each concentration level with those obtained from the chromatographic analysis, in order to evaluate the accuracy of the voltammetric proposed method. This statistical comparison demonstrated that no significant differences existed between the results found by the voltammetric proposed methods and validated by HPLC for the apparent recovery assays.
Figure 6 shows the calibration curve in the presence of soil matrix as obtained by HPLC. The equation of the
Table 5. Results of the recovery tests for sulfentrazone using different samples of soils and DPV and HPLC analyses
Concentration added / (mmol L-1)
Recovery / %
DPV HPLC
12.9 94.3-103 109-116
103 88.5-97.2 87.9-102
194 91.7-98.1 85.9-86.4
linear fit for this analysis was obtained as A = 428161.3669
+ 69120.3977 CSFT (mg L-1), with r2 = 0.9990.
Conclusions
A methodology successfully employed involving
unmodified GCE to analyze sulfentrazone in a 0.10 mol L-1
KOH supporting electrolyte solution was established. The GCE carbon surface was highly sensitive to sulfentrazone oxidation, as characterized by the enhanced peak current. Oxidation peak potential at about +0.88 V was suitable for analysis, and the peak current had a linear relationship with sulfentrazone concentrations over a certain range, under the absence and presence of selected matrix conditions. This sensor can be used for the voltammetric determination of the analyte with good reproducibility and
repeatability at concentrations as low as 6.46 mg L-1 and
7.31 mmol L-1, in the absence and in the presence of the
soil matrix, respectively. The unmodified electrode can also be used to determine sulfentrazone in soil samples directly without any cleaning step or pre-concentration. The proposed method was accurate and fast; the reagents and apparatus were simple. In addition, the results obtained during sulfentrazone analysis in spiked soil samples and data from the study about validation with HPLC/UV-Vis detection demonstrated the potential applicability of this electroanalytical method in the analysis of real samples.
Acknowledgments
We are indebted to the Department of Chemistry of the Federal University of Viçosa (UFV) for their support. The authors also gratefully acknowledge the financial
0 2 4 6 8 10
0.0 5.0x10⁵ 1.0x10⁶ 1.5x10⁶ 2.0x10⁶ 2.5x10⁶
0 20 40 60 80 100 0
10 20 30 40 50
Area / (1 x 10
6)
CSFT/ (mg L ) -1
Area
tr/ min 4.592
Figure 6. Analytical curve obtained by HPLC in the presence of soil. Parameters: mobile phase containing H2O/ACN 50:50 (v/v); mobile
rate: 1.0 mL min-1; injection volume: 20 µL; column temperature: 30 ºC;
wavelength: 214 nm and Shimadzu C18 column.
0 2 4 6 8 10
0.0 5.0x10⁵ 1.0x10⁶ 1.5x10⁶ 2.0x10⁶ 2.5x10⁶
0 20 40 60 80 100
0 10 20 30 40 50
Area / (1 x 10
6)
CSFT/ (mg L )
-1
Area
tr/ min
support of CNPq and FAPEMIG. Finally, we would like to thank PhD Cynthia Maria de Campos Prado Manso and PhD Alexandre Gurgel for revising and editing the text.
References
1. Nollet, L. M. L.; Rathore, H. S.; Handbook of Pesticides: Methods of Pesticide Residues Analysis Hardcover, 1st ed.; CRC
Press: Boca Raton, 2009.
2. Richardson, M.; Water Sci. Technol. 1998, 37, 19.
3. Unnevehr, L. J.; Pingali, P. L.; Zilberman, D.; Food Policy 1997, 22, 105.
4. Law, E. D.; J. Electrostat. 2001, 51, 25.
5. Sparks, D. L.; Environmental Soil Chemistry, 1st ed.; Academic
Press: San Diego, 2003.
6. Chiou, C. T.; Partition and Adsorption of Organic Contaminants in Environmental Systems, 1st ed.; Wiley-Interscience: New
Jersey, 2002.
7. Selim, H. M.; Competitive Sorption and Transport of Heavy Metals in Soils and Geological Media, 1st ed.; CRC Press: Boca
Raton, 2012.
8. Dayan, F. E.; Armstrong, B. M.; Weete, J. D.; J. Agric. Food Chem. 1998, 46, 2024.
9. Martinez, C. O.; Silva, C. M. M. S.; Fay, E. F.; Abakerli, R. B.; Maia, A. H. N.; Durrant, L. R.; Braz. J. Microbiol. 2010, 41, 209.
10. Chen, A. W.; ACS Symp. Ser. 2005, 45, 295. 11. Shaner, D. L.; Weed Technol. 2012, 26, 633.
12. Nir, S.; Zadaka-Amir, D.; Kartaginer, A.; Gonen, Y.; Appl. Clay Sci. 2012, 67, 134.
13. Worthing, C. R.; Hance, R. J.; The Pesticide Manual: a World Compendium, 9th ed.; British Crop Protection Council:
Hampshire, 1991.
14. Galli, A.; de Souza, D.; Garbelini, G. S.; Coutinho, C. F. B.; Mazo, L. H.; Avaca, L. A.; Quim. Nova 2006, 29, 105. 15. Hance, R.; Pestic. Sci. 1970, 1, 112.
16. Lima, A. C. A.; Melo, A. M. S.; Pires, E. V.; Ferreira, R. C. S.; Sant’Ana, A. E. G.; Gourlart, M. O. F.; Abreu, F. C.; Chemosphere 2010, 81, 884.
17. http://www.iac.sp.gov.br/publicacoes/porassunto/pdf/ Boletim106.pdf, accessed in June 2015.
18. Oliveira, A. F.; Planilha Excel Simplificada para Cálculo de Graus de Dissociação AlfaDist 12 v7; Universidade Federal de Viçosa, Brasil, 2014.
19. Hammerich, O.; Lund, H.; Organic Electrochemistry, 4th ed.;
CRC Press: New York, 2000.
20. Bard, A. J.; Faulkner, L. R.; Electrochemical Methods: Fundamentals and Applications, 2nd ed.; Wiley: New York,
2000.
21. Nicholson, R. S.; Shain, I.; Anal. Chem. 1978, 36, 706. 22. Brett, C. M. A.; Brett, A. M. O.; Electrochemistry. Principles,
Methods, and Applications, 2nd ed.; Oxford University Press,
1996.
23. Regazzi, A. J.; Pesq. Agropec. Bras. 1996, 1, 1.
24. Miller, J. C.; Miller, J. N.; Statistics for Analytical Chemistry, 2nd ed.; Ellis Horwood Limited: Essex, 1984.
Submitted: March 9, 2015
Published online: June 19, 2015