Article
J. Braz. Chem. Soc., Vol. 26, No. 9, 1798-1803, 2015. Printed in Brazil - ©2015 Sociedade Brasileira de Química 0103 - 5053 $6.00+0.00
A
*e-mail: [email protected], [email protected]
Effects from Gold Electrodes on the Electron-Phonon Coupling of
Poly(
p-
phenylenevinylene) Films
Eralci M. Therézio,*,a Ángel A. Hidalgo,b Osvaldo N. Oliveira Jr.,c Raigna A. Silvad and Alexandre Marlettad
aDepartamento de Matemática, Universidade Federal de Mato Grosso, 78735-901 Rondonópolis-MT, Brazil
bDepartamento de Física, Universidade Federal do Piauí, 64049-690 Teresina-PI, Brazil
cInstituto de Física de São Carlos, Universidade de São Paulo, CP 369, 13560-970 São Carlos-SP, Brazil
dInstituto de Física, Universidade Federal de Uberlândia, CP 593, 38400-902 Uberlândia-MG, Brazil
Interface effects between metal electrodes and organic films are crucial for the overall performance of organic electronics devices. We investigate effects from gold electrodes deposited on spin-coated films of poly(p-phenylene vinylene) (PPV). While a thin Au layer (16 nm) did not affect the absorption and emission spectra of PPV, a 64 nm thick Au layer induced blue shifts in both spectra owing to the reduction in the effective conjugation degree of PPV segments. Upon combining photoluminescence and Raman scattering spectroscopies, we noted that the Au clusters interact preferentially with the phenyl rings of the polymer chain, leading to shifts in the vibrational modes at 1100 and 555 cm-1 and a significant change in the electron-phonon coupling inferred from the Huang-Rhys parameters. These results are consistent with theoretical predictions in ab initio calculations, which imply that the final properties of polymeric devices may be tuned with adequate conditions for electrode deposition.
Keywords: poly(p-phenylene vinylene), metal/polymer interface, electronic structure
Introduction
Conjugated polymers can be used in emissive layers in polymer light emitting diodes (PLEDs), solar cells, and
sensors.1 The possible applications of poly(p-phenylene
vinylene) (PPV) and its derivatives in flat colored displays triggered a number of fundamental studies on the
physical processes in emissive devices,1-3 most of which
comprise a polymer layer between two metal films. The latter may serve either as electrodes for charge injection in electroluminescent devices or mirrors in cavities to manipulate the radiative properties of the emissive species in the polymer. The electronic and optoelectronic properties of the emissive layer depend, basically, on film processing
and polymer/metal interactions,2-6 with the active layer
having a thickness of the order of the wavelength.
Becker et al.7 addressed the problem of thickness-related
interference in such devices, with emphasis on the angular intensity distribution. Moreover, the effect of the cavity, when photoluminescence measurements are carried out
with normal and back scattered geometry and the diffraction index of the substrate is ca. 1.5 (glass), is decreased
substantially and the Beer-Lambert law is valid.8 The
control of the interplay between radiative and non-radiative decay processes is crucial for developing highly efficient devices, which is still a difficult task as many processes are not understood in detail. For instance, the effect from the metal layers on the vibronic structure of the emission spectra is a matter of debate in the literature.
In this paper we studied the effect from varying the thickness of an Au layer deposited on spin-coated PPV films. The vibronic structure in the emission spectra was used to determine the electron-phonon coupling
(Huang-Rys factor, S) and the energy difference between the vibronic
bands of the active phonons. Three effective phonons are believed to be responsible for the vibrational bands. The
parameter S was estimated fitting the emission spectra for
all sample conditions in the scope of the semi-empirical molecular-exciton theory. Raman spectroscopy was performed to investigate the vibrational modes (ca. 550
and ca. 1100 cm-1) in the Au/PPV system. The investigation
applying reverse electrodes in solar cells because the organic interfacial layer at metal/inorganic semiconductor structures plays an important role in determining the main
parameters of the devices.9,10
Experimental
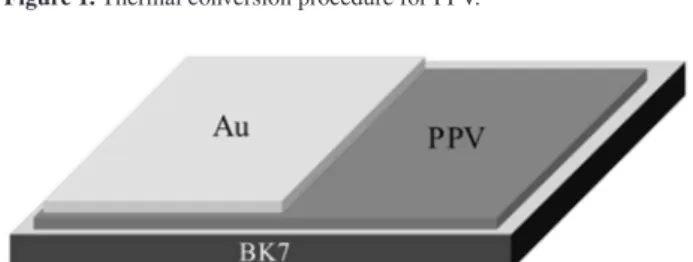
PPV films were obtained from the soluble precursor poly(xylylidene tetrahydrothiophenium chloride) (PTHT) that was thermally converted into PPV at high temperatures (> 200 °C). Figure 1 shows the chemical structure of PTHT and PPV monomers and the thermal conversion process. Spin-coated films of PTHT on glass substrates (BK7) were obtained and thermally converted to PPV under vacuum
(10-3 torr) at 230 °C during 2 h. After thermal conversion,
the Au film was deposited on top of the polymer film. To facilitate analyzing the spectral effects, only one-half of the PPV film was covered with the Au film evaporated at a
pressure of 10-1 mbar, and therefore with the same sample
we could analyze the spectra with and without the Au layer. The Au film had two values of thickness, viz., 16 nm (referred to as Au-thin) and 64 nm (Au-thick), whereas the PPV film had the same thickness in the two samples. Figure 2 shows the layout of the BK7/PPV/Au films.
The absorption spectra in the UV-Vis region were taken with a Shimadzu UV-2501PC spectrometer. For the photoluminescence (PL) spectra an Ocean-optics USB 2000 spectrometer was used, with the samples placed in a
cryostat under 10-3 mbar. The 458 nm line of an argon ion
laser was the excitation source. To avoid interference effects and wave guiding of the emitted light, the samples, the laser beam and the spectrometer were kept at a fixed geometry
during the experiments.7 The Raman spectra were recorded
from 200 to 1800 cm-1 with a multichannel Jobin-Yvon T
64000 spectrometer equipped with a cooled charge-coupled device (CCD) detector. The scattering signal was collected
in the backscattering configuration under a microscope using the excitation laser line at 514.5 nm with a spectral
resolution of 4 cm-1.
Results and Discussion
Figures 3a and 3b show the absorbance spectra in the UV-Vis range for BK7/PPV, BK7/PPV/Au-thin and BK7/PPV/Au-thick films. Basically, the absorbance line
shape is associated with a non-local transition (π→π*) of
PPV segments according to the molecular exciton model.11
The thin Au layer does not affect the absorbance spectrum of PPV, with the statistical distribution of conjugation lengths being preserved. In contrast, the thick Au layer caused a blue shift - owing to a decrease in the effective PPV conjugation degree - and broadening of the absorbance spectrum in comparison with the PPV layer. A similar effect was observed for PPV and derivatives degraded by
photo-oxidation,12 which was attributed to the generation
of carbonyl (C=O) groups. The latter defects induced a decrease in the conjugation degree along the polymer main chain, and therefore we may infer that in this study the interaction between the metal and the phenylene can change the degree of conjugation.
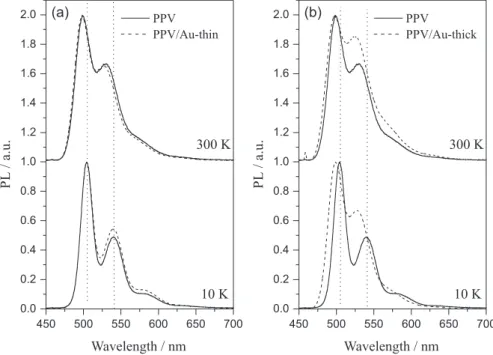
The PPV normalized photoluminescence spectra at 10 and 300 K are shown in Figure 4. For the Au-thin film, the line shape of PPV emission does not change significantly (Figure 4a), and the broadening of the PL spectra at room temperature is attributed to an increased thermal disorder. In contrast, the Au-thick film displays significant changes in the PL spectrum. Since the samples were processed simultaneously, all films may be assumed to have similar average PPV conjugation lengths before the metal deposition (see the spectra in Figure 3). Therefore, the changes induced by the thick metal coating on the relative intensities of the emission bands, mainly at 550 nm, can be attributed to the coupling of the electron vibrational modes. In addition, the electronic structure of PPV was also affected with the increase in temperature, even for the Au-thin film, which caused the blue shift of 5 nm in the PL spectrum. For the Au-thick sample at low temperature, the PL spectrum in Figure 4b is blue-shifted by 4 nm in comparison with the PPV without the metallic
film. Two possibilities can be considered: (i) the deposition
of the thick Au film introduces structural defects along the PPV chains reducing the effective conjugation degree; or
(ii) there is interaction between PPV and the Au clusters.
Upon increasing the sample temperature, the Au-thick layer enhanced the coupling of the electron-vibrational modes and the peak position was almost the same for the two PPV samples with Au-thin and Au-thick layers. CH CH2 T > 200 °C
S Cl n n
–
+
Figure 1. Thermal conversion procedure for PPV.
Since emission of PPV takes place in segments with long
conjugation degrees,13 the presence of the Au-thick layer
reduced the effective PPV conjugation degree and increased the electron-phonon coupling.
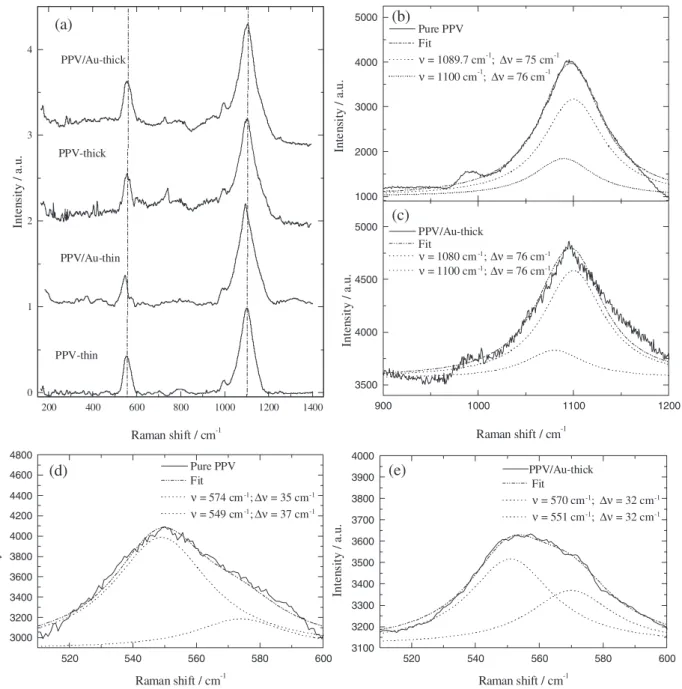
The effects from the Au-layer on vibrational modes of PPV were investigated using Raman spectroscopy. The spectra in Figure 5a are similar to those of PPV
derivatives,14,15 featuring two main bands at 550 and
1100 cm-1. These vibrational modes appear in both
infrared and Raman spectra, being assigned - according to theoretical calculations for PPV and derivatives - to C–H
plus C–C ring out-of-plane bend (522 and 555 cm-1) and
C–H ring in-plane-bend (1005, 1135 and 1174 cm-1).16 In
principle, the C–C ring stretch at 1518, 1543, 1550 and
1584 cm-1 could have been observed in the Raman spectra,
but this did not occur because their intensity is very small.
350 400 450 500 550 600
0.000 0.025 0.050 0.075 0.100 0.125 0.150
350 400 450 500 550 600
0.000 0.025 0.050 0.075 0.100 0.125 0.150 PPV
PPV/Au-thin
A
b
so
rb
an
ce
(a)
Wavelength / nm Wavelength / nm
A
b
so
rb
an
ce
PPV PPV/Au-thick
(b)
Figure 3. (a) Absorbance spectra for BK7/PPV and BK7/PPV/Au-thin film side. (b) Absorbance spectra for BK7/PPV and BK7/PPV/Au-thick film side.
The solid line () represents the spectrum of the BK7/PPV side and the open circles ( ) represent the spectra of the BK7/PPV/Au side.
450 500 550 600 650 700
0.0 0.2 0.4 0.6 0.8 1.0 1.2 1.4 1.6 1.8
2.0 (a)
10 K PPV
PPV/Au-thin
P
L
/
a
.u
.
Wavelength / nm 300 K
450 500 550 600 650 700
0.0 0.2 0.4 0.6 0.8 1.0 1.2 1.4 1.6 1.8
2.0 (b)
10 K PPV
PPV/Au-thick
P
L
/
a
.u
.
Wavelength / nm 300 K
Figure 4. Normalized photoluminescence spectra at 10 and 300 K for (a) BK7/PPV/Au-thin and (b) BK7/PPV/Au-thick films. The PL spectra of
In any case, the main changes caused by the Au layer
occurred in the 800-1200 cm-1 range and at 550 cm-1, as
can be inferred from Figure 5. The experimental data were fitted using Lorentz curves considering the vibrational
modes for PPV.14-17
According to theoretical calculations17 there is a red
shift of ca. 10 cm-1 at the 1089 cm-1 band due to adsorption
of Au on the phenyl ring, which is consistent with the experimental shift in the data of Figures 5b and 5c. There
is also a distortion in the band at 555 cm-1 (see Figures 5d
and 5e). The two bands at 549 and 574 cm-1 for pristine
PPV are shifted in the PPV/Au-thick sample, being again
consistent with theoretical calculations by Brito et al.17 that
pointed to adsorption of Au clusters on the phenyl ring.
Calculations17 were made within the density functional
theory (DFT), using the Perdew-Burke-Ernzerhof spin-polarized generalized gradient approximation scheme (PBE-GGA) to calculate the electron-electron interactions. For the structural, energetic, and electronic properties, the Au/PPV system was described with a supercell where the PPV chain comprised four PPV monomers in an orthorhombic supercell. The vibrational properties were obtained with the density functional perturbation theory (DFPT) approach, as implemented in the plane-wave self-consistent field (PWSCF) code, in order to include the polarizability effects on the vibrational modes and
1000 2000 3000 4000 5000
900 1000 1100 1200
3500 4000 4500 5000
520 540 560 580 600
3100 3200 3300 3400 3500 3600 3700 3800 3900 4000
520 540 560 580 600
3000 3200 3400 3600 3800 4000 4200 4400 4600 4800
200 400 600 800 1000 1200 1400
0 1 2 3 4
In
te
n
si
ty
/
a.
u
.
Pure PPV Fit
ν= 1089.7 cm-1
; ∆ν= 75 cm-1
ν= 1100 cm-1
;∆ν= 76 cm-1
(b)
(c)
In
te
ns
it
y /
a.
u
.
Raman shift / cm-1 PPV/Au-thick
Fit
ν= 1080 cm ;-1 ∆ν= 76 cm-1
ν= 1100 cm ;-1 ∆ν= 76 cm-1
PPV/Au-thick Fit
ν= 570 cm ;-1 ∆ν= 32 cm-1
ν= 551 cm ;-1 ∆ν= 32 cm-1
Raman shift / cm-1
In
te
ns
it
y /
a.
u
.
In
te
ns
it
y /
a.
u
.
(e)
Pure PPV Fit
ν= 574 cm ;-1∆ν= 35 cm-1
ν= 549 cm ;-1∆ν= 37 cm-1
(d)
Raman shift / cm-1 Raman shift / cm-1
(a)
PPV/Au-thick
PPV-thick
PPV/Au-thin
PPV-thin
In
te
ns
it
y /
a.
u
.
Figure 5. (a) Raman spectra for BK7/PPV, BK7/PPV/Au-thin, and BK7/PPV/Au-thick films in the range from 180 to 1400 cm-1; (b) Raman spectra of
frequencies. For the PPV/Au-thin sample, the shift was not observed because the interaction between PPV and Au clusters should be weak. There was no significant difference between the Raman frequencies of pure PPV and Au-PPV
films but the Raman bands in the range 1000-1200 cm-1
were slightly down-shifted by ca. 10 cm-1 owing to the
interaction with phenyl rings, as mentioned above. To estimate the electron-phonon coupling, the Huang-Rhys parameter was calculated from the PL spectra in Figure 4 within the Frank-Condon approximation, molecular exciton scope and pure displacement
approximation, using equation 1:18-21
(1)
where
{
}
− − −∑N
=
j
j j
j j
j
j( )t = S (n + ) (it )+n( ( it ) )
G
1
1
exp exp
1
exp , (2)
ab
is the electric dipole matrix element, am describes the
medium effect, c is the speed of light, ħω
ab = Eb – Eais the energy difference between the localized electronic
states LUMO (Eb) and HOMO (Ea) of the copolymer
segments with the largest conjugation degree, and d is the
inhomogeneous spectral line for a Gaussian distribution. Sjis
the electron-phonon coupling (Huang-Rhys parameter) for
the jth-phonon with energy ω
j and –nj = (exp(ħωj/2kT) – 1)
–1
is the thermal occupation probability.
Figure 6 shows the simulated PL line shape obtained with equation 1 for the PL data of Figure 4. The adjustable parameters were the Huang-Rhys factor for three effective
vibrational modes ν
1 = 1500 cm
-1, ν
2 = 1100 cm
-1, and
ν
3 = 550 cm
-1. The parameters ω
ab (or λab) and d were
obtained directly from the electronic transition at ca. 500 nm. The three effective vibrational modes coupled with the electronic transitions were used as parameters, being
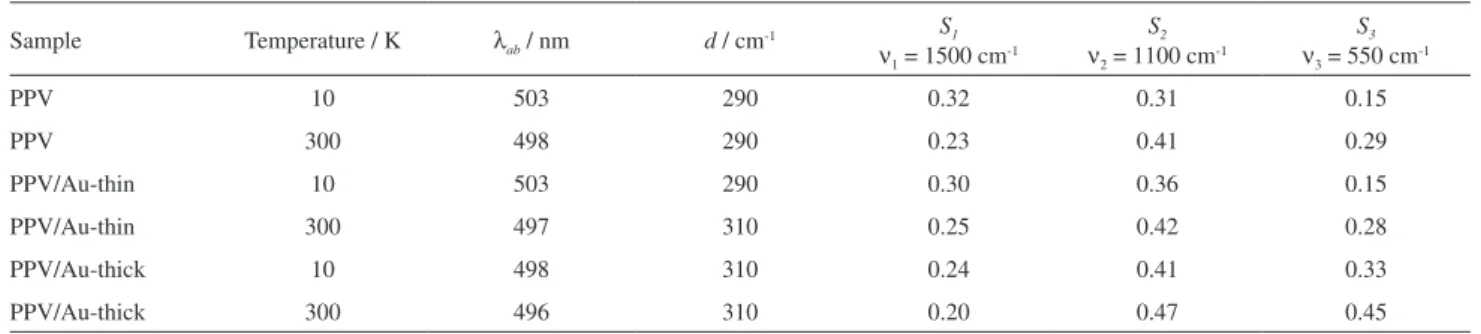
respectively, S1, S2 and S3. Table 1 displays the parameters
used for the fitting. The Huang-Rhys parameter S3,
associated with the C–H plus C–C ring out-of-plane bend,
Table 1. Fitting parameters: zero-phonon position (λ
ab), homogeneous line shape enlargement (d) and Huang-Rhys parameters S1, S2 and S3
Sample Temperature / K λ
ab / nm d / cm-1
S1
ν1 = 1500 cm-1
S2
ν2 = 1100 cm-1
S3
ν3 = 550 cm-1
PPV 10 503 290 0.32 0.31 0.15
PPV 300 498 290 0.23 0.41 0.29
PPV/Au-thin 10 503 290 0.30 0.36 0.15
PPV/Au-thin 300 497 310 0.25 0.42 0.28
PPV/Au-thick 10 498 310 0.24 0.41 0.33
PPV/Au-thick 300 496 310 0.20 0.47 0.45
450 500 550 600 650 700
0 1
2
3 4 5 6
Experimental Theory
PPV/Au-thin 300 K
PPV/Au-thin 10 K PPV/Au-thick 300 K
PPV - 300 K PPV/Au-thick 10 K
PPV - 10 K
P
L
/
a.
u
.
Wavelength / nm
Figure 6. PPV emission spectra of BK7/PPV, BK7/PPV/Au-thin, and
BK7/PPV/Au-thick films at room temperature (300 K) and 10 K. The open circles ( ) represent the experimental data while the solid lines () represent theoretical fitting using equation 1 and the parameters in Table 1.
is the most affected, consistent with the experimentally
observed distortion in the 555 cm-1 band of the Raman
spectra (see Figures 5d and 5e). Similarly, the Huang-Rhys
parameter S2 changed significantly for the PPV/Au-thick
sample, again corroborating the analysis of the Raman
spectra and the ab initio calculations for gold adatoms
and clusters interacting with PPV.17 Therefore the Au-layer
affects mainly the modes related to the phenyl rings of PPV.
Conclusions
vibrational bands in the photoluminescence spectra to change. Through an analysis of Raman scattering data, it was inferred that Au clusters interacted preferentially with the phenylene rings of PPV. This conclusion was supported by a quantitative simulation of the emission line shape within the Franck-Condon approximation, in the scope of
the molecular exciton theory.17 The Huang-Rhys parameter
changed significantly for the vibrational mode with energy
at 550 cm-1 for the thick Au-layer, in agreement with the
results from the Raman scattering spectroscopy.
The effects from the thickness of the gold electrode are also worth emphasizing, for it is possible to leave the PPV properties unaffected by depositing just a thin gold layer. It is likely that the optoelectronic properties can be controlled to some extent by varying either the electrode or the film thickness, which would represent an important step toward tailoring device characteristics. The most significant implication of these results is that one may predict effects from metallic electrodes deposited on polymer films, as the changes observed experimentally were consistent with the ab initio calculations where gold adatoms and clusters were made to interact with PPV.
Acknowledgements
The financial support from FAPESP, FAPEMIG, CAPES, CNPq and INEO (Brazil) is acknowledged.
References
1. Heeger, A. J. In Conjugated Polymers and Related Materials.
The Interconnection of Chemical and Electronic Structure;
Salanek, W. R.; Lundström, I.; Rånby; B., eds.; Oxford University Press: Oxford, 1993, pp. 27.
2. Greiner, A.; Polym. Adv. Technol. 1998, 9, 371.
3. Heeger, A. J.; Braun, D.; US pat. 5869350 1999 (CA
2105069A1).
4. Gebhardt, V.; Bacher, A.; Thelakkat, M.; Stalmach, U.; Meier, H.; Schmidt, H.-W.; Haarer, D.; Adv. Mater.1999, 11, 119.
5. Wolf, H. C. In Organic Molecular Aggregates; Reineker, P.; Haken, H.; Wolf, H. C., eds.; Springer-Verlag: Berlin, 1983, pp. 49.
6. Wu, H.; Huang, F.; Peng, J.; Cao, Y.; Org. Electron.2005, 6, 118.
7. Becker, H.; Burns, S. E.; Friend, R. H.; Phys. Rev. B: Condens.
Matter Mater. Phys.1997, 56, 1893.
8. Therezio, E. M.; Piovesan, E.; Anni, M.; Silva, R. A.; Oliveira, O. N.; Marletta, A.; J. Appl. Phys.2011, 110, 44504. 9. Neugebauer, H.; Brabec, C.; Hummelen, J. C.; Sariciftci, N. S.;
Sol. Energy Mater. Sol. Cells2000, 61, 35.
10. Dökme, I.; Tunç, T.; Uslu, İ.; Altındal, Ş.; Synth. Met.2011,
161, 474.
11. Marletta, A.; Gonçalves, V. C.; Balogh, D. T.; J. Lumin.2006,
116, 87.
12. Gobato, Y. G.; Marletta, A.; Faria, R. M.; Guimaraes, F. E. G.; de Souza, J. M.; Pereira, E. C.; Appl. Phys. Lett.2002, 81, 942. 13. Therézio, E. M.; Piovesan, E.; Vega, M. L.; Silva, R. A.; Oliveira, O. N.; Marletta, A.; J. Polym. Sci., Part B: Polym. Phys.2011,
49, 206.
14. da Silva, M. A. T.; Dias, I. F. L.; Duarte, J. L.; Laureto, E.; Silvestre, I.; Cury, L. A.; Guimaraes, P. S. S.; J. Chem. Phys.
2008, 128, 94902.
15. Wantz, G.; Hirsch, L.; Huby, N.; Vignau, L.; Barriere, A. S.; Parneix, J. P.; J. Appl. Phys.2005, 97, 34505.
16. Rakovic, D.; Kosticacute, R.; Gribov, L. A.; Davidova, I. E.;
Phys. Rev. B: Condens. Matter Mater. Phys1990, 41, 10744.
17. Brito, W. H.; Silva, R. A.; Miwa, R. H.; J. Chem. Phys.2010,
133, 204703.
18. Brailsford, A. D.; Chang, T. Y.; J. Chem. Phys.1970, 53, 3108. 19. Chang, R.; Hsu, J. H.; Fann, W. S.; Liang, K. K.; Chang, C. H.; Hayashi, M.; Yu, J.; Lin, S. H.; Chang, E. C.; Chuang, K. R.; Chen, S. A.; Chem. Phys. Lett.2000, 317, 142.
20. Marletta, A.; Guimarães, F. E. G.; Faria, R. M.; Braz. J. Phys.
2002, 32, 570.
21. Yu, J.; Fann, W. S.; Kao, F. J.; Yang, D. Y.; Lin, S. H.; Synth. Met.1994, 66, 143.
Submitted: May 1, 2015
Published online: June 23, 2015