Article
Printed in Brazil - ©2015 Sociedade Brasileira de Química 0103 - 5053 $6.00+0.00
A
*e-mail: [email protected]
Rietveld Method in the Analysis of Polymorphism in Mebendazole Tablets Acquired
in Brazil’s Drugstores
Simone T. B. Salvi,*,a Selma G. Antonio,a Fabio F. Ferreirab and Carlos O. Paiva-Santosa
aDepartamento de Físico-Química, Instituto de Química, Universidade Estadual Paulista (UNESP), R. Prof. Francisco Degni, 55, Quitandinha, 14800-060 Araraquara-SP, Brazil
bCentro de Ciências Naturais e Humanas (CCNH), Universidade Federal do ABC (UFABC), Av. dos Estados, 5001, 09210-580 Santo André-SP, Brazil
Mebendazole (MBZ) is an anthelmintic medicine known to exhibit the polymorphs A, B and C, where polymorph C is the one indicated for tablets. Mebendazole commercial tablets (references, generics and similars) were analyzed in this work using X-ray powder diffraction data and the Rietveld method (RM) aiming at characterizing and quantifying crystal phases. Form C was found in mixture with form A in formulations of 500 mg (reference and generic). One of the generics presented a batch with form B and another one with form C. All the other tablets presented form A.
Keywords: X-ray powder diffractometry, polymorphism, mebendazole, Rietveld method
Introduction
Mebendazole (MBZ), (5-benzoyl-1H
-benzimidazol-2-yl)-carbamic acid methyl ester, is a synthetic broad-spectrum anthelmintic medicine widely indicated for the treatment of simple or mixed infestations.
According to the World Health Organization (WHO), more than 2 million people have some sort of worm or parasite in their bodies, and they do not know about
it.1 Schistosomiasis is a parasitic disease that is largely
common and known to affect about 200 million people in
the world.2 Once the proper treatment fails to be done, the
parasitic disease can cause a permanent damage in humans and in extreme cases it may even lead to death.
There are three classes of drugs in Brazil (reference, generic, and similar), which are designated by the law and defined by the Brazilian Regulatory Agency known as Agência Nacional de Vigilância Sanitária (ANVISA). Since 2003, all new similar or generic drugs must present the same bioequivalence of the reference drug to be approved
by ANVISA to be distributed to the market.3 After 2014,
all similar drugs sold in the Brazilian market shall present the same bioequivalence of the reference ones. The samples analyzed in this work were produced according to the old rules, where the similar, and only the similar, was not necessary to present the bioequivalence tests.
MBZ, a basic Biopharmaceutics Classification System (BCS) class II drug, is poorly BCS soluble. In addition, MBZ is known to exhibit polymorphism and according to the International Conference on Harmonisation (ICH) Q6A
guideline,4 decision 4, the presence of polymorphs must be
rigorously controlled in the case of drugs that are not highly BCS soluble in order to ensure that the drug bioavailability will not undergo any alteration. Polymorphism can be defined as the capacity of a molecule to crystallize in
more than one crystal structure.5 The polymorphism in
pharmaceutical solids can be related to the differences in bioavailability of the active pharmaceutical ingredient (API) since different polymorphs are known to exhibit distinct physicochemical characteristics, such as color, melting point, solubility, hygroscopicity, internal energy,
enthalpy and entropy.6
MBZ exhibits three known polymorphic forms: A, B and C, which exhibit differences in terms of solubility,
stability and therapeutic activity.7 The solubility of
MBZ in acid environment is B > C > A.8 According to
Rodriguez-Caabeiro et al.,9 after carrying out some tests
in mice, the form C resulted as the most suitable one for use in anthelmintic treatments due to its lower toxicity in comparison to the form B, although both of them have presented similar anthelmintic effects. Among all polymorphic forms of mebendazole, form A is the one
that presented the lowest effectiveness.9 In spite of this
in solid formulations around the world and Brazil is not an
exception.10 The presence of only polymorph A in tablets,
or above 30% is known to have no therapeutic activity.11
De Villiers et al.7 recommend the use of X-ray powder
diffraction (XRPD) to investigate polymorphism in tablets of MBZ.
The crystal structure of the polymorph A was described by Ferreira et al.12 and the crystal structure of the polymorph
C by Martins et al.13
Polymorph B, on the other hand, has only its characteristic peaks reported by several authors without any description of its crystal structure: Rodrigues-Caabeiro et al.,9 Costa et al.,8
Swanepoel et al.,14 de Villers et al.7 and Kachrinaniis et al.15
In the diffractograms reported by these authors, the following common peaks (d-spacings) can be observed: 9.36, 4.65, 4.11 and 3.62 Å. The diffractograms observed by Rodrigues-Caabeiro et al.,9 Costa et al.8 and de Villers et al.7
are found to be very similar. The first most intense peak can be seen at 4.65Å, while the second one is found at 9.36Å as
reported by all the authors except Kachrinaniis et al.,15 who
reported the most intense peak at 14.62 Å.
There are several techniques used for characterizing polymorphs. These include spectroscopy [infrared (IR),
Raman, nuclear magnetic resonance (NMR)],16-18 thermal
analysis [thermogravimetry (TG), differential thermal analysis (DTA) and differential scanning calorimetry (DSC)], microscopy [scanning electron microscopes (SEM), transmission electron microscope (TEM), field emission gun (FEG)], which can provide information concerning the existence of polymorphism, its stability, hydration, besides indicating material crystallinity.16,19,20 For
the purpose of investigating the crystal structures in tablets,
the Rietveld method (RM)21 with X-ray powder diffraction
data is the most suitable tool. It allows the identification
and quantification22 of crystalline phases, and where the
amorphous content is likely to be determined, the addition
of an internal standard is used.23 For the use of the RM is
mandatory the knowledge of the crystal structure models of all crystalline phases present in the sample.
In this work, commercial tablets of MBZ available on the Brazilian market were analyzed by the RM using XRPD data. Also, it was possible to determine the relative amount of polymorphic forms A and C of MBZ. As aforementioned,
the lack of a description of the crystal structure of form B8
only allowed us its identification in tablets.
Experimental
Samples
13 batches of MBZ tablets were purchased from drugstores in the city of Araraquara, SP, Brazil, between July/2009 to October/2010. The tablets included two reference formulations, five generic formulations and
two similar3 formulations. The identification of all drugs
analyzed are shown in Table 1.
X-ray powder diffraction
Prior the measurements, the tablets had their coatings removed and subsequently were milled in agate mortar and sieved through a mesh 200. The obtained powders were softly pressed in a 20-mm diameter and 0.2 mm depth sample holder.
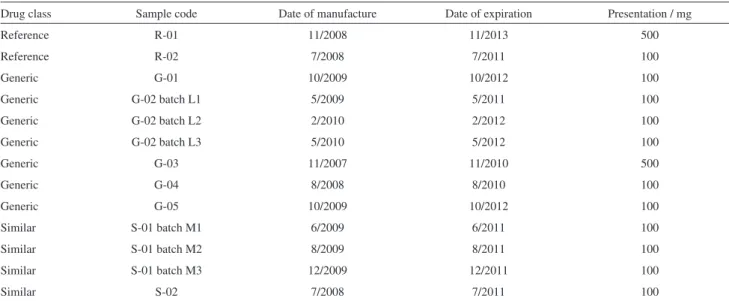
Table 1. Nomenclature system for the mebendazole tablets analyzed, with manufacture and expiration dates, and presentation, as declared by the
manufacturer prescribing information
Drug class Sample code Date of manufacture Date of expiration Presentation / mg
Reference R-01 11/2008 11/2013 500
Reference R-02 7/2008 7/2011 100
Generic G-01 10/2009 10/2012 100
Generic G-02 batch L1 5/2009 5/2011 100
Generic G-02 batch L2 2/2010 2/2012 100
Generic G-02 batch L3 5/2010 5/2012 100
Generic G-03 11/2007 11/2010 500
Generic G-04 8/2008 8/2010 100
Generic G-05 10/2009 10/2012 100
Similar S-01 batch M1 6/2009 6/2011 100
Similar S-01 batch M2 8/2009 8/2011 100
Similar S-01 batch M3 12/2009 12/2011 100
The XRPD data of all tablets were obtained in the range
of 2 to 30° (2θ) with ∆θ = 0.02° using a Rigaku RINT2000
copper (CuKα) rotating anode diffractometer operating at
42 kV and 120 mA. A receiving slit of 0.3 mm, divergence slit of 0.25 mm, 2.5° divergence Soller slit and a curved graphite monochromator in the diffracted beam were used.
Rietveld refinement
The refinements were performed using the Topas
Academic v.4.2 software.24 The fundamental parameters
model25 implemented in the program was used to adjust
the peak broadening. The crystallite size was refined considering an anisotropic form, having independent lorentzian and gaussian componentes for the family of
planes (h00), (0k0), (00l), (hk0), (h0l), (0kl) and (hkl).26
The background was adjusted using a Chebyschev
polynomial.27
The unit cell parameters were refined together with the parameters for the correction of the preferred orientations
artifacts using the spherical harmonics model (four terms).28
The atomic coordinates of the crystal structures were kept
fixed at the published values.12,13
The crystallographic data for forms A and C are shown in Table 2. The crystal structure model of form B has not yet been reported, and in this work, the information about the interplanar distance d x intensity available were
obtained from Costa et al.,8 Table 3, were used to identify
this polymorph in the tablets.
The crystal structures of the excipients α
-lactose-monohydrate, β-D-mannitol and talc were used in some
refinements and their unit cell dimensions and space groups are also listed in Table 2.
Results
The polymorphs of MBZ show intense and characteristic
peaks in the region between 4 and 10° (2θ), which are
useful in aiding the visual differentiation among the three
polymorphs A,12 B8 and C,13 as can be observed in the
simulated patterns shown in Figure 1. The Topas Academic v4.2 software was used to simulate the powder patterns from the crystallographic information framework (cif)
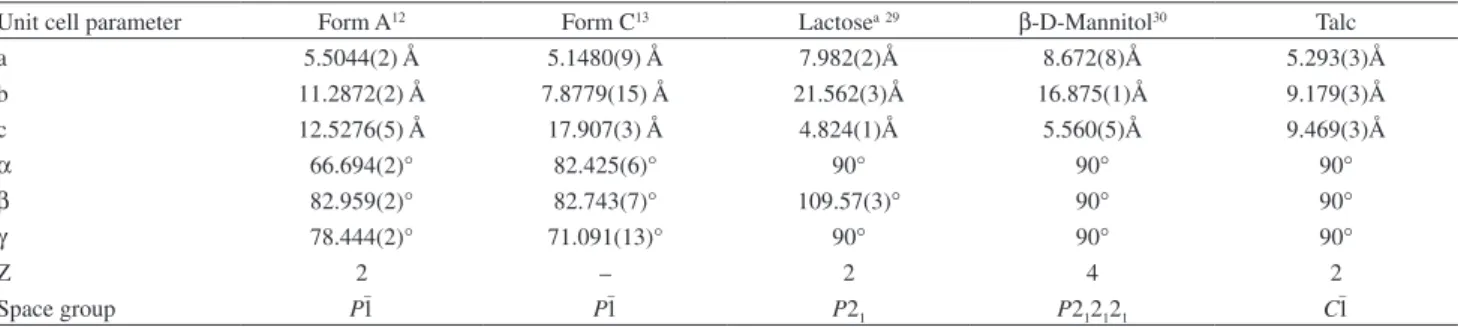
Table 2. Unit cell dimension and space group of the forms A, B and C of the MBZ and excipients α-lactose-monohydrate, β-D-mannitol and talc used in refinements
Unit cell parameter Form A12 Form C13 Lactosea29 β-D-Mannitol30 Talc
a 5.5044(2) Å 5.1480(9) Å 7.982(2)Å 8.672(8)Å 5.293(3)Å
b 11.2872(2) Å 7.8779(15) Å 21.562(3)Å 16.875(1)Å 9.179(3)Å
c 12.5276(5) Å 17.907(3) Å 4.824(1)Å 5.560(5)Å 9.469(3)Å
α 66.694(2)° 82.425(6)° 90° 90° 90°
β 82.959(2)° 82.743(7)° 109.57(3)° 90° 90°
γ 78.444(2)° 71.091(13)° 90° 90° 90°
Z 2 – 2 4 2
Space group P1– P1– P21 P212121 C
–
1
aα-Lactose monohydrate.
Table 3. Position and intensity (I100) of the form B
Form B8
Diameter / Å Intensity (I100) / %
14.62 9.36 7.26 7.08 4.65 4.55 4.21 4.11 3.92 3.62 3.52 3.11 3.09
60 83 42 47 100
42 46 63 46 67 50 40 43
Figure 1. Simulated patterns of forms A, B and C using the Topas
Academic v4.2 software. Powder patterns of forms A and C were simulated from the reference crystal structures,12,13 while form B was simulated on
the basis of the reference characteristics peaks.8 The region ranging from
files for form A and C, and data reported in the literature were provided in Table 2 for form B. All simulations were done considering an average crystallite size of 100 nm. The intense peaks presented by forms A, B and C were found at 7.68°, 6.02° and 4.98°, respectively.
The excipients used in the tablets and those informed in the package insert of each medicament can be found in the Supplementary Information (SI) section. The
crystal structures of the excipients lactose (α-lactose
monohydrate),29 mannitol (β-D-mannitol)30 and talc
(100682-ICSD) were used in the analyses.
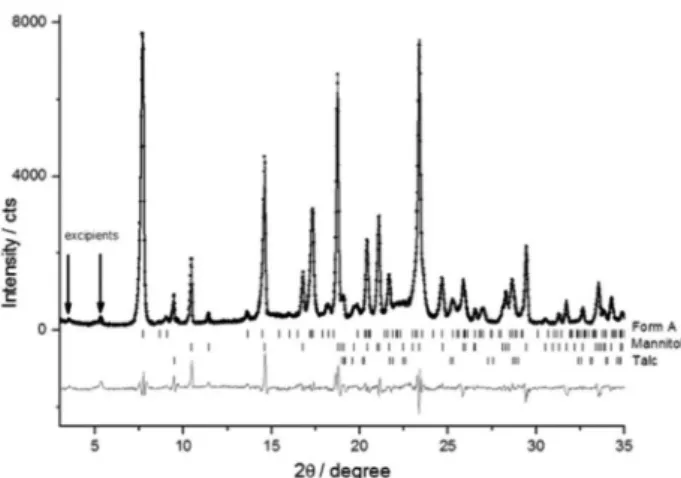
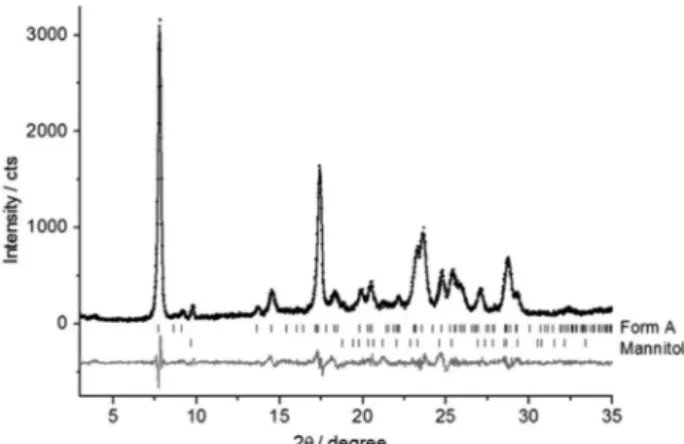
The typical Rietveld plot showed in Figure 2 (sample R-01) is represented by the observed diffracted
pattern (•), the calculated one (continous line), and the
difference between them as well as the Bragg peaks positions (|) of each crystalline phase present in the sample. The amorphous phase (excipients and possible fractions of the API) does not present Bragg peaks and its contribution to the diffractogram is in the background. The results from quantitative phase analysis (QPA) and the refinement
agreement indexes31 of all samples (references, generics
and similar) are listed in Table 4.
Reference medicaments
R-01
The Rietveld plot of sample R-01 is shown in Figure 2. This tablet presents 95.5(3) wt.% of form C and 4.5(3) wt.% of form A. The most intense peak of form A is indicated by the arrow.
R-02
This other reference tablet, R-02, contains only the form
A of MBZ, and the crystalline excipients β-D-mannitol and
talc (Figure 3).
Generic medicaments
G-01
The generic G-01 exhibited the form A of the API as
well as the excipients β-D-mannitol and talc in crystalline
form.
G-02 (batch L1)
In the case of the G-02-L1, form B peaks reported by
Costa et al.8 were observed at d-spacings = 14.62, 9.36,
Table 4. Rietveld refinement agreement factors (Rwp and χ2) of the reference, generic and similar tablets. QPA obtained in method Rietveld and relative
percentage (RP) on API in the tablets to mebendazole forms
Rwp / % χ2 Form A [RP]a / % Form C [RP]a / % Mannitol / % Talc / % Lactose / % Mg Stb / %
R-01 10.84 1.56 4.5(3) [4.5] 95.5(3) [95.5] − − − −
R-02 15.52 3.75 50 (3) [100] − 43.79(3) 5.8(6) − −
G-01 12.04 2.02 65.6(7) [100] − 28.8(6) 5.6(2) − N.Q.c
G-02-L1 12.69 2.69 3.9(3) [42.4] 5.3(3) [57.6] 90.72(5) − − −
G-02-L2 9.67 4.36 − 66.2(3) [100] 33.8(3) − − −
G-02-L3 11.17 3.71 − 68.7(6) [100] 31.3(5) − − −
G-03 11.68 2.91 4.5(3) [5] 84.4(7) [95] − 2.1(2) 8.9(6) −
G-04 9.84 1.37 94.1(4) [100] − − 5.9(4) − −
G-05 12.00 2.46 100 [100] − N.Q.c − − N.Q.c
S-01-M1 9.38 3.86 90.7(3) [100] − − − 9.3(3) −
S-01-M2 6.75 1.56 85(1) [100] − − 2(1) 13(1) −
S-01-M3 11.47 2.75 100 [100] − − − − −
S-02 10.30 1.46 93.7(4) [100] − 6.3(4) − − −
aThe relative percentage of API in the tablets can be found in square brackets: [RP]; bMg St: magnesium stearate; cN.Q.: identified, but not quantified.
Between brackets are the standard deviations obtained at the end of the refinement: (standard deviation). Rwp and χ2: Rietveld refinement agreement factors.
Figure 2. Rietveld plot of sample R-01. The arrow indicates the most
7.26, 7.08, 4.65, 4.55, 4.21, 4.11, 3.92, 3.62, 3.52, 3.11 and 3.09 Å. The Rietveld plot of G-02-L1, depicted in Figure 4, shows the peaks of form B (indicated by solid vertical
lines). The low intense peak in 2(θ) = 4.43° (d = 19.9 Å)
corresponds to sodium lauryl sulfate, a crystalline excipient. Besides form B, this figure also shows two peaks of forms A and C and some peaks related to unidentified
compounds, in 2(θ) = 6.35° and 11.64° (d = 14.3
and 7.6 Å). Eight other batches of this same product were analyzed and only polymorphic form C of MBZ was identified.
G-02 (batches L2 and L3)
G-02-L2 was produced nine months after batch L1, and the following batch L3 was produced twelve months after batch L1. The latter ones (L2 and L3) showed the same results. The Rietveld plot obtained for batch L2 is shown in Figure 5 and forms B and A are not present in the sample. Only peaks of form C of
MBZ and the excipient β-D-mannitol were identified in
the refinement.
G-03
The Rietveld plot of the generic sample G-03 of 500 mg (Figure 6) shows the peaks of form A, form C,
the crystalline excipient α-lactose-monohydrate and one
peak at 9.5° (2θ) that was attributed to the most intense
peak of the excipient talc, although it is not listed in the prescribing information. This peak at 9.5° is found to be the most intense one for this excipient and it appears without overlapping with other peaks. The second most intense peak of talc appears at 28.6°, overlapping with form A peaks of MBZ as can be seen in the inset of Figure 6.
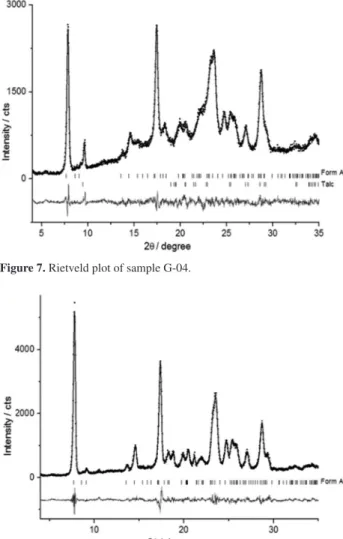
G-04
The Rietveld plot of sample G-04 (Figure 7) shows the peaks of the form A of MBZ and of the crystalline excipient talc.
G-05
The Rietveld plot of the G-05 sample (Figure 8) shows only the peaks of form A of mebendazole.
Figure 3. Rietveld plot of sample R-02. The arrows indicate the peaks of the excipient magnesium stearate that were not adjusted in the refinement owing to the fact that its crystal structure has not been reported.
Figure 4. Rietveld plot of sample G-02-L1. Vertical solid lines indicate the peak positions of form B while the vertical dashed lines are the excipients peaks after refinements.
Figure 6. Rietveld plot of a sample G-03.
Similar medicaments
S-01 (batch M1)
Figure 9 shows the Rietveld plot of sample S-01-M1 where we could identify the peaks of form A of MBZ as
well as of the excipient α-lactose-monohydrate present in
the medicament.
S-01 (batch M2)
Batch M2 was produced two months after batch M1. Its Rietveld plot is shown in Figure 10 with the peaks of form A
of MBZ and the excipients α-lactose-monohydrate and talc.
S-01 (batch M3)
Batch M3 was produced six months following the manufacture of batch M2. The Rietveld plot of batch M3 (Figure 11) shows only the peaks of form A of MBZ.
S-02
The Rietveld plot of sample S-02 (Figure 12) shows only
the peaks of the form A and of the excipients β-D-mannitol.
There are no unidentified peaks in this sample.
Discussion
The batches (with respective dates of manufacturing), presentation of formulation, code of sample and percentages found for each polymorph in the tablets can be seen in the SI section. Most of the tablets exhibits the polymorphic form A. Four tablets exhibited form C, being two of them of 500 mg and the other two of 100 mg. The 500 mg
Figure 7. Rietveld plot of sample G-04.
Figure 9. Rietveld plot of sample S-01-M1.
Figure 10. Rietveld plot of sample S-01-M2.
Figure 8. Rietveld plot of G-05 sample.
generic medicament (G03) mostly presented the same polymorph of the 500 mg reference (R01) one. Surprisingly, the 100 mg reference presented the polymorph A, which is the less efficient one among all polymorphs of
mebendazole according to Rodriguez-Caabeiro et al.9
All other medicaments, except G-02, displayed the same polymorph A. G-02-L1 contains mostly the not recommended form B, and G-02-L2 and G-02-L3 present the form C, which is the most appropriate form according
to Rodriguez-Caabeiro et al.9 Unfortunately, the solubility
tests of the medicaments could not be performed to look for a correlation with the polymorphs found in the tablets.
Reference medicaments
In the reference tablet R-01 (Figure 2), all peaks in the powder pattern were adjusted during refinement, indicating that all the crystalline phases present in the tablet have been identified. No excipients peaks were observed. In this case, they can be present in amorphous form or perhaps their amount were so small that their peaks could not be observed. In the Rietveld plot for the sample R-02 (Figure 3), two peaks (located at 3.6° and 5.33°) were not adjusted during refinement, though they were attributed to the excipient magnesium stearate owing to the fact that the peak positions of the most intense reflections of this excipients are in the
same 2θ positions as those in the sample.
Generic medicaments
Sample G-01 exhibits the form A of the MBZ as well as
the excipients β-D-mannitol and talc in crystalline forms.
The crystal structures of the two excipients are largely known and they could be employed in the Rietveld refinement. One low intense peak (5.31°) does not correspond to polymorphs
of MBZ and neither to β-D-mannitol nor talc. This unknown
peak in fact corresponds to the most intense peak of the
excipient magnesium stearate and could be identified by comparing it with the powder diffraction of this excipient.
The powder pattern of form B from the work of
Costa et al.,8 was compared to the powder diffraction of
G-02-L1, indicating the presence of this polymorphic form in the tablet. The peaks related to the form B from
the work published by Costa et al.8 were included in
the refinement, confirming the presence of this form in sample G-02. In the diffractogram, shown in Figure 4, the characteristic peaks of form B are more intense than the peaks of forms A and C, indicating that its presence in the tablet is larger than the other two. In the following batches of this medicament, G-02-L2 and L3, we could not verify the presence of form B. This can be associated with batch-to-batch reproducibility and/or different polymorphic forms of the active pharmaceutical ingredient, though
the β-D-mannitol remains crystalline in all the batches
analyzed for this medicament.
Sample G-03 exhibits the polymorphic form C of MBZ in a larger amount than form A. In the package insert of this medicament the talc is not declared, though the two most intense peaks of this excipient were identified in the refinement (Figure 6). It was possible to confirm its presence in the tablet by the Rietveld refinement.
This other sample, G-04, exhibits form A of MBZ and the increase observed in the baseline background indicates an amorphous content, which can be caused by amorphous excipient, cellulose microcrystalline for example.
The manufacturer of this sample is the same one responsible for the production of G-05 and S-02. In the generic medicament, all the excipients are found to be
amorphous while in the similar one β-D-mannitol is seen
to be present in crystalline form. The two tablets of this manufacturer exhibit form A of MBZ.
Similar medicaments
All the peaks have been identified in the S-01 batch M1 as well as the other excipients, with the exception of
α-lactose monohydrate, which is presented in amorphous
form. The M2 batch was manufactured two months following batch M1. There is a difference between the excipient talc of the latter two batches; it is found to be crystalline in batch M2 while it is amorphous in batch M1. A third batch of medicament S-01 was purchased, batch M3, which was manufactured six months following batch M1. However, there are no unidentified peaks for this sample. The results obtained indicate the crystallinity of the excipients may vary batch by batch. In the first batch there was only one excipient in crystalline form. In the batch manufactured two months following the first one there were
two excipients in crystalline form (α-lactose-monohydrate and talc). In the last batch, manufactured six months following the first one, all excipients were amorphous.
Conclusions
The four tablets analyzed: R-01, G-02 batches L2 and L3 and G-03, showed mostly form C; eight tablets (R-02, G-01, G-04, G-05, S-01 batches M1, M2 and M3; and S-02) showed form A and one (G-02 batch L1) showed mostly form B. One batch of medicament G-02 exhibited two peaks at 6° and 9.44°, which can be related to form B of MBZ. Other tablets showed the characteristic peak of form A, including the reference ones.
Medicaments available in the national market exhibit differing range of polymorphs in their composition.
It is worth noting that by means of XRPD and the RM it was possible to identify forms A, B and C besides quantifying forms A and C in the tablets, given the presence of mixtures of polymorphs.
Regarding excipients used in the manufacturing of tablets, a significant lack of quality control in the raw material has been observed. Some excipients that usually exhibit crystalline form in tablets showed an amorphous form, which undoubtedly raises questions as to the nature of the excipient in the formulation.
The methodology employed in this work, using XRPD and the overlapping of powder patterns obtained in the literature is remarkably interesting to regulatory agencies for the evaluation of polymorphysm in commercial tablets and to the pharmaceutical industry in the production line for quality control purposes.
Supplementary Information
Supplementary information, including excipients on the package insert of each medicament, batches, presentation of formulation, code of sample and percentages found of each polymorph in the tablets, as well as simulation of forms B of the mebendazole described in the literature, are available free of charge at http://jbcs.sbq.org.br as PDF file.
Acknowledgments
We thank the financial support provided by the Brazilian research foundations CAPES, CNPq and FAPESP.
References
1. http://www.who.int/mediacentre/factsheets/fs366/en/ accessed on June 16, 2013.
2. http://www.cdc.gov/parasites/schistosomiasis/ accessed on June 16, 2013.
3. http://portal.anvisa.gov.br/wps/content/Anvisa+Portal/ Anvisa/Inicio/Medicamentos/Assunto+de+Interesse/ Medicamentos+similares accessed on June 16, 2015. 4. http://www.ema.europa.eu/docs/en_GB/document_library/
Scientific_guideline/2009/09/WC500002823.pdf accessed on March 15, 2015.
5. Bernstein, J.; Polymorphism in Molecular Crystals, 1st ed.;
Clarendon Press: Oxford, 2002.
6. Sheth, A. R.; Grant, D. J. W.; KONA Powder Part. J. 2005, 23, 36.
7. de Villiers, M. M.; Terblanche, R. J.; Liebenberg, W.; Swanepoel, E.; Dekker, T. G.; Song, M.; J. Pharm. Biomed. Anal. 2005, 38, 435.
8. Costa, J.; Fresno, M.; Guzmán, L.; Igual, A.; Oliva, J.; Vidal, P.; Pérez, A.; Pujol, M.; Circ. Farm. 1991, 49, 415.
9. Rodriguez-Caabeiro, F.; Criado-Fornelio, A.; Jimenez-Gonzalez, A.; Guzmán, L.; Igual, A.; Pérez, A.; Pujol, M.;
Chemotherapy1987, 33, 266.
10. Froehlich, P. E.; Gasparotto, F. S.; Rev. Cienc. Farm. Basica Apl.2005, 26, 205.
11. Evans, A. C.; Fincham, J. E.; Dhansay, M. A.; Liebenberg, W.;
S. Afr. Med. J.1999, 89, 1118.
12. Ferreira, F. F.; Antonio, S. G.; Rosa, P. C. P.; Paiva-Santos, C. O.; J. Pharm. Sci. 2009, 99, 1734.
13. Martins, F. T.; Neves, P. P.; Ellena, J.; Cami, G. E.; Brusau, E. V.; Narda, G. E.; J. Pharm. Sci.2009, 98, 2336.
14. Swanepoel, E.; Liebenberg, W.; de Villiers, M. M.; Eur. J. Pharm. Biopharm.2003, 55, 345.
15. Kachrimanis, K.; Rontogianni, M.; Malamataris, S.; J. Pharm. Biomed. Anal. 2010, 51, 512.
16. Brittain, H. G.; J. Pharm. Sci.1997, 86, 405.
17. Guo, J. F.; Jones, M. J.; Chem. Eng. Res. Des.2010, 88,
1648.
18. Linck, Y. G.; Chattah, A. K.; Graf, R.; Romanuk, C. B.; Olivera, M. E.; Manzo, R. H.; Monti, G. A.; Spiess, H. W.; Phys. Chem. Chem. Phys. 2011,13, 6590.
19. Vippagunta, S. R.; Brittain, H. G.; Grant, D. J. W.; Adv. Drug Delivery Rev.2001, 48, 3.
20. Bruni, G.; Gozzo, F.; Capsoni, D.; Bini, M.; Macchi, P.; Simoncic, P.; Berbenni, V.; Milanese, C.; Girella, A.; Ferrari, S.; Marini, A.; J. Pharm. Sci.2011, 100, 2321.
21. Rietveld, H. M.; J. Appl. Crystallogr.1969, 2, 65.
22. Hill, R. J.; Howard, C. J.; J. Appl. Crystallogr. 1987, 20, 467. 23. De Figueiredo, L. P. E.; Ferreira, F. F.; J. Pharm. Sci.2014,
103, 1394.
24. Coelho, A.; Topas Academic v4.2; Topas Academic, Coelho Software, Brisbane, 2007.
26. Antonio, S.; Benini, F.; Ferreira, F.; Rosa, P.; Paiva-Santos, C. O.; Powder Diffr. 2008, 23, 350.
27. Chebyshev, P. L.; Mémoires des Savants Étrangers Présentés à l’Académie de Saint-Pétersbourg1854, 7, 539.
29. Bunge, H. J.; Texture Analysis in Materials Science: Mathematical Methods; Butterworths: London, 1982. 29. Fries, D. C.; Rao, S. T.; Sundaralingam, M.; Acta Crystallogr.,
Sect. B: Struct. Sci., Cryst. Eng. Mater. 1971, 27, 994.
30. Berman, H. M.; Jeffrey, G. A.; Rosenstein, R. D.; Acta Crystallogr., Sect. B: Struct. Sci., Cryst. Eng. Mater. 1968, 24,
442.
31. Toby, B. H.; Powder Diffr. 2006, 21, 67.
Submitted: April 6, 2015 Published online: June 19, 2015