www.earth-syst-sci-data.net/6/165/2014/ doi:10.5194/essd-6-165-2014
©Author(s) 2014. CC Attribution 3.0 License. Open
Access
Science
Data
Soil, snow, weather, and sub-surface storage data from a
mountain catchment in the rain–snow transition zone
P. R. Kormos1, D. Marks2, C. J. Williams2, H. P. Marshall1, P. Aishlin1, D. G. Chandler3, and J. P. McNamara1
1
Boise State University, Department of Geosciences, 1910 University Dr., Boise, Idaho 83725, USA 2Agricultural Research Service, Northwest Watershed Research Center, 800 Park Blvd., Plaza IV, Suite 105
Boise, Idaho 83712, USA
3Syracuse University, L.C. Smith College of Engineering and Computer Science, 151 Link Hall, 900 South Crouse Ave., Syracuse, New York 13244, USA
Correspondence to:J. P. McNamara ([email protected])
Received: 13 September 2013 – Published in Earth Syst. Sci. Data Discuss.: 3 December 2013 Revised: 23 March 2014 – Accepted: 26 March 2014 – Published: 28 April 2014
Abstract. A comprehensive hydroclimatic data set is presented for the 2011 water year to improve under-standing of hydrologic processes in the rain–snow transition zone. This type of data set is extremely rare in scientific literature because of the quality and quantity of soil depth, soil texture, soil moisture, and soil tem-perature data. Standard meteorological and snow cover data for the entire 2011 water year are included, which include several rain-on-snow (ROS) events. Surface soil textures and soil depths from 57 points are presented as well as soil texture profiles from 14 points. Meteorological data include continuous hourly shielded, un-shielded, and wind-corrected precipitation, wind speed and direction, air temperature, relative humidity, dew point temperature, and incoming solar and thermal radiation data. This data is often viewed as “forcing data”, and is gap filled and serially complete. Sub-surface data included are hourly soil moisture data from multiple depths from seven soil profiles within the catchment, and soil temperatures from multiple depths from two soil profiles. Hydrologic response data include hourly stream discharge from the catchment outlet weir, continuous snow depths from one location, intermittent snow depths from 5 locations, and snow depth and density data from ten weekly snow surveys. Snow and hydrologic response data are meant to provide data on the catchment hydrologic response to the weather data. This data is mostly presented “as measured” although snow depths from one sensor and streamflow at the catchment outlet have been gap filled and are serially complete. Though the weather, snow, and hydrologic response data only covers one water year, the presentation of the additional subsurface data (soil depth, texture, moisture, and temperature) makes it one of the most detailed and complete hydro-climatic data sets from the climatically sensitive rain–snow transition zone. The data presented are ap-propriate for a wide range of modeling (energy balance snow modeling, soil capacitance parametric modeling, etc.) and descriptive studies. Data is available at doi:10.1594/PANGAEA.819837.
1 Introduction
Detailed weather, soils, and hydrologic response data are pre-sented that provide a whole-catchment view of the dynamic hydrology that occurs in the mountain rain–snow transition zone. We define the rain-snow transition zone as the eleva-tion band in temperate mountains where the dominant win-ter precipitation phase is variable, and changes from rain
166 P. R. Kormos et al.: Soil, snow, weather, and sub-surface storage data from a mountain catchment
Table 1. Hydro-meteorological parameters, type of instruments, and instrument heights from the Treeline experimental catchment in WY2011. Locations are denoted by WS – weather station, 4CR – four component radiometer, Npit3 – north soil pit 3, OF – outlet flume.
Hydro-meteorological Method/ Sensor
parameter instrument height (m)
Shielded precipitation (WS) 8 inch Belfort-type gauge with Alter Shield 2
Unshielded precipitation (WS) 8 inch Belfort-type gauge 2
Wind-corrected precipitation (Hanson, 2004) 2
Wind speed (WS) Met One WS 013 2
Wind direction (WS) Met One WD 023 2
Air temperature (WS) Vaisala HMP45AC 2
Humidity (WS) Vaisala HMP45AC 2
Incoming solar (WS) Matrix Mk 1-G 2
Incoming & outgoing solar (4CR) Hukseflux NR01 2
Incoming & outgoing thermal (4CR) Hukseflux NR01 2
Soil temperature (Npit3) CS 107 thermistor −0.05
Stream discharge (OF) Druck PDCR1830 in v-notch flume na
Table 2.Distributed watershed data, number of sensors, type of instruments, and instrument heights from the Treeline experimental catch-ment for WY2011.
Number Variable Measurement method Heights (m)
2 profiles soil temperature CS 107 thermistor −0.05 to−1.00
2 profiles soil moisture CS 615 soil moisture probe −0.05 to−1.00
5 profiles soil moisture CS TDR100 soil moisture probe −0.09 to−1.01
1 sensor snow depth Judd depth sensor 2
5 sensors snow depth MaxBotix XL-MaxSonar EZ2 (self-made) 2
10 surveys snow depth various na
10 surveys snow density various na
57 points soil depth steel rod pounded to refusal −0.24 to−1.25
57 points soil texture sieve and hydrometer 0.00 to−0.30
14 profiles soil texture sieve and hydrometer 0.00 to−0.81
the rain–snow transition typically occurs in mid-elevations ranging from 1500–1800 m (Nayak et al., 2010). Nolin and Daily (2006) estimated that currently the rain–snow tran-sition zone covers approximately 9200 km2 in the Pacific Northwest. This is a region where warming trends are ex-pected to shift the current precipitation regime toward being rain-dominated and move the rain–snow transition to higher elevations.
The mountain rain–snow transition zone is an important area for study because it is sensitive to warming trend effects on the snow cover (Mote, 2003) and ecosystems (Cayan et al., 2001; Cuo et al., 2011). The snow cover in this zone is sensitive to climate warming trends because it is gener-ally warm and ephemeral. The presence or absence of snow impacts the energy and mass balance because it dictates whether incoming solar radiation is reflected or absorbed. Since precipitation can be deposited as either rain that is rapidly transmitted to the soil, or snow that delays the de-livery of liquid water to the soil, changes in the precipitation phase translate directly to changes in the timing of water in-puts to catchment soils. Weather and soil data sets have been
published from rain-dominated (Western and Grayson, 1998) and snow-dominated areas (Reba et al., 2012; Seyfried et al., 2001b; Seyfried et al., 2001a; Morin et al., 2012), but there is a general lack of data from the rain–snow transition zone.
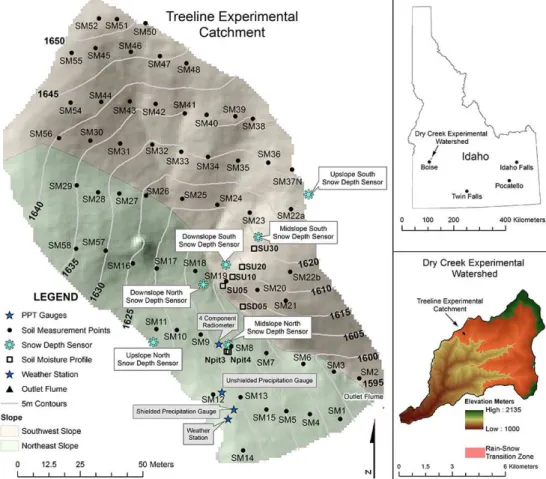
Figure 1.Location map of the Treeline experimental catchment in the Dry Creek experimental watershed and the location of instruments and measurement points.
mixed phase events were directly measured during the ten years in which the transect was operated (2004–2013).
Catchment data are presented for the Treeline (TL) ex-perimental catchment for the 2011 water year (WY2011: 1 October 2010–30 September 2011) (Fig. 1). The study area is unique because it is located at both a climatic tran-sition between rain and snow, and a vegetation trantran-sition between shrub lands and forests. The catchment is instru-mented specifically to quantify the distribution of precipi-tation, snow cover, and soil moisture. Table 1 summarizes the hydro-meteorological parameters presented and Fig. 1 locates catchment instrumentation. Table 2 summarizes the distributed watershed data presented.
The data set provides a high-resolution, fine-scale set of observations that offer a broad spectrum of researchers an opportunity to study a host of topics associated with wa-ter storage and flux in a small catchment. Model developers can use distributed soil and topographic data to obtain state variables, serially complete and gap filled weather data to drive, and snow, soil moisture, and streamflow data to evalu-ate the model performance. Detailed topographic data com-bined with soil moisture measurements can be used to eval-uate the underlying topographic indices commonly used in
Table 3.Soil profile names, aspects, and sensor depths.
Profile name Aspect Sensor depths (cm)
Npit3 NE 5, 15, 60, 100
Npit4 NE 5, 15, 30, 45, 65
SD05 SW 15, 101
SU05 SW 9, 27
SU10 SW 15, 52
SU20 SW 12, 34
SU30 SW 18, 70
many empirical streamflow models (O’Loughlin, 1981 and 1986; Beven and Kirkby, 1979). Soil moisture redistribution algorithms that account for diffuse and preferential flow can be tested to evaluate the timing of soil moisture responses at depths.
2 Catchment description
168 P. R. Kormos et al.: Soil, snow, weather, and sub-surface storage data from a mountain catchment
Figure 2.Precipitation and streamflow from the Treeline experimental catchment for WY2011. Cumulative shielded, unshielded, and wind-corrected precipitation with cumulative streamflow and the hydrograph are presented in(a). The phase of cumulative wind-corrected precip-itation based on dew point temperature is presented in(b).
Figure 3.Weather data measured at the Treeline experimental catchment for WY2011.(a)presents incoming measured and gap-filled solar and thermal radiation.(b)presents weekly average, minimum, and maximum air and dew point temperatures.(c)presents measured daily average, minimum, and maximum wind speeds.
extent of TL is defined by the location of a v-notch weir where catchment streamflow is measured (Fig. 1). The eleva-tion ranges from 1600 to 1645 m a.s.l. and the mean slope is 21◦. Vegetation is typical of a transition between lower
eleva-tion grasslands and higher elevaeleva-tion forests, with steep slopes and stark differences between aspects (Williams et al., 2009). The northeast facing slope is typified by sagebrush, cean-othus shrubs, prunusssp., forbs, and grasses with a mean canopy height of 0.7 m. Southwest facing slopes have
simi-lar but sparser vegetation with a mean height of 0.3 m. There are eight mature conifer trees in the catchment. Streamflow in upland ephemeral streams is disconnected from deep, re-gional groundwater (Miller et al., 2008), perhaps due to high bedrock hydraulic conductivity, which has been esti-mated at 10.93 m s−1 (Hoffman, 2008). Soils are thin (20–
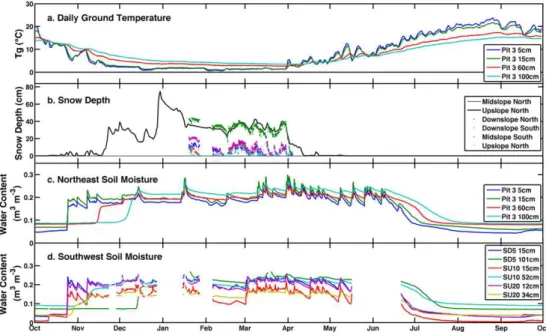
Figure 4.Soil and snow data from the Treeline experimental catchment for WY2011. Daily average soil temperature(a)and moisture(c) from pit 3 on the northeast facing slope, and soil moisture from several pits from the southwest facing slope(d)are presented. Snow depths from six locations are presented in(b).
sources of groundwater recharge (Aishlin and McNamara, 2011). Several studies have shown aspect differences on soil properties (Geroy et al., 2011; Tesfa et al., 2009; Smith et al., 2011).
3 Weather data
Weather data represent typical hydrological model forcing parameters, and include precipitation, solar and thermal ra-diation, air temperature and humidity, wind speed and direc-tion, and soil temperature. All weather data are hourly and se-rially complete for the entire WY2011. Data gaps have been filled using the most appropriate of either linear interpola-tion, or linear regression to nearby measurements of the same parameter.
Precipitation.Shielded and unshielded precipitation were measured at TL using Belfort-type gauges (Hanson et al., 2001), filtered following Nayak et al. (2008), and wind cor-rected using the protocol of Hanson et al. (2004). Precipi-tation and the stream hydrograph from the outlet weir are shown in Fig. 2a. The phase of cumulative wind-corrected precipitation based on dew point temperatures is shown in Fig. 2b (Marks et al., 2013).
Radiation. Serially complete incoming shortwave
and longwave radiation time series are presented in WEATHER_DATA.txt in the Supplement. Incoming and outgoing shortwave and longwave radiation data, as mea-sured at the four component radiometer, is presented in FOUR_COMPONENT_RAD.txt in the Supplement and are not gap filled. Shortwave radiation was measured by two
pyranometers at the TL weather station. A continuous hourly time series was generated using data from the two instru-ments, but favoring the more recently calibrated Huxeflux NR01 (Table 1). Incoming longwave radiation was measured by the four-component radiometer. Gaps in the measured longwave radiation record were substantial (48 %) and were filled using data from a pyrgeometer at 1720 m a.s.l. 3.8 km away within DCEW. Figure 3a presents the water year time series of incoming shortwave and longwave irradiance.
Air Temperature and Humidity.Air temperature (Ta) and relative humidity (RH) were measured at the TL weather station. Ta and RH were converted to dew point tempera-ture (Td) using methods developed by Marks et al. (1999), as applied and described by Reba et al. (2011). Figure 3b presents weekly minimum, maximum, and meanTaandTd for WY2011, which was a cooler year than average. The meanTawas 7.9◦C compared to the period of record mean, which was 9.3◦C. The maximumT
aof 31.8◦C was reached in late August while the minimum air Ta of −18.1◦C was
reached in late November. WY2011 was wetter than average with a meanTdof−1.67◦C compared to the period of record
mean of−2.24◦C. The maximumTdof 14.1◦C was reached in July, while the minimumTd of−23.8◦C was reached in
November. The dew point temperature was close to zero for much of the winter, demonstrating the sensitivity of the pre-cipitation phase at this study location to changes in humidity and temperature.
Wind Speed and Direction.Wind speed (u) and direction (v) were measured at the TL weather station. Hourlyu and
170 P. R. Kormos et al.: Soil, snow, weather, and sub-surface storage data from a mountain catchment
Figure 5.Aerial lidar-derived vegetation height over shaded topo-graphic relief map.
to 13.5 m s−1. Figure 3c presents daily u
max,umin, anduavg for WY2011. Wind speeds for WY2011 do not show a pro-nounced difference between storm and non storm time pe-riods. Both have median values of approximately 1.5 m s−1. Stormvis typically out of the southwest and ranges from 175◦ to 250◦ during winter storms, which agrees with work
in nearby areas (Winstral et al., 2013).
Soil Temperature.Soil temperature profiles are measured at all profile depths from Npit3 and Npit4 (Fig. 1, Table 3). Figure 4a and b present mean daily soil temperature profile data from Npit3 and mean daily snow depth, respectively.
4 Spatial characterization data
Characterization data are used to define the structure, com-position, land cover, soil structure and hydrologic properties of the TL catchment. These data provide the fine-scale detail required for modeling and hydrologic assessment.
4.1 Soil data
Soil depth and soil texture from the top 30 cm were obtained at 57 points across TL, representing the full range of expo-sures, slopes, and elevations in the catchment. Soil depths were measured by pounding a steel rod to refusal and soil texture was acquired by sieving core samples (mean sample size of 4.7 g) as described by Williams et al. (2009). In addi-tion, soil texture data from several depths at 14 locations are presented. Soil moisture data is presented that is collocated with texture profiles at locations SD05, SU05, SU10, SU20, and SU30 as described in the hydrologic response section of this paper.
4.2 GIS data
Terrain elevation and structure are derived from an aerial lidar data set acquired in 2009 and processed using Idaho State University’s publicly available lidar processing tools (http://bcal.geology.isu.edu/tools/lidar) as described in Streutker and Glen (2006). The processed TL GIS data in-cludes four components: (1) a 2.5 m bare earth digital eleva-tion model (DEM), from which (2) the catchment boundary is derived, GIS layers of (3) vegetation height, and (4) in-strument and soil measurement locations. Figure 5 presents a shaded relief image of the TL catchment, with overlying vegetation height.
5 Snow and hydrologic response data
5.1 Snow depth
Hourly snow depth was recorded by a depth sensor located mid-slope on the northeast facing slope (Fig. 1). These data were processed and cleaned, and are serially complete for WY2011. Figure 4b presents mean daily values for these data. Five additional ultrasonic snow depth sensors are lo-cated in a transect that covers the two dominant basin aspects (Fig. 1). Due to instrument malfunctions, only intermittent snow depth data from these 5 sensors are available from 19 January 2011 through melt-out (Fig. 4b).
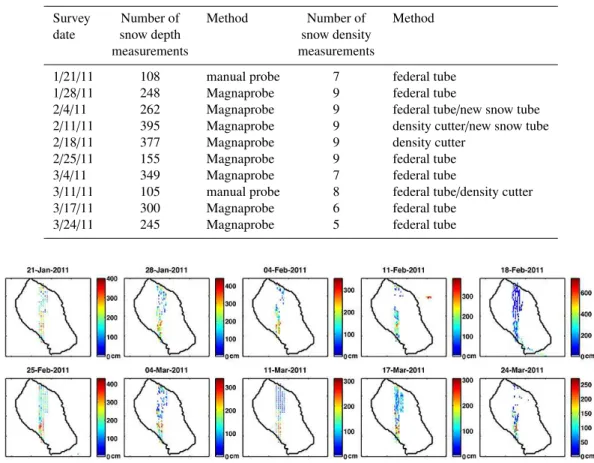
5.2 Snow survey data
Table 4.Summary of snow survey data including the date, and number and method of snow depth and density measurements.
Survey Number of Method Number of Method
date snow depth snow density
measurements measurements
1/21/11 108 manual probe 7 federal tube
1/28/11 248 Magnaprobe 9 federal tube
2/4/11 262 Magnaprobe 9 federal tube/new snow tube
2/11/11 395 Magnaprobe 9 density cutter/new snow tube
2/18/11 377 Magnaprobe 9 density cutter
2/25/11 155 Magnaprobe 9 federal tube
3/4/11 349 Magnaprobe 7 federal tube
3/11/11 105 manual probe 8 federal tube/density cutter
3/17/11 300 Magnaprobe 6 federal tube
3/24/11 245 Magnaprobe 5 federal tube
Figure 6.Gridded mean snow depth from 10 snow surveys.
5.3 Stream discharge
Stream discharge is derived from stage recorded with a pres-sure transducer in a v-notch weir at the catchment outlet. The stream that drains TL is intermittent and initiates in the fall when snow cover is established and dries out in early to mid-summer. Stream ice is rarely a hindrance to streamflow mea-surement as the stream is commonly insulated from brief ex-treme low temperatures by the snowpack. Due to equipment malfunctions, continuous stage measurements begin on 16 December and continue through the cessation of streamflow. Discharge was estimated for the period prior to December 16 from a series of manual measurements and by developing a relationship between stage at the TL weir and data from other nearby weirs within DCEW over the ten years of record. The average WY2011 stream discharge at the TL weir is 9.3 L per minute. The streamflow peak of record was caused by a ROS event on 16 January 2011, which resulted in a high flow of 449.3 L per minute. Figure 2a presents streamflow from the TL catchment.
5.4 Soil moisture
Soil moisture is recorded at two depths at five southwest facing soil moisture profiles and at four and five depths at
two northeast facing soil pits (Fig. 1, Table 3). TL soil mois-ture dynamics is described by McNamara et al. (2005). The coarse texture of TL soils leads to relatively rapid drainage when field capacity is exceeded. The semi-arid plant commu-nity draws soil moisture down quickly during spring green-up, but is slowed by spring rain events. Data from Npit3 and Npit4 are hourly and serially complete. Due to instrument malfunctions, gaps exist in soil moisture data from SD05, SU05, SU10, SU20, and SU30, as is typified in Fig. 4d. Fig-ure 4c and d present soil moistFig-ure data from Npit3 on the northeast facing slope and profiles SD05, SU10, and SU20 on the southwest facing slope. Shallow probes may be influ-enced by evaporation from the soil surface. Deepest sensors at all profiles were placed at the soil–bedrock interface, and may measure soil moisture increased due to the collection of water at the soil–bedrock interface, or the influence of lateral flow from upslope contributing areas.
6 Data availability
All data presented in this paper are available from the PANGAEA®website (doi:10.1594/PANGAEA.819837).
172 P. R. Kormos et al.: Soil, snow, weather, and sub-surface storage data from a mountain catchment
for additional details. Additional weather and hydrologic re-sponse data for the Treeline catchment and other catchments within the Dry Creek experimental watershed are available at http://earth.boisestate.edu/drycreek/data/and through the CUAHSI Hydrologic Information System.
7 Summary
Data presented in this paper are unique because (1) they capture complicated snow–soil–streamflow dynamics from the climatically sensitive rain–snow transition zone, and (2) they present a complete representation of the data required to characterize the hydrologic processes in this catchment. Spa-tial GIS data are derived from a lidar data set and represent the TL catchment topography and vegetation at a 2.5 m res-olution. In all, 57 surface soil texture data points and 14 soil texture profiles are presented. Hourly weather data have been gap filled and are continuous. Snow cover data are extensive and include continuous snow depths from 6 locations and 10 detailed weekly snow surveys. Catchment response data in-clude stream discharge at the basin outlet and soil moisture from multiple depths at seven locations in the basin.
Supplementary material related to this article is available online at http://www.earth-syst-sci-data.net/6/
165/2014/essd-6-165-2014-supplement.zip.
Acknowledgements. We thank M. Seyfried and A. Winstral for assisting in the preparation of this manuscript, L. Spaete at Boise Center Aerospace Laboratory with lidar processing, J. Huntington for soil profile installation, E. Boe for snow depth data, and M. Gribb for soil texture analysis. We thank the Northwest Water-shed Research Center and Boise State University Department of Geosciences, Student Research Initiative, and Graduate College for funding and travel support, and general support. NASA EPSCoR and INRA provided funding for this project. The collection and processing of the data presented in this paper were funded in part by NSF-CBET (0854553, 08522), USDA-ARS CRIS Snow and Hydrologic Processes in the Intermountain West (5362-13610-008-00D), USDA-NRCS Water and Climate Center-Portland, Oregon (5362-13610-008-03R), NSF-EPS (0919514), and NOAA (NA08NWS4620047). Any reference to specific equipment types or manufacturers is for information purposes and does not represent a product endorsement or recommendation. Boise State University and the USDA ARS are equal opportunity employers.
Edited by: A. Gelfan
References
Aishlin, P. and McNamara, J. P.: Bedrock infiltration and mountain block recharge accounting using chloride mass balance, Hydrol. Process., 25, 1934–1948, doi:10.1002/hyp.7950, 2011.
Beven, K. and Kirkby, M.: A physically based, variable contribut-ing area model of basin hydrology/Un modèle à base physique de zone d’appel variable de l’hydrologie du bassin versant, Hy-drolog. Sci. J., 24, 43–69, 1979.
Cayan, D. R., Kammerdiener, S. A., Dettinger, M. D., Caprio, J. M., and Peterson, D. H.: Changes in the onset of spring in the western United States, B. Am. Meteorol. Soc., 82, 399–415, doi:10.1175/1520-0477(2001)082<0399:citoos>2.3.co;2, 2001. Conger, S. M. and McClung, D. M.: Comparison of density
cut-ters for snow profile observations, J. Glaciol., 55, 163–169, doi:10.3189/002214309788609038, 2009.
Conway, H. and Raymond, C. F.: Snow stability during rain, J. Glaciol., 39, 635–642, 1993.
Cuo, L., Beyene, T. K., Voisin, N., Su, F., Lettenmaier, D. P., Al-berti, M., and Richey, J. E.: Effects of mid-twenty-first cen-tury climate and land cover change on the hydrology of the Puget Sound basin, Washington, Hydrol. Process., 25, 1729– 1753, doi:10.1002/hyp.7932, 2011.
Feiccabrino, J., Lundberg, A., and Gustafsson, D.: Improv-ing surface-based precipitation phase determination through air mass boundary identification, Hydrol. Res., 43, 179–191, doi:10.2166/nh.2012.060, 2012.
Geroy, I. J., Gribb, M. M., Marshall, H. P., Chandler, D. G., Ben-ner, S. G., and McNamara, J. P.: Aspect influences on soil water retention and storage, Hydrol. Process., 25, 3836–3842, doi:10.1002/hyp.8281, 2011.
Gribb, M. M., Forkutsa, I., Hansen, A., Chandler, D. G., and McNa-mara, J. P.: The Effect of Various Soil Hydraulic Property Esti-mates on Soil Moisture Simulations, Vadose Zone J., 8, 321–331, doi:10.2136/vzj2008.0088, 2009.
Hanson, C., Burgess, M. D., Windom, J. D., and Hartzmann, R. J.: New Weighing Mechanism for Precipitation Gauges, J. Hydrol. Eng., 6, 75–77, doi:10.1061/(ASCE)1084-0699(2001)6:1(75), 2001.
Hanson, C., Pierson, F., and Johnson, G.: Dual-Gauge Sys-tem for Measuring Precipitation: Historical Development and Use, J. Hydrol. Eng., 9, 350–359, doi:10.1061/ (ASCE)1084-0699(2004)9:5(350), 2004.
Harr, R. D.: Effects of clearcutting on rain-on-snow runoffin west-ern Oregon – a new look at old studies, Water Resour. Res., 22, 1095–1100, doi:10.1029/WR022i007p01095, 1986.
Hoffman, B. A.: Scale and heterogeneity in hydraulic properties of the fractured granitic Boise front, Boise, Idaho, M. Sc. The-sis, 51 pp., Dep. Of Geosci., Boise State University, avail-able at: http://icewater.boisestate.edu/boisefront-products/other/ Publications/Hoffman_2008Thesis.pdf (last access: 15 April 2014), 2008.
Judson, A. and Doesken N.: Density of freshly fallen snow in the Central Rocky Mountains, B. Am. Meteorol. Soc., 81, 1577– 1587, doi:10.1175/1520-0477(2000)081<1577:doffsi>2.3.co;2, 2000.
Kattelmann, R.: Flooding from rain-on-snow events in the Sierra Nevada, IAHS-AISH P., 239, 59–66, http://itia.ntua.gr/ hsj/redbooks/239/iahs_239_0000.pdf#page=69 (last access: 15 April 2014), 1996.
(SICI)1099-1085(199808/09)12:10/11<1569::AID-HYP682>3.0.CO;2-L, 1998.
Marks, D., Domingo, J., Susong, D., Link, T., and Garen, D.: A spatially distributed energy balance snowmelt model for appli-cation in mountain basins, Hydrol. Process., 13, 1935–1959, doi:10.1002/(SICI)1099-1085(199909)13:12/13< 1935::AID-HYP868>3.0.CO;2-C, 1999.
Marks, D., Winstral, A., Reba, M., Pomeroy, J., and Kumar, M.: An evaluation of methods for determining during-storm pre-cipitation phase and the rain/snow transition elevation at the surface in a mountain basin, Adv. Water Resour., 55, 98–110, doi:10.1016/j.advwatres.2012.11.012, 2013.
McCabe, G. J., Clark, M. P., and Hay, L. E.: Rain-on-snow events in the western United States, B. Am. Meteorol. Soc., 88, 319–328, doi:10.1175/bams-88-3-319, 2007.
McNamara, J. P., Chandler, D., Seyfried, M., and Achet, S.: Soil moisture states, lateral flow, and streamflow generation in a semi-arid, snowmelt-driven catchment, Hydrol. Process., 19, 4023– 4038, doi:10.1002/hyp.5869, 2005.
Miller, C. R., Routh, P. S., Brosten, T. R., and McNamara, J. P.: Application of time-lapse ERT imaging to watershed characteri-zation, Geophysics, 73, G7–G17, doi:10.1190/1.2907156, 2008. Morin, S., Lejeune, Y., Lesaffre, B., Panel, J.-M., Poncet, D., David, P., and Sudul, M.: An 18-yr long (1993–2011) snow and meteo-rological dataset from a mid-altitude mountain site (Col de Porte, France, 1325 m alt.) for driving and evaluating snowpack mod-els, Earth Syst. Sci. Data, 4, 13–21, doi:10.5194/essd-4-13-2012, 2012.
Mote, P. W.: Trends in snow water equivalent in the Pacific North-west and their climatic causes, Geophys. Res. Lett., 10, 1601, doi:10.1029/2003GL017258, 2003.
Nayak, A., Chandler, D. G., Marks, D., McNamara, J. P., and Seyfried, M.: Correction of electronic record for weighing bucket precipitation gauge measurements, Water Resour. Res., 44, W00D11, doi:10.1029/2008wr006875, 2008.
Nayak, A., Marks, D., Chandler, D. G., and Seyfried, M.: Long-term snow, climate, and streamflow trends at the Reynolds Creek Ex-perimental Watershed, Owyhee Mountains, Idaho, United States, Water Resour. Res., 46, W06519, doi:10.1029/2008wr007525, 2010.
Nolin, C. W. and Daly, C.: Mapping “at risk” snow in the Pacific Northwest, J. Hydrometeorol., 7, 1164–1171, doi:10.1175/jhm543.1, 2006.
O’Loughlin, E. M.: Saturation regions in catchments and their rela-tions to soil and topographic properties, J. Hydrol., 53, 229–246, 1981.
O’Loughlin, E. M.: Predictions of surface saturation zones in natu-ral catchments by topographic analysis, Water Resour. Res., 22, 794–804, doi:10.1029/WR022i005p00794, 1986.
Reba, M. L., Marks, D., Seyfried, M., Winstral, A., Kumar, M., and Flerchinger, G.: A long-term data set for hydrologic modeling in a snow-dominated mountain catchment, Water Resour. Res., 47, W07702, doi:10.1029/2010WR010030, 2011.
Reba, M. L., Pomeroy, J., Marks, D., and Link, T. E.: Estimating surface sublimation losses from snowpacks in a mountain catch-ment using eddy covariance and turbulent transfer calculations, Hydrol. Process., 26, 3699–3711, doi:10.1002/hyp.8372, 2012.
Seyfried, M., Hanson, C., Murdock, A., and Van Vactor, S.: Long-term lysimeter database, Reynolds Creek Experimental Water-shed, Idaho, United States, Water Resour. Res., 37, 2853–2856, doi:10.1029/2001WR000413, 2001a.
Seyfried, M., Flerchinger, G., Murdock, M., Hanson, C., and Van Vactor, S.: Long-term soil temperature database, Reynolds Creek Experimental Watershed, Idaho, United States, Water Resour. Res., 37, 2843–2846, doi:10.1029/2001WR000418, 2001b. Shallcross, A.: LiDAR Investigations of Snow Distribution in
Mountainous Terrain, M.S. thesis, 62 pp., Dep. of Geosci., Boise State University, http://scholarworks.boisestate.edu/td/349/(last access: 15 April 2014), 2012.
Smith, T. J., McNamara, J. P., Flores, A. N., Gribb, M. M., Aishlin, P. S., and Benner, S. G.: Small soil storage capacity limits benefit of winter snowpack to upland vegetation, Hydrol. Process., 25, 3858–3865, doi:10.1002/hyp.8340, 2011.
Streutker, D. R. and Glenn, N. F. LiDAR measurement of sagebrush steppe vegetation heights, Remote Sens. Environ., 102, 135–145, doi:10.1016/j.rse.2006.02.011, 2006.
Sui, J. and Koehler, G.: Rain-on-snow induced flood events in Southern Germany, J. Hydrol., 252, 205–220, doi:10.1016/s0022-1694(01)00460-7, 2001.
Surfleet, C. G, and Tullos, D.: Variability in effect of climate change on rain-on-snow peak flow events in a temperate climate, J. Hy-drol., 479, 24–34, doi:10.1016/j.jhydrol.2012.11.021, 2013. Tesfa, T. K., Tarboton, D. G., Chandler, D. G., and McNamara, J. P.:
Modeling soil depth from topographic and land cover attributes, Water Resour. Res., 45, W10438, doi:10.1029/2008WR007474, 2009.
Western, A. W. and Grayson, R. B.: The Tarrawarra data set: Soil moisture patterns, soil characteristics, and hydrologi-cal flux measurements, Water Resour. Res., 34, 2765–2768, doi:10.1029/98wr01833, 1998.
Williams, C. J., McNamara, J. P., and Chandler, D. G.: Controls on the temporal and spatial variability of soil moisture in a moun-tainous landscape: the signature of snow and complex terrain, Hydrol. Earth Syst. Sci., 13, 1325–1336, doi:10.5194/ hess-13-1325-2009, 2009.
Winstral, A. and Marks, D.: Long-term snow distribution observa-tions in a mountain catchment: Assessing variability, time sta-bility, and the representativeness of an index site, Water Resour. Res., 50, 293–305, doi:10.1002/2012WR013038, 2014. Winstral, A., Marks, D., and Gurney, R. Simulating wind-affected
snow accumulations at catchment to basin scales, Adv. Water Re-sour., 55, 64–79, doi:10.1016/j.advwatres.2012.08.011, 2013. Yenko, M.: Hydrometric and Geochemical Evidence of