Fábio Miguel Ferreira Vieira
Licenciado em Ciências de Engenharia de Micro e Nanotecnologias
Sunlight-driven CO
2
Conversion:
Producing Methane with Photovoltaics
Dissertação para obtenção do Grau de Mestre em
Engenharia de Micro e Nanotecnologia
Orientador: Dr. Manuel J. Mendes, Professor Auxiliar Convidado,
Faculdade de Ciências e Tecnologia, Universidade Nova de Lisboa
Co-orientador: Dra. Ana Machado, Investigadora Auxiliar,
Faculdade de Ciências e Tecnologia, Universidade Nova de Lisboa
Júri:
Presidente: Dr. Luís Miguel Nunes Pereira
Arguente: Dr. Carmen Mireya Rangel Archila
iii
Sunlight-driven CO2 Conversion: Producing Methane with Photovoltaics Copyright © Fábio Miguel Ferreira Vieira, Faculdade de Ciências e Tecnologia, Universidade Nova de Lisboa.
v
Acknowledgements
Antes de mais, gostaria de agradecer ao Dr. Rodrigo Martins, presidente do departamento de ciência dos materiais (DCM), e à Dra. Elvira Fortunato, diretora do centro de investigação de materiais (CENIMAT), por criarem este curso único, a que me dediquei nestes ultimos anos. Quero também fazer um agradecimento especial ao Dr. Manuel Mendes, meu orientador, e à Dra. Ana Reis Machado, minha co-orientadora, pela oportunidade de trabalhar neste tema inovador e pela ajuda prestada sempre que a solicitei. Um agradecimento também a todos os professores que me acompanharam durante estes 5 anos, que me guiaram até este ponto.
Quero agradecer também a todos os colegas que me acompanharam durante estes 5 anos, com quem travei amizades duradouras por entre trabalho, dedicação e muitas festas e finais de tarde passados com excelente companhia. Um especial agradecimento ao Manuel e ao Miguel, que embarcaram nesta aventura que é a simulação juntamente comigo, ao Bernardo por toda a troca de ideias e entreajuda durante estes ultimos meses e à Debora, ao Lima, à Rita, ao Teles e à Péssima por todo o apoio, amizade e entreajuda durante estes anos.
Gostaria ainda de agradecer ao meu grande grupo de amigos que me acompanham desde o secundário, Rita Caneco, Rita Mateus, Mariana, Coelho, Henrique, Rosa, Gonçalo e Guizadas, por me proporcionarem quase todas as semanas um grande alívio de stress. Que continuemos juntos por muitos e bons anos e arranjemos sempre tempo para um café e um joguinho de setas.
vii
Abstract
Due to greenhouse gas emissions, CO2 capture and utilization (CCU) technologies are being immensely researched. In these technologies, CO2 from gas emissions or directly from the atmosphere is converted into chemical products. One of these technologies is artificial photosynthesis, which uses solar energy, carbon dioxide and water to generate hydrocarbon fuels, being methane (CH4) a preferential target due to the already in place infrastructures for its storage, distribution and consumption. Based on electrochemical kinetic models, two different approaches to the production of CH4 via artificial photosynthesis were modelled. One approach was a 1-step transformation of CO2 and water into CH4 in a solar powered electrochemical cell (EC). The other was a more conventional 2-step production starting with the solar powered synthesis of an intermediate fuel - syngas (a mixture of carbon monoxide (CO) and molecular hydrogen (H2) - followed by the conversion of syngas to CH4 via a Fischer-Tropsch process. The results of the developed simulations reveal that the 1-step method could be applied to a domestic, small scale use, potentially providing energy for a single-family house, whilst the 2-step method can be used in small and large scales applications, from domestic to industrial applications. In terms of overall solar-to-CH4 energy efficiency, the 2-step method reaches a value of 13.63 % against the 9.18 % reached by the 1-step method.
ix
Resumo
Devido às emissões de gases com efeito de estufa, tecnologias de captura e utilização de CO2 têm sido intensamente investigadas, sendo o CO2 proveniente de emissões gasosas ou capturado diretamente da atmosfera convertido em produtos químicos. A fotossíntese artificial é uma destas tecnologias, que utiliza energia solar, dióxido de carbono e água para produzir produtos químicos. O metano (CH4) é um produto preferencial, devido a já se encontrarem implementadas infraestruturas para o seu armazenamento, distribuição e consumo. Utilizando modelos de cinética eletroquímica, foram modeladas duas abordagens diferentes para a produção de CH4 através da fotossíntese artificial. Uma abordagem foi a conversão direta de CO2 e água em metano numa célula eletroquímica alimentada por um sistema fotovoltaico. A outra foi uma conversão convencional de duas etapas, a primeira sendo a produção alimentada a energia solar de um combustível percursor - gás de síntese (uma mistura de monóxido de carbono (CO) e hidrogénio molecular (H2)) - numa célula eletroquímica, seguida da conversão desse percursor em CH4 por via de uma síntese de Fischer-Tropsch. Os resultados dessas simulações mostram que o primeiro método (1-etapa) é apropriado para um uso a uma escala mais pequena, potencialmente fornecendo energia para uma casa, enquanto o segundo método (2-etapas) pode ser aplicado em usos domésticos ou industriais. Em termos de eficiência energética, o segundo método tem uma eficiência de 13.63 % enquanto que o primeiro método tem uma eficiência energética de 9.18 %.
Palavras-chave: Fotossíntese artificial, Conversão eletroquímica alimentada por
xi
Table of Contents
Acknowledgements ... v
Abstract ... vii
Resumo ... ix
List of Figures... xiii
List of Tables ... xv
Abbreviations ... xvii
Symbols ... xvii
Motivation and Objectives ... xxi
I. Introduction ... 1
1.1. Water Electrolysis ... 2
1.2. CO2 Electrolysis ... 3
1.3. Fischer-Tropsch Synthesis ... 4
II. Model Description ... 7
2.1. Electrolysis ... 7
2.2. Fischer-Tropsch Synthesis ... 8
III. Results and Discussion ... 9
3.1. Electrolysis ... 9
3.1.1. Description of the PV system ... 10
3.1.2. Simulation of the electrochemical IV curves ... 12
3.1.3. Electrolysis Temperature Dependence ... 14
3.1.4. Determination of the operation voltage and current ... 15
3.2. Fisher-Tropsch Synthesis ... 18
3.2.1. Energy requirements for FTS ... 22
3.3. 1-Step Methanation vs 2-Step Methanation ... 24
3.4. Practical application ... 26
IV. Conclusion ... 27
4.1. Future Perspectives ... 28
xii
xiii
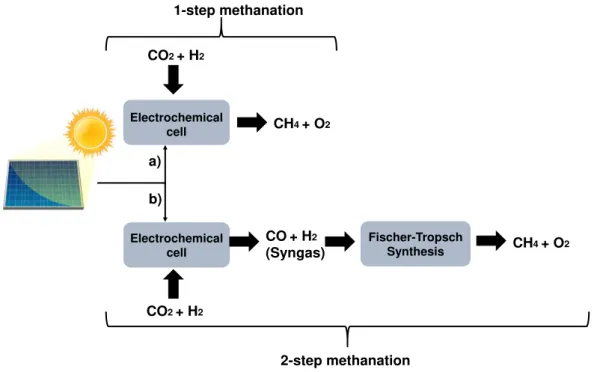
List of Figures
Figure I.1 - The two pathways for methanation studied: a) direct methanation (1-step) pathway, and b) syngas production and FTS methanation (2-(1-step) pathway. 2 Figure I.2 - Schematic of an electrochemical cell powered up by a photovoltaic (PV) system comprising 3 series connected Perovskite solar cells. The series interconnection is necessary to allow the PV module to supply the required photovoltage to drive the reaction with reasonable yield of synthesized products. This cell is used to produce CO using Au as a cathode. Adapted from [18]. ... 4 Figure I.3 - FTS reaction steps. Adapted from [34]. ... 5 Figure III.1 – Electrochemical systems considered for direct methanation (1-step process) on the left, and for syngas production (2-step process) on the right. ... 9 Figure III.2 – On the left, picture of the SunpowerTM B50 solar cell and, on the right, its IV responses for different irradiations and temperature [48]. There are no bus bars visible on the solar cell front due to its interdigitated back contact (IBC) configuration. ... 11 Figure III.3 - Comparison between the simulated (red) and the experimental (green) cathodic current densities for a) the direct methanation and b) the syngas production. Experimental cathodic current densities extracted from [49]. ... 12 Figure III.4 - Temperature dependence of the electrochemical curves for a) direct methanation and b) syngas production. ... 14 Figure III.5 – Representation of the basic module of the PV system, consisting of five
xiv
xv
List of Tables
Table III.1 – Characteristics of the SunpowerTM B50 solar cell @ Standard Test
Conditions (STC) (1000 W/m2, AM 1.5G and cell temperature of 25 ºC) [48]. ... 11
Table III.2- EC parameters for modelling direct methanation (1-step) and syngas production (2-step). ... 13
Table III.3 – Performance of the 1-step process with increasing PV area. ... 17
Table III.4 – Performance of the 2-step process with increasing PV area. ... 18
Table III.5 - Production of the EC’s for both processes per m2 of active PV area. .. 18
Table III.6 - Kinetic parameters for Equations (15) and (16). ... 20
Table III.7 –Parameters of Mousavi’s Model. ... 21
Table III.8–Parameters of Rönsch’s Model. ... 21
Table III.9 – FTS reaction rates for PCO=5 bar. ... 22
Table III.10 – Parameters for calculating the syngas heating power. ... 23
Table III.11 – Production of the 1- and 2-steps processes in volume and equivalent energy of CH4. ... 24
xvii
Abbreviations
CCU – Carbon Capture and Utilization EC - Electrochemical Cell
FTS – Fischer-Tropsch Synthesis
HTFTS – High Temperature Fischer-Tropsch Synthesis I-V - Current-Voltage
LTFTS – Low Temperature Fischer-Tropsch Synthesis PV – Photovoltaic
P-V – Power-Voltage
Syngas – Synthesis gas (CO+H2)
Symbols
αa– Anodic transfer coefficient
αc– Cathodic transfer coefficient
η– Overpotential [v]
ΔH0C – Enthalpy of adsorption for C [J/mol]
ΔH0H – Enthalpy of adsorption for H [J/mol] A – Rate constant [mol/Kgcat.s]
A0– Activation energy in standard conditions [J/mol] cp – specific heat [kJ/kg.K]
E0– Equilibrium potential in standard conditions [V] E.E. – Energy efficiency
e- - Electron
ef – Faradaic efficiency
xviii h – heat flow rate [kW]
I – Current [A]
Impp– Current for the maximum power point [A] ISC– Short circuit current [A]
j – Current density [A/cm2]
j0– Exchange-current density [A/cm2]
k01,18%Ni– Preexponential factor of rate coefficient k1,18%Ni [mol/Kgcat.s] k01,50%Ni– Preexponential factor of rate coefficient k1,50%Ni [mol/Kgcat.s] k1,18%Ni – Rate coefficient of CO for a 18%Ni-based catalyst [mol/Kgcat.s] k1,50%Ni – Rate coefficient of CO for a 50%Ni-based catalyst [mol/Kgcat.s] kFe – Adsorption coefficient for Fe
kCo – Adsorption coefficient for Co
K0C– Preexponential factor of adsorption constant for carbon K0H – Preexponential factor of adsorption constant for hydrogen KC– Adsorption constant for carbon
KH – Adsorption constant for hydrogen mi– Number of moles of species i [mol]
ni– Number of electrons transferred in the formation of species i
P – Power [W]
Pmpp– Power for the maximum power point [W] PCO– Partial Pressure of CO [bar]
PH2– Partial Pressure of H2 [bar] Q – Charge [A/s]
xix R – Ideal Gas constant [J/mol.K]
T – Temperature [K] V – Voltage [V]
xxi
Motivation and Objectives
The continuous use of fossil fuels is causing rampant emissions of greenhouse gases to the atmosphere, threatening earth’s ecosystems by changing the global climate. Whilst clean fuel alternatives such as solar, wind and hydro are being studied, the atmosphere has still serious concentration levels of greenhouse gases. Artificial photosynthesis is a man-made process that is based of the photosynthesis process in nature, consisting in harvesting solar energy and use that energy to produce fuels made from water and carbon dioxide, being the latter one of the most important greenhouse gases. Artificial photosynthesis produces clean fuels while reducing the atmospheric concentration of greenhouse gases, becoming an attractive technology for the future, making extensive research necessary to understand this technology and adapt it to everyday life.
1
I.
Introduction
Continuous usage of carbon-rich fossil fuels — coal, oil and natural gas — to produce energy has brought forth an unprecedented era of advancements for human society. However, this caused an increasing CO2 concentration in the atmosphere, changing from 278 ppm, before the industrial revolution, to 403 ppm in 2016 [1], [2]. This higher concentration is a major contributor to the greenhouse effect, causing temperature raises and climatic changes. Therefore, the capture and transformation of carbon dioxide, via artificial photosynthesis, into hydrocarbons, could lead to the beginning of a carbon-neutral society [1]–[10]. The most researched artificial photosynthesis process is the production of molecular hydrogen by splitting water. This process has reached record solar-to-fuel efficiencies over 16 % [11].
Artificial photosynthesis mimics the original process found in nature, utilizing an electrochemical cell (EC) powered by a photovoltaic (PV) system, with a feedstock of CO2 and water. This process can be used to produce various sustainable hydrocarbon fuels, effectively producing fuel while consuming one of the major greenhouse gases and providing a clean alternative to fossil fuels, with the advantage of room temperature operation [12]–[15]. This capture and transformation of CO2 through solar power is a closed-loop fuel cycle - effectively producing carbon-neutral fuels. It should be noted, however, that the splitting of CO2 is a complex process and it presents great technological challenges in achieving high efficiencies. Thus, the development of a trustworthy method to simulate this process is imperative [1], [10], [12]–[18].
2
1.1.
Water Electrolysis
The most conventional approach for solar fuels production is water splitting via artificial photosynthesis approaches [6], [8], [20], [21]. In this process, water is separated into oxygen and hydrogen via electrochemical reactions promoted by an external stimulus. The stimulus applied could be provided by different energy sources, i.e. light (photolysis), heat (thermolysis) or electricity (electrolysis) [8], [10], [15], [16]. In water electrolysis, a current is driven through two submerged electrodes - the anode and the cathode – with hydrogen being formed on the cathode and oxygen in the anode, but only if enough electric potential is provided to activate the water reduction reactions, since they are occurring are endothermic [1], [21], [22].
At the anode:
H O(l)
22H
1
O
22
2
e
+
+
+
− 0anode
E
=
1.23 V
(1)At the cathode:
2H
++
2
e
−H
2E
0cathode=
0 V
(2)Global reaction:
H O(l)
2H
21
O
22
+
E
0cell=
1.23 V
(3)As seen above, the equilibrium potential (E0) required to split the water Fischer-Tropsch
Synthesis Electrochemical
cell
Electrochemical cell CO2 + H2
CH4 + O2
CH4 + O2
CO2 + H2
a)
b)
CO + H2
(Syngas)
2-step methanation 1-step methanation
3
molecules, at standard conditions, is 1.23 V, although, experimentally, around 1.9 V are required, in order to surpass ohmic losses and electrode defects. This additional potential needed is known as overpotential [6], [15], [18], [21].
1.2.
CO
2Electrolysis
CO2 electrolysis follows the same principles as water electrolysis. Several products can be formed, depending on how many electron reductions are involved in the reaction [23]. This study will focus in the production of CO, via a 2 electron reduction having H2 and O2 as subproducts, allowing the harvest of syngas in the cathode; as well as in the production of CH4, also called methanation, via a 8 electron reduction having O2 as a subproduct [10], [17], [23]. The product selectivity mainly depends on the electrocatalyst material used in the cathode, e.g. silver for CO and copper for CH4, and the provided electric potential.
The main barriers that this technology faces could be improved with better-performing catalysts. Namely, these electrolyzers can only typically operate with high overpotentials, low current densities, and present poor product selectivity - correlating with low faradaic efficiency – leading to a loss of performance over time. Faradaic efficiency describes how efficiently charges are transferred in a electrochemical reaction [10]. Copper is the favorite electrocatalyst for CH4 synthesis, combining substantial current densities with reasonable overpotentials and faradaic efficiency [1], [2], [10], [16], [17], [23]–[25], and silver is the preferred for syngas production [1]–[3], [10], [15], [16], [24], [26]. For the anode, iridium oxide (IrO2) is the preferred material[1], [6], [9], [14], [16]–[18], [24], [25], [27]–[33]. Next are presented the global equations for methanation (4) and syngas production (5):
Methanation : 0
2 2 4 2 cell
CO
+
2H O
CH
+
2O E
=
1.06 V
(4)Syngas synthesis: 0
2 2 cell
1
CO
CO+
O E
1.34 V
2
=
(5)4
Another issue that arises with CO2 electrolysis is the competition between CO2 reduction and water reduction, making it difficult to single out only one. This occurs due to CO2 and H2O equilibrium potentials whose similarity leads to low faradaic efficiencies. In methanation, due to the larger gap between the equilibrium potentials and consequent of the use of Cu, it is possible to achieve more reasonable faradaic efficiencies [19], [35]. In Figure I.2, a schematic of a possible electrochemical cell is shown.
Figure I.2 - Schematic of an electrochemical cell powered up by a photovoltaic (PV)
system comprising 3 series connected Perovskite solar cells. The series interconnection
is necessary to allow the PV module to supply the required photovoltage to drive the
reaction with reasonable yield of synthesized products. This cell is used to produce CO
using Au as a cathode. Adapted from [18].
1.3.
Fischer-Tropsch Synthesis
FTS is a process that converts syngas into a wide range of hydrocarbons with the help of a catalyst. The C-O bond is broken, allowing the carbon and hydrogen to react with molecular hydrogen, that results in the formation of hydrocarbons, water and, in a lesser extent, carbon dioxide. The product distribution of FTS follows a recognizable pattern, with the possible reactions happening in function of the CO:H2 ratio of the syngas [27], [36]–[44].
2 2 2
CO 2 H
C H
n nH O
n
+
n
→
+
n
(6)
2 2 2 2
CO (2
1)H
C H
n nH O
n
+
n
+
→
++
n
(7)
For CH4 production, the syngas entering the FTS chamber must have a ratio of CO:H of 3:1 to guarantee the highest selectivity for CH4 production[36], [38], [44]. The methanation process by FTS is shown in Figure I.3.
The prime catalysts for FTS are Fe, Co, Ni, Ru, with only Fe and Co being used in Solar cells
Anode
5
commercial applications. Ru is not commonly used despite being the most active due to its scarcity and high price. Ni, on the other hand, is neglected for its low catalyst capabilities of producing long chains of hydrocarbons, although it has a high selectivity for methane production [40], [41], [43], [45]. Fe and Co can operate stably under optimized conditions. Nevertheless, when in disfavourable operation conditions – high temperature and flow rate – Fe is more advantageous due to its higher resistance against operational poisons, e.g. halogenated compounds. By contrast, Co has a longer lifetime than Fe and is more active at low temperatures, but needs a cleaner syngas (its more susceptible to poisons) [36], [39], [43]. Finally, Fe has positive effect on the reaction rate with increasing CO partial pressure, whilst other catalysts are not influenced by this parameter [40], [43].
FTS product distribution is sensitive to pressure and temperature, since the FTS reaction is strongly exothermic, generating around 150 kJ/mole of converted CO2. Therefore, it is necessary to precisely control temperature and heat exchanges, with the goal of maximizing the desired products and maintain catalyst stability. As such, there are two main operating temperature classes for FT reactors: High-Temperature FTS (HTFTS) reactors and Low-Temperature FTS (LTFTS) reactors [36], [38], [40].
LTFTS reactors work in the range of 180-250 ºC and are capable of synthesis of long-chain hydrocarbons waxes and paraffins. This process is employed in the synthesis of high-quality sulfur-free diesel fuels. Fe and Co are the catalyst of choice here, with Co performing better for lower temperatures [36], [37], [40].
HTFTS reactors operate in the range of 300-350 ºC, mainly producing light hydrocarbons in the gas phase. This process is best suited to produce gasoline. The extraction of chemicals is also possible, thanks to the high selectivity towards linear 1-olefins and oxygenates permits the extraction of chemicals. Since it operates at high temperatures, the preferred catalysts are iron-based [36], [37], [40].
7
II.
Model Description
All the results obtained in this work were simulated by modelling the electrolysis and FTS process, from their kinetic reactions. A kinetic model consists in a mathematical representation of how a reaction evolves through time as a function of
the system’s components.
2.1.
Electrolysis
In the process of electrolysis, the global equation that describes the charge-transfer kinetics occurring at the anode and the cathode is the Butler-Volmer equation (eq.8) [10], [25],
(
0)
(
0)
0
exp(
)-exp (
a
F v
E
cF v
E
j
j
RT
RT
− −
− −
=
(8)
Where j is the reaction current density, j0 is the exchange-current density, v is the applied voltage,
α
a andα
c are the anodic and cathodic transfer coefficients, whichare a characteristic of the electrodes used,
η
is the overpotential, E0 is the equilibrium potential in standard conditions, F is Faraday’s constant, R is the ideal gas constant and T is the temperature. Solving the Butler-Volmer equation in function of the applied potential on the electrodes allows the tracing of a JV curve of the electrochemical cell. The overpotential used here encapsulates all the different overpotentials that affect the reactions, in order to simplify the model.The energy and faradaic efficiencies of the EC are also important parameters, which are given by the following equations [6], [10]:
0
0
E
E.E.
E
e
f=
+
(9)Where E.E is the energy efficiency and ef is the faradaic efficiency. Energy efficiency is the ratio between the energy contained in the products and the electrical energy applied, whereas the faradaic efficiency is the fraction of the charge provided that was utilized in the reaction. The faradaic efficiencies used in this work are based of the common values found on literature, which are around 100% for CO production and 80% for methanation [6], [10], [24], [46].
8 (10) [6], [10],
i
m
E.E.
F
iQ
n
=
(10)
where mi represents the number of moles of specie i generated, ni is number of electrons transferred per molecule of product and Q the total charge.
2.2.
Fischer-Tropsch Synthesis
FTS modelling is a widely researched subject leading to many proposed rate equations to describe the process. In 2015, Mousavi et al. [43] did a comprehensive study of all the proposed mechanisms and equation for cobalt and iron based FTS, arriving at a rate equation that best describes the process, presented here as Equation 11. 2 0.75 H CO 2 CO
P
P
r
A
(1
P )
b
b
k
=
+
(11)In the rate equation, proposed by Mousavi et al. (2015), rb is the reaction rate for the catalyst b (cobalt or iron), PH2 and PCO are the partial pressures of H2 and CO, respectively, kb is the adsorption coefficient of CO and A is a rate constant. This latter parameter is only valid for temperatures of 533K, being a LTFT process.
Since nickel is a highly selective catalyst for methane production, Rönsch et al. [47] developed rate equations for FTS methanation using commercial catalysts with 18% and 50% of nickel. The rate equations proposed by Rönsch et al. (2015) are the following:
2
2
2 0.5 1,18%Ni C H CO H
18% Ni 0.5 0.5 3
C CO H H
k
K K P P
r
(1 K P
K P )
= −
+
+
(12)2
2
2 0.5 1,50% Ni C H CO H
50% Ni 0.5 0.5 3
C CO H H
k
K K P P
r
(1 K P
K P )
= −
+
+
(13)9
III.
Results and Discussion
In this chapter, the results of the simulation studies are presented and analyzed to evaluate both 1-step and 2-step solar-to-methane production approaches shown in Figure I.1.
3.1.
Electrolysis
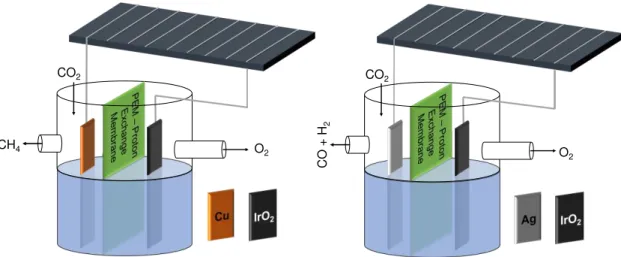
To simulate the electrolysis, a description of the electrochemical processes of the two methanation methods is necessary. Figure III.1 represents the electrochemical systems for direct methanation (route (a) in Figure I.1) and syngas (route (b) in Figure I.1) production, respectively.
Figure III.1
–
Electrochemical systems considered for direct methanation (1-step
process) on the left, and for syngas production (2-step process) on the right.
An Ag electrode was considered for syngas and Cu for methane production. In the center of the ECs, a proton exchange membrane (PEM) is used to separate the anode from the cathode and to facilitate the separation of the cathodic and anodic reaction products [2], [6], [10]. This membrane only allows H+to pass through it, maintaining the cathodic and anodic reaction products separated. Various simulations were made whilst changing the ratios between the areas of PV and electrodes and the best results were obtained when the area of the electrodes is 10 % of the area of PV. With a smaller percentage, the current in the electrodes could not match the PV current ( the electrochemical and the PV IV curves did not intercept) and with
O2
CO2
CO
+ H
2
O2 CO2
10
bigger percentages the electrochemical cell was operating in a less than ideal zone of its electrochemical curve (in an unstable zone of the electrochemical IV curve). In relation to the CO2 in the cell, a constant overflow of CO2 is considered to eliminate it as a limiting factor, in order to calculate the maximum output of the electrochemical devices because for every mol of hydrocarbon produced, the same amount of CO2 is spent, following the reaction stoichiometry. The EC works at ambient temperature (25 ºC), and the PV system powering the EC is built with modules made of the commercial mono crystalline silicon solar cell SunpowerTM B50 [48]. A commercial solar cell was chosen instead of simulating a brand new in order to ground the simulation in reality. All the assumptions made for the ECs are then the following:
• Constant overflow of CO2;
• Ambient temperature (25º C);
• Area PV:Area EC ratio of 10:1;
• Cu cathode for methanation and Ag cathode for syngas production;
• IrO2 anode for both ECs;
• Commercial mono crystalline silicon solar cell SunpowerTM B50 for
powering the ECs;
• PEM used to facilitate the product removal.
3.1.1.
Description of the PV system
As mentioned in the previous section, the building block of the PV system is a commercial mono-crystalline silicon solar cell (SunpowerTM B50). The characteristics of this commercial cell are presented on Table III.1, where Pmpp, Vmpp and Impp are the power, voltage and current, respectively, for the maximum power point of the cell, Voc is the open circuit voltage and Isc is the short circuit current. In Figure III.2 an image of the solar cell and its IV curves for different irradiations are presented [48].
11
Table III.1
–
Characteristics of the Sunpower
TMB50 solar cell @ Standard Test
Conditions (STC) (1000 W/m
2, AM 1.5G and cell temperature of 25 ºC) [48].
Pmpp (Wp) 3.15
Efficiency (%) 21.2
Vmpp (V) 0.571
Impp (A) 5.51
Voc (V) 0.673
Isc (A) 5.87
Area (cm2) 156.25
Figure III.2
–
On the left, picture of the Sunpower
TMB50 solar cell and, on the right, its
IV responses for different irradiations and temperature [48]. There are no bus bars visible
on the solar cell front due to its interdigitated back contact (IBC) configuration.
As solar energy is an intermittent source of energy, its direct use and storage proves difficult. So, there is currently the need to compensate the energy fluctuations to the grid via thermal generation, usually provided by fossil fuel combustion. Using solar energy as a means to produce clean hydrocarbons, as methane, this intermittency problem is resolved, creating a robust and carbon-neutral storage system [2], [15].
1
2
5
mm
12
3.1.2.
Simulation of the electrochemical IV curves
From the Butler-Volmer equation (Equation 8), the EC characteristic curve (IV) can be obtained by establishing the value of the parameters involved. While
temperature, Faraday’s and ideal gas constants are known parameters, the
overpotential (η), the exchange-current density (J0) and the anodic/cathodic transfer coefficients (
α
a/c) need to be simulated. To find these parameters, theelectrochemical curve was simulated against experimental curves from the works of Singh, Clark and Bell (2015), that were obtained using the same electrodes and basis conditions [49]. In Figure III.3, it is represented the best simulated approximation of the experimental data for the cathode reaction.
2.2 2.3 2.4 2.5 2.6 2.7 2.8
0 1 2 3 4 5
2.1 2.2 2.3 2.4 2.5 2.6 2.7
0 2 4 6 8 10 12 14 Curren t Den si ty (mA/cm 2 ) Curren t Den si ty (mA/cm 2 ) Voltage (V) Simulated Experimental Data
CO
2-to-Syngas EC synthesis
b)
Voltage (V) Simulated
Experimental Data
a)
CO
2-to-CH
4EC synthesis
Figure III.3 - Comparison between the simulated (red) and the experimental (green)
cathodic current densities for a) the direct methanation and b) the syngas production.
Experimental cathodic current densities extracted from [49].
13
substantialy higher exchange-current density in the 2-step process. J0 represents the balanced Faradaic current at equilibrium, i.e. the residual current when there is no aplied potential. The lower this exchange-current is, the larger the overpotential is, resulting in a sluggish reaction [10], [19], [25], [51]. Consequently, the 1-Step process has a slower, less efficient reaction, that can be atributed to its higher number of substeps (8 electronic exchanges as compared with only 2 for syngas production).
The transfer coefficients (
α
a/c) are the fraction between the polarization changein the anode and the cathode, that are intimately tied with the reaction rate. As both processes occur in the cathode, while oxygen evolution occurs in the anode, the tranfer coefficients referring to the anode are null. The slightly higher transfer coefficient, for the CO production step, is once more in line with the rest of the inferences made previously, which are supported by the literature [1], [6], [10], [15], [17], [18], [25], [51].
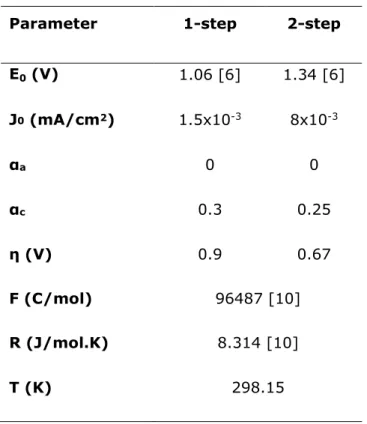
Table III.2- EC parameters for modelling direct methanation (1-step) and syngas
production (2-step).
Parameter 1-step 2-step
E0 (V) 1.06 [6] 1.34 [6]
J0 (mA/cm2) 1.5x10⁻³ 8x10⁻³
αa 0 0
αc 0.3 0.25
η (V) 0.9 0.67
F (C/mol) 96487 [10]
R (J/mol.K) 8.314 [10]
T (K) 298.15
14
80% for methanation [6], [10], [24], [46]. Therefore, the energy efficiencies for direct methanation and syngas production are 43.3 % and 66.7 % (Equation 9), respectively. A better understanding of the electrochemical reactions mechanisms of both processes is needed to increase these efficiencies.
3.1.3.
Electrolysis Temperature Dependence
This electrochemical system is being designed to operate at ambient temperature, without a need for temperature control. However, different regions in the world have different ambient temperatures, meaning that 298.15 K (25 ºC) is not valid everywhere. One other possibility, already studied for photoelectrochemical devices [20], is the use of a compact PV-EC device. This device would operate at higher temperatures than the ambient one, since the PV components would release heat to the EC. Thus, a study on how temperature affects the electrochemical reaction was conducted in order to determine if such device could be applicable in this technology. In Figure III.4 are presented IV curves at different temperatures for both electrochemical processes.
2.7 2.8 2.9 3.0
0 5 10 15 20
2.6 2.7 2.8 2.9 3.0
0 5 10 15 20 b) Curre n t Den s it y (m A/cm 2 ) Voltage (V) 280 K 290 K 300 K 310 K 320 K
T
a) Curre n t Den s it y (m A/cm 2 ) Voltage (V) 280 K 290 K 300 K 310 K 320 KT
Figure III.4 - Temperature dependence of the electrochemical curves for a) direct
methanation and b) syngas production.
15
CO2. This trend is actually opposite to what is expected in literature, with ECs performance increasing with temperature[2], [8], [20], [21], [52], [53]. This shows a limitation of this model and means that is only usable for modelling electrochemical reactions at 25 ºC. A better, more advanced model is needed to evaluate the evolution of ECs with temperature, adding a thermal model as done by Olivier et al. (2016) [52].
3.1.4.
Determination of the operation voltage and current
The calculation of the production rate of the ECs requires the definition of the operation voltage and current. These parameters are given by the intersection
between the PV’s and the EC’s I-V curves, which should ideally occur at the maximum power point of the PV cell (i.e. at Vmpp and Impp) to operate with minimum energy losses [18]. This intersection is shown in Figure III.6. As will be mentioned later, a high operation voltage is necessary and, consequently, a custom-built solar module will be employed. So, utilizing the SunpowerTM B50 solar cells as the base units for the PV modules, it was calculated that a module consisting of five of such in series is the best for driving the electrochemical reactions for both processes.
16
Figure III.5
–
Representation of the basic module of the PV system, consisting of five
Sunpower
TMB50
solar cells in series.
0 1 2 3
0 2 4 6 Cu rrent ( A)
b)
Voltage (V) Cu rrent ( A)a)
EC I-VCO2-to-CH4 EC synthesis CO2-to-Syngas EC synthesis
0 5 10 15
0 1 2 3
0 2 4 6 Voltage (V) 0 5 10 15 P-V Pow er (W)
Figure III.6
–
I-V and power-voltage (P-V) curves of the basic PV module shown in Figure
III.5, overlaid with the electrochemical curve of a) methanation and b) syngas synthesis,
where in blue are represented the solar cell I-V curve, in black the EC IV curve and in
red the solar P-V curve.
0.0 0.5 1.0 1.5 2.0 2.5 3.0 3.5 0 50 100 150 200 250 300
0.0 0.5 1.0 1.5 2.0 2.5 3.0 3.5 0 50 100 150 200 250 300 I (A)
a)
Voltage (v) 5 modules in parallel 10 modules in parallel 25 modules in parallel 50 modules in parallelb)
CO2-to-CH4 EC synthesis CO2-to-Syngas EC synthesis
I (A)
Voltage (v)
Figure III.7 . The I-V curves of different PV sources composed of distinct number of
parallel-connected modules as that of Figure III.5, in order to add their current, overlaid
with the electrochemical load curves of a) methanation and b) syngas synthesis for 5,
10, 25 and 50 parallel modules.
+
-17
It is notable a higher production of syngas by CO2 reduction when compared to the much modest production of CH4 by CO2 direct methanation. This results from the, already mentioned in Introduction, higher efficiency and yield that syngas production presents and comes to strengthen the previous observation of being a faster reaction than methanation. It is observable in all curves that the direct methanation process occurs very closely to the maximum power point of the solar modules, which indicates a better solar to electrochemical efficiency in this process. In the case of syngas production, the PV system is not optimized for this electrochemical reaction, as the intersection does not occur at the maximum power point. Thus, it should be noted that with an optimized PV system the overall performance of PV-EC system would improve. However, note that syngas is just an intermediate fuel in route b) of Fig. I1, still requiring the subsequent FTS process to form CH4.
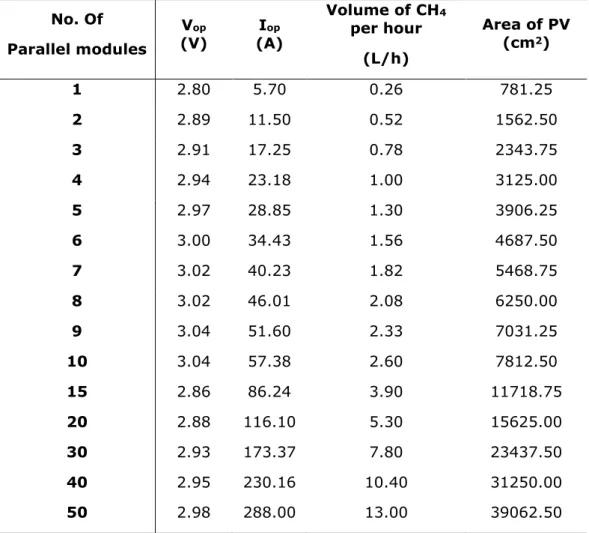
Table III.3
–
Performance of the 1-step process with increasing PV area.
No. Of
Parallel modules
Vop (V)
Iop (A)
Volume of CH4 per hour
(L/h)
Area of PV (cm2)
1 2.80 5.70 0.26 781.25
2 2.89 11.50 0.52 1562.50
3 2.91 17.25 0.78 2343.75
4 2.94 23.18 1.00 3125.00
5 2.97 28.85 1.30 3906.25
6 3.00 34.43 1.56 4687.50
7 3.02 40.23 1.82 5468.75
8 3.02 46.01 2.08 6250.00
9 3.04 51.60 2.33 7031.25
10 3.04 57.38 2.60 7812.50
15 2.86 86.24 3.90 11718.75
20 2.88 116.10 5.30 15625.00
30 2.93 173.37 7.80 23437.50
40 2.95 230.16 10.40 31250.00
18
Table III.4
–
Performance of the 2-step process with increasing PV area.
No. Of Parallel modules
Vop
(V) Iop (A)
Volume of CO per hour
(L/h)
Volume of H2 per hour
(L/h)
Area of PV (cm2)
1 2.58 5.74 1.60 1.69 781.25
2 2.64 11.30 3.21 3.38 1562.50
3 2.67 17.00 4.81 5.07 2343.75
4 2.68 22.50 6.46 6.81 3125.00
5 2.70 28.00 7.81 8.23 3906.25
6 2.73 33.38 9.31 9.81 4687.50
7 2.74 38.86 10.83 11.42 5468.75
8 2.75 44.12 12.30 12.97 6250.00
9 2.76 49.48 13.80 14.54 7031.25
10 2.76 55.00 15.33 16.16 7812.50
15 2.61 85.70 23.89 25.19 11718.75
20 2.64 113.60 31.67 33.39 15625.00
30 2.66 169.00 47.11 49.67 23437.50
40 2.70 224.20 62.50 65.90 31250.00
50 2.71 279.50 77.91 82.14 39062.50
Table III.5 -
Production of the EC’s for both processes
per m
2of active PV area.
3.2.
Fisher-Tropsch Synthesis
To complete the 2-step approach of Figure I.1, the produced syngas (CO+H2) needs to be converted to methane in the second step of the process based on FTS. A simulation for each catalyst is made to evaluate which is preferred for the CH4
Rate of production
(L/ h.m2PV) 1-step 2-step
CH4 3.3 -
CO - 16
19
production. The considered catalysts were Fe, Co and two Ni based (Ni/Al2O3) with a 18% and a 50% Ni concentration. To model these syntheses, two different kinetic models were considered. Firstly, a model for Fe and Co developed by Mousavi et al. (2015) and, secondly, a model for 18%Ni and 50% Ni developed by Rönsch et al. (2015). These syntheses occur at a temperature of 533 K (260 ºC), meaning they are low temperature FTS (LTFTS), since methane formation increases until it reaches a temperature around 600 K, when the reverse reaction, known as methane reforming, starts occurring, leading to a drop of the reaction rate [47]. Both kinetic models do not consider this factor, and thus, can only be used at temperatures below 600 K (see Annex I –Temperature Dependence for more information). In Equation (14) is presented the CO methanation reaction, that, as stated previously, is reversed when reached a certain temperature threshold.
2 4 2
CO 3H
+
CH
+
H O
(14)In order to form CH4 by FTS, a 3:1 H2:CO ratio is required, since other ratios will induce the formation of different hydrocarbons [36], [41], [43], [45], [54]. Although the 2-step EC produces, in volume, 16 L/h.m2
PV of CO and 19 L/h.m2PV of H2, to respect the ratio, only 6.3 of the 16 L/h.m2PV of CO will be used in the synthesis, creating the need to store the remaining liters of CO being produced.
The reaction rates of both models show the rate of hydrocarbon formation, which is the same as the rate of CO consumed. Hence, the reaction rates are presented as negative, depicting the quantity of CO being consumed. This rate depends on the
catalyst’s surface area available, and consequently, on the quantity of catalyst on the reactor, on how swiftly the CO molecules adhere to the catalysts surface, on the partial pressure of syngas and the ratio between CO and H2 and on the temperature.
The reaction rate of FTS is given in moles of CO consumed per kilogram of
catalyst. For Mousavi’s model, kFe and kCo are known for iron and cobalt catalysts, obtained by modeling Equation (11) with experimental results, while A is a constant used to normalize the model. As of 2015, from all the proposed models for Co and Fe FTS , Mousavi’s is regarded as the most reliable one [43]. As for Ni based FTS,
Rönsch’s model is the preferred one, with its rate coefficients, k1, 18%Ni and k1, 50%Ni, are calculated by Equation (15) and the adsorption constants, KC and KH, by Equation (16) [47] :
0 0
1, 1,
A
exp
nn n
k
k
RT
−
=
20
0
0
H
exp
jj j
K
K
RT
−
=
(16)Where k0
1,n and K0j are the preexponential factor of rate coefficient for the catalyst n and of the adsorption constant for the adsorbed atom j, respectively. A0 denotes the equilibrium potential and ΔH0
jdenotes the enthalpy of the adsorption reaction for the adsorbed atom j. The kinetic parameters for Equations (14) and (15) are given in Table III.6
Table III.6 - Kinetic parameters for Equations (15) and (16).
Preexponential factor of rate coefficient for 18 % Ni
k0
1,18%Ni
(mol/kgcat.s) 4.2x10 9
Preexponential factor of adsorption constant for 18 % Ni
k0
1,50% Ni
(mol/kgcat.s) 5.3x10 9
Preexponential factor of adsorption constant for
50 % Ni K
0C (bar-0.5) 0.428
Preexponential factor of rate coefficient for 50
% Ni K
0H bar-0.5) 0.165
Activation Energy A0 (J/mol) 103000
Enthalpy of the adsorption reaction for carbon ΔH0c (J/mol) -16000
Enthalpy of the adsorption reaction for
hydrogen ΔH
0H (J/mol) -42000
The rate equations of FTS depend on partial pressure instead of volume. Therefore, they were solved for a CO partial pressure ranging between 0 and 20 bar, with the H2 partial pressure three times the CO’s. In Table III.7 are shown the parameters of Mousavi et al. (2015)’s model and in Table III.8 the ones given to the
21
Table III.7
–
Parameters of Mousavi’s Model.
Table III.8
–
Parameters of Rönsch’s
Model.
0 5 10 15 20
-0.025 -0.020 -0.015 -0.010 -0.005 0.000
r
FT(mol CO/
Kg
cat
.s)
CO Partial Pressure (bar)
18% Ni 50% Ni Fe Co
Figure III.8 - Reaction rates of CO methanation for different catalysts in function of CO
partial pressure.
Analyzing the evolution of the FTS reaction rates with increasingly CO partial pressure, it is notable how only iron-based catalysts are sensible to the CO partial pressure whilst the rest with the catalysts the rate is almost constant. This behavior is expected, accordingly with literature [40], [43], and makes iron a very attractive catalyst, since it is also the least expensive of these catalysts [34], [36]. However, iron presents the lowest selectivity for methane, resulting in more unwanted hydrocarbons being produced alongside methane. For the remainder of this work, a CO partial pressure of 5 bar was considered, with the equivalent rates summarized
A
(mol/Kgcat.s)
kFe kCo
PH2
(bar)
10-3[43] 0.165 [43] 0.428 [43] 3PCO
Kc
(bar-1)
KH
(bar-1)
k1, 18%Ni
(mol/Kgcat.s)
k1, 50%Ni
(mol/Kgcat.s)
PH2
(bar)
22 in Table III.9. Since the CO flow rate is 6.3 L/h.m2
PV, it was calculated that, for each meter square of PV area used, 0.007 Kg of iron, 0.019 Kg of cobalt, 0.022 Kg of 15% nickel-based catalyst and 0.018 Kg of 50% nickel-based catalyst are necessary. This shows that not only is iron the cheapest catalysts, it is also the more efficient one.
Table III.9
–
FTS reaction rates for P
CO=5 bar.
Catalyst
rFT
(mol CO/Kgcat.s)
rFT
(g CO/Kgcat.s)
Iron -0.0114 -0.32
Cobalt -0.0039 -0.11
15% Nickel -0.0036 -0.10
50% Nickel -0.0046 -0.13
3.2.1.
Energy requirements for FTS
For efficient syngas-to-methane conversion, the syngas in the reactor for the FTS needs to be at a typical temperature around 533 K, , which constitutes the main energy consumption required in FTS. The energy required to heat up syngas to this temperature was calculated to better evaluate the overall energetic balance of the 2-step process. In Figure III.9 is shown a schematic of the heating process. For the calculations, it was considered a separation of the syngas into CO and H2 and the subsequent heating of each gas separately. To calculate the necessary power to heat syngas from the input temperature (ambient temperature, 298 K) to the output temperature (533 K) it was used the following formula [55]:
p
q
h
c
T
=
(17)Where h is heat flow rate in kW, q is the flow rate in m3/s, cp is the specific heat in
23 previously established 6.3 and 19 L/h.m2
PV, respectively. These flow rates values were converted to m3/s.m2PV for these calculations.
Figure III.9
–
Heating process of syngas. T1 is the input temperature and T2 the output
temperature. The input flow rates are those calculated from the EC production.
Table III.10
–
Parameters for calculating the syngas heating power.
q (m3/s) cp (kJ/kg.K) ρ (kg/m3) ΔT (K)
CO 1.8x10⁻⁶ 1.04 1.14 235
H2 5.3x10⁻⁶ 14.3 9x10⁻⁵ 235
Solving Equation (17), it is calculated a needed potency of 0.5 W/m2
PV for heating up the CO and a needed potency of 0.002 W/m2
PV for heating up the H2. These translate to a total energy requirement per m2 of PV area of 2 Wh per day, assuming 4 sun peak hours daily as a yearly average for Europe [56].
5.3x 10
-6m
3/s H
2T1
T2
Heat source
1.8x 10
-6m
3/s CO
T1
T2
24
3.3.
1-Step Methanation vs 2-Step Methanation
The previous results were compared in terms of energy, for an easier understanding of both processes, assuming CH4 has an energy equivalent of 13.9 Wh/g [10]. For the 2-step process, the FTS energy requirement (calculated in section 3.2.1) was subtracted from the CH4 energy equivalent in the following results. With these final values of production, it is also possible to calculate the overall solar-to-CH4 efficiency. The results of the two processes are shown in Table III.11.
Table III.11
–
Production of the 1- and 2-steps processes in volume and equivalent
energy of CH
4.
CH4 produced per hour (L/h.m2pv)
CH4 energy equivalent per
(Wh/h.m2pv)
EC efficiency
(%)
Solar-to-CH4 efficiency
(%)
1-step 3.3 30.14 43.3 9.18
2-step 6.3 55.53 66.7 13.63
It should be noted that, as mentioned in section 3.1.4, that syngas production with this PV-EC system is not working at the ideal operation point, which affects negatively its efficiency. These results assume the PV system is working at optimal conditions, always assuming a constant solar irradiance of 1000 W/m2, which does not happen in reality. For a more realistic approach, global irradiance data from Ineichen (2011) [57] spanning one year is considered. This data was obtained using the highest measurement of the day in clear sky conditions. It was considered 4 sun peak hours daily. In Figure III.10, CH4 adjusted production for a year is shown in terms of weight and equivalent energy. Analyzing this data, a higher performance in the summer is evident, which is explained by the higher solar irradiance during the summer period. It is once more observed the better performance of the 2-Step process. Lastly, the daily production average for both processes were calculated and the results are shown in Figure III.10.
25
Table III.12 - Average daily performance of the 1- and 2-steps processes in volume and
equivalent energy of CH
4, considering 4 sun peak hours per day.
30 60 90 120 150 180 210 240 270 300 330 360 0 5 10 15 20 25
30 60 90 120 150 180 210 240 270 300 330 360 0 50 100 150 200 250 M et hane pr oduced ( L/ m 2 PV )
Day of the year
1-Step 2-Step M et hane E nergy E qui val ent ( Wh/ m 2 PV )
Day of the year
1-Step 2-Step
a)
Figure III.10
–
Daily performances of both processes in a) volume of methane and b)
methane energy equivalent.
Volume of CH4 produced daily
(L/m2PV)
CH4 Energy equivalent daily
(Wh/m2PV)
1-Step 15.24 69.58
26
3.4.
Practical application
Taking into account the previous results, the performance of the two processes was analyzed with the goal of satisfying the heat requirements of a average European household. According to data from the 2018 report from BP on Statistical Review of World Energy [58], a European household consumes an average of 11630 kWh per year (31.86 kWh/day) of natural gas (CH4). Knowing this, for these processes to power one of these households they would need a PV area of 86.8 and 58.4 m2 for the 1-step and the 2-step, respectively, as indicated in Figure III.11. These values were calculated using the solar-to-CH4 efficiencies shown in Table III.11, considering an average of 4 sun peak hours daily at a solar peak irradiance of 1 kW/m2. This analysis shows that such PV systems could be installed on the available solar-exposed area on the roofs and/or facades of these households.
Consumes 31.86 Kwh/day of natural gas
Requires 86.8 m2 of PV with the 1-Step
Requires 58.4 m2 of PV with the 2-Step
27
IV.
Conclusion
In this work, two different approaches for CO2 methanation were studied. The first, a 1-step approach, is an electrochemical conversion of CO2 into CH4 using water as a proton donor, powered by clean energy harvested from the sun. The second, 2-step approach, is the co-electrolysis of CO2 and water into syngas that is then used as feedstock for a Fischer-Tropsch synthesis, producing methane. To evaluate both approaches, they were simulated using kinetics-based models.
From the simulation of the electrochemical reactions, it was concluded that the 2-step electrochemical process is a quicker and more efficient process than the 1-step, with the former producing 20.01 g/h.m2
PV of CO and 1.71 g/h.m2PV of H2 with a total energy efficiency of 66.6 %, while the latter produced 2.17 g/h.m2
PV with a total electrochemical energy efficiency of 43.3 %. It should be noted that the 2-step process is more efficient even though its less optimized PV-EC system.
Four FTS catalysts were simulated, with iron rising above the others performance-wise. Although this catalyst has the smallest selectivity for CH4 formation (~70%), due to its low price and a high reaction rate, it was the preferred one [40].
Analyzing the overall efficiency, from the harvesting of solar energy by the photovoltaic system to the volume of CH4 produced, the solar-to-CH4 efficiencies are 9.18 % for the 1-step process and 13.63 % for the 2-step process. The main limitation for these efficiencies is the efficiency of the PV system, that is 21.2 %. Thus, with the rising of more efficient PV technologies, this overall efficiency will grow too.
28
4.1.
Future Perspectives
It should be noted that the model here presented is very limited, only based on the basic kinetic processes of electrolysis. It was designed to comprehend the potentialities of the processes study and give an idea of the path to follow in future studies. In follow up works, this model should be put to test with experimental work, to more closely confirm their efficacy and should be completed to include the whole system (auxiliary systems, e.g. pumps, valves, heating and cooling units etc.) behavior. The model should also be made more complete by adding thermodynamic considerations to it.
Experimental work based on the findings of this model has to be done, to confirm the findings for large areas of PV and stress studies should be done to verify how performance is affected with increasing operation times.
29
Bibliography
[1] J. A. Herron, J. Kim, A. A. Upadhye, G. W. Huber, and C. T. Maravelias, “A general framework for
the assessment of solar fuel technologies,” Energy Environ. Sci., vol. 8, no. 1, pp. 126–157, 2015.
[2] G. Ibram, “Solar fuels vis-à-vis electricity generation from sunlight: The current state-of-the-art
(a review),” Renew. Sustain. Energy Rev., vol. 44, pp. 904–932, 2015.
[3] C. Graves, S. D. Ebbesen, and M. Mogensen, “Co-electrolysis of CO2 and H2O in solid oxide cells:
Performance and durability,” Solid State Ionics, vol. 192, no. 1, pp. 398–403, 2011.
[4] M. Schreier, L. Curvat, F. Giordano, L. Steier, A. Abate, S. M. Zakeeruddin, J. Luo, M. T. Mayer
and M. Grätzel “Efficient photosynthesis of carbon monoxide from CO2 using perovskite
photovoltaics,” Nat. Commun., vol. 6, p. 7326, 2015.
[5] M. Samavati, M. Santarelli, A. Martin, and V. Nemanova, “Production of Synthetic Fischer-Tropsch
Diesel from Renewables: Thermoeconomic and Environmental Analysis,” Energy and Fuels, vol.
32, no. 2, pp. 1744–1753, 2018.
[6] A. J. Martín, G. O. Larrazábal, and J. Pérez-Ramírez, “Towards sustainable fuels and chemicals
through the electrochemical reduction of CO 2 : lessons from water electrolysis,” Green Chem., vol.
17, no. 12, pp. 5114–5130, 2015.
[7] A. Tatin, C. Comminges, B. Kokoh, C. Costentin, M. Robert, and J.-M. Savéant, “Efficient
electrolyzer for CO 2 splitting in neutral water using earth-abundant materials,” Proc. Natl. Acad.
Sci., vol. 113, no. 20, pp. 5526–5529, 2016.
[8] S. Fukuzumi, “Production of Liquid Solar Fuels and Their Use in Fuel Cells,” Joule, vol. 1, no. 4,
pp. 689–738, 2017.
[9] B. Endrődi, G. Bencsik, F. Darvas, R. Jones, K. Rajeshwar, and C. Janáky, “Continuous-flow
electroreduction of carbon dioxide,” Prog. Energy Combust. Sci., vol. 62, pp. 133–154, 2017.
[10] J. Newman and K. Thomas-Alyea, Electrochemical Systems, 3rd ed. John Wiley & Sons, 2004.
[11] W.-H. Cheng, M. H. Richter, M. M. May, J. Ohlmann, D. Lackner, F. Dimroth, T. Hannappel, H. A.
Atwater and H. Lewerenz, “Monolithic Photoelectrochemical Device for Direct Water Splitting with
19% Efficiency,” ACS Energy Lett., vol. 3, no. 8, pp. 1795–1800, Aug. 2018.
[12] T. Hatsukade, K. P. Kuhl, E. R. Cave, D. N. Abram, and T. F. Jaramillo, “Insights into the
electrocatalytic reduction of CO 2 on metallic silver surfaces,” Phys. Chem. Chem. Phys., vol. 16,
no. 27, pp. 13814–13819, 2014.
[13] J. L. White, J. T. Herb, J. J. Kaczur, P. W. Majsztrik, and A. B. Bocarsly, “Photons to formate:
Efficient electrochemical solar energy conversion via reduction of carbon dioxide,” J. CO2 Util., vol.
7, pp. 1–5, 2014.
[14] C.R. Graves, "Recycling CO2 into Sustainable Hydrocarbon Fuels: Electrolysis of CO2 and H2O."
30
[15] H. L. Tuller, “Solar to fuels conversion technologies: A perspective,” Mater. Renew. Sustain.
Energy, vol. 6, no. 1, 2017.
[16] J. Qiao, Y. Liu, F. Hong, and J. Zhang, “A review of catalysts for the electroreduction of carbon
dioxide to produce low-carbon fuels,” Chem. Soc. Rev., vol. 43, no. 2, pp. 631–675, 2014.
[17] M. Gattrell, N. Gupta, and A. Co, “A review of the aqueous electrochemical reduction of CO2to
hydrocarbons at copper,” J. Electroanal. Chem., vol. 594, no. 1, pp. 1–19, 2006.
[18] M. Schreier, L. Curvat, F. Giordano, L. Steier, A. Abate, S. M. Zakeeruddin, J. Luo, M. T. Mayer
and M. Grätzel “Efficient photosynthesis of carbon monoxide from CO2 using perovskite
photovoltaics,” Nat. Commun., vol. 6, p. 7326, 2015.
[19] K. Manthiram, B. J. Beberwyck, and A. P. Alivisatos, “Enhanced electrochemical methanation of
carbon dioxide with a dispersible nanoscale copper catalyst,” J. Am. Chem. Soc., vol. 136, no. 38,
pp. 13319–13325, 2014.
[20] K. Welter, V. Smirnov, J. P. Becker, P. Borowski, S. Hoch, A. Maljusch, W. Jaegermann and F.
Finger “The Influence of Operation Temperature and Variations of the Illumination on the
Performance of Integrated Photoelectrochemical Water-Splitting Devices,” ChemElectroChem, vol.
4, no. 8, pp. 2099–2108, 2017.
[21] A. Buttler and H. Spliethoff, “Current status of water electrolysis for energy storage, grid balancing
and sector coupling via power-to-gas and power-to-liquids: A review,” Renew. Sustain. Energy
Rev., vol. 82, no. February 2017, pp. 2440–2454, 2018.
[22] M. Shen, N. Bennett, Y. Ding, and K. Scott, “A concise model for evaluating water electrolysis,”
Int. J. Hydrogen Energy, vol. 36, no. 22, pp. 14335–14341, 2011.
[23] J. Qiao, Y. Liu, and J. Zhan, Electrochemical Reduction of Carbon Dioxide. Fundamentals and
Technologies, 1st Editio. CRC Press, 2016.
[24] P. Yadav and S. Basu, “An Integrated Device for Converting Water, Carbon Dioxide and Light into
Electricity and Organics,” J. Electrochem. Soc., vol. 164, no. 11, pp. E3406–E3417, 2017.
[25] M. R. Singh, E. L. Clark, and A. T. Bell, “Effects of electrolyte, catalyst, and membrane composition
and operating conditions on the performance of solar-driven electrochemical reduction of carbon
dioxide,” Phys. Chem. Chem. Phys., vol. 17, no. 29, pp. 18924–18936, 2015.
[26] T. Pardal, S. Messias, M. Sousa, A. S. R. Machado, C. M. Rangel, D. Nunes, J. V. Pinto, R. Martins
and M. N. Ponte “Syngas production by electrochemical CO2reduction in an ionic liquid based
-electrolyte,” J. CO2 Util., vol. 18, pp. 62–72, 2017.
[27] Y. Redissi and C. Bouallou, “Valorization of carbon dioxide by co-electrolysis of CO2/H2O at high
temperature for syngas production,” Energy Procedia, vol. 37, pp. 6667–6678, 2013.
[28] T. Pardal, T. R. C. Fernandes, A. S. R. Machado, and C. M. Rangel, “Conversion of Carbon Dioxide
into Fuel by Electrochemical Reduction In Aqueous Solvents,” Fuel Cells Adv. Batter., vol. 2, no.
31
[29] M. R. Singh, E. L. Clark, and A. T. Bell, “Thermodynamic and achievable efficiencies for solar
-driven electrochemical reduction of carbon dioxide to transportation fuels,” Proc. Natl. Acad. Sci.,
vol. 112, no. 45, pp. E6111–E6118, 2015.
[30] H. S. Jeon, J. Koh, S. Park and M. S. Jee “A monolithic and standalone solar-fuel device having
comparable efficiency to photosynthesis in nature,” J. Mater. Chem. A, vol. 3, no. 11, pp. 5835– 5842, 2015.
[31] M. Ma, K. Liu, J. Shen, R. Kas, and W. A. Smith, “In-situ Fabrication and Reactivation of Highly
Selective and Stable Ag Catalysts for Electrochemical CO2 Conversion,” ACS Energy Lett., p. acsenergylett.8b00472, 2018.
[32] M. Bevilacqua, J. Filippi and M. Folliero, “Enhancement of the Efficiency and Selectivity for Carbon
Dioxide Electroreduction to Fuels on Tailored Copper Catalyst Architectures,” Energy Technol., vol.
4, no. 8, pp. 1020–1028, 2016.
[33] K. P. Kuhl, E. R. Cave, D. N. Abram, and T. F. Jaramillo, “New insights into the electrochemical
reduction of carbon dioxide on metallic copper surfaces,” Energy Environ. Sci., vol. 5, no. 5, p.
7050, 2012.
[34] Q. Lu and F. Jiao, “Electrochemical CO2reduction: Electrocatalyst, reaction mechanism, and
process engineering,” Nano Energy, vol. 29, pp. 439–456, 2016.
[35] H. Ooka, M. C. Figueiredo, and M. T. M. Koper, “Competition between Hydrogen Evolution and
Carbon Dioxide Reduction on Copper Electrodes in Mildly Acidic Media,” Langmuir, vol. 33, no. 37,
pp. 9307–9313, 2017.
[36] A. Y. Khodakov, W. Chu, and P. Fongarland, “Advances in the Development of Novel Cobalt Fischer
− Tropsch Catalysts for Synthesis of Long-Chain Hydrocarbons and Clean Fuels Advances in the
Development of Novel Cobalt Fischer − Tropsch Catalysts” Am. Chem. Soc., vol. 107, no. 5, pp.
1692–1744, 2007.
[37] Y. Sekine, J. Filippi, M. Folliero, A. Lavacchi, H. A. Miller, A. Marchionni and F. Vizza, “An
experimental study on Fischer-Tropsch catalysis: Implications for impact phenomena and nebular
chemistry,” Meteorit. Planet. Sci., vol. 41, no. 5, pp. 715–729, May 2006.
[38] Y. Yao, D. Hildebrandt, D. Glasser, and X. Liu, “Fischer-tropsch synthesis using H2/CO/CO2 syngas
mixtures over a cobalt catalyst,” Ind. Eng. Chem. Res., vol. 49, no. 21, pp. 11061–11066, 2010.
[39] L. P. Zhou, X. Hao, J. H. Gao, B. S. Wu, J. Xu, Y. Y. Xu and Y. W. Li, “Studies and discriminations
of the kinetic models for the iron-based Fischer-Tropsch catalytic reaction in a recycle slurry
reactor,” Energy and Fuels, vol. 25, no. 1, pp. 52–59, 2011.
[40] F. G. Botes, J. W. Niemantsverdriet, and J. Van De Loosdrecht, “A comparison of cobalt and iron
based slurry phase Fischer-Tropsch synthesis,” Catal. Today, vol. 215, pp. 112–120, 2013.
[41] F. G. Botes, B. Van Dyk, and C. Mcgregor, “The Development of a Macro Kinetic Model for a
Commercial Co / Pt / Al 2 O 3 Fischer - Tropsch Catalyst,” vol. 2, no. 5, pp. 10439–10447, 2009.
[42] P. van Helden, J.-A. van den Berg, M. A. Petersen, W. Janse van Rensburg, I. M. Ciobîcă, and J.
van de Loosdrecht, “Computational investigation of the kinetics and mechanism of the initial steps

![Figure I.3 - FTS reaction steps. Adapted from [34].](https://thumb-eu.123doks.com/thumbv2/123dok_br/16699279.743942/27.892.305.563.110.349/figure-i-fts-reaction-steps-adapted.webp)
![Figure III.2 – On the left, picture of the Sunpower TM B50 solar cell and, on the right, its IV responses for different irradiations and temperature [48]](https://thumb-eu.123doks.com/thumbv2/123dok_br/16699279.743942/33.892.133.763.583.851/figure-picture-sunpower-solar-responses-different-irradiations-temperature.webp)