Carlos Pestana Barros & Nicolas Peypoch
A Comparative Analysis of Productivity Change in Italian and Portuguese Airports
WP 006/2007/DE _________________________________________________________
António Afonso & João Tovar Jalles
Measuring the Success of Fiscal
Consolidations
WP 22/2011/DE/UECE _________________________________________________________ Department of EconomicsW
ORKINGP
APERS ISSN Nº 0874-4548School of Economics and Management
Measuring the Success of Fiscal Consolidations
*António Afonso $# and João Tovar Jalles+#
Abstract: We measure the success of fiscal consolidation, with alternative definitions,
based on ad-hoc quantitative approaches and on a policy-action approach. The cyclically adjusted primary balance, and the duration of the consolidation contribute for its success, and the opposite applies for revenue based consolidations.
JEL: C23, E62, H50, H62
Keywords: fiscal episodes, panel data, logit
1. Introduction
The economic and financial crisis of 2008-09, the fiscal stimuli that followed and the subsequent need for fiscal consolidation brought about again the question of whether such retrenchment should be conducted via reducing public expenditures or an increase in revenues, and also whether the duration of such fiscal adjustment matters.
In the literature’s attention has been given to the conditions for successful fiscal consolidations, which can bring about a significant reduction in the debt ratio. For instance, the composition of the adjustment (Giudice et al., 2004, Afonso et al., 2006), its size and persistence, the gravity of the fiscal imbalance, the international environment and preceding devaluations (Heylen and Everaert, 2000). Still, how to determine a successful fiscal adjustment remains a non-consensual matter.
For instance, Alesina and Perotti (1995), Giavazzi and Pagano (1996), McDermott and Wescott (1996), Alesina and Ardagna (1998) and Perotti (1998) hint at a higher likelihood of success when the adjustment is more spending based, which is contested by Heylen and Everaert (2000), while Barrios et al. (2010) report that countries facing higher initial levels of government debt have a better probability of pursuing successful fiscal consolidations.
Therefore, we assess in an OCED panel, with a logit specification, the determinants of successful fiscal consolidations, with alternative labelling of fiscal episodes. Our
*The opinions expressed are those of the authors and do not necessarily reflect those of the ECB or the Eurosystem. $ ISEG/UTL - Technical University of Lisbon, Department of Economics; UECE – Research Unit on Complexity and
Economics. UECE is supported by FCT (Fundação para a Ciência e a Tecnologia, Portugal), email: aafonso@iseg.utl.pt.
# European Central Bank, Directorate General Economics, Kaiserstraße 29, D-60311 Frankfurt am Main, Germany.
email: antonio.afonso@ecb.europa.eu.
+ University of Aberdeen, Business School, Edward Wright Building, Dunbar Street, AB24 3QY, Aberdeen, UK.
email: j.jalles@abdn.ac.uk
# European Central Bank, Directorate General Economics, Kaiserstraße 29, D-60311 Frankfurt am Main, Germany.
contribution lies, most notably, on the cross-checking of several alternative methods so as to confer robustness to the overall analysis. Hence, on the one hand, we make use of existing approaches to determine fiscal episodes, based on the cyclically adjusted primary balance. On the other hand, we rely also on the policy action-based approach proposed by the IMF (Devries et al., 2011) to identify fiscal episodes. Our results show that changes in the cyclically adjusted primary balance, and the duration of the fiscal consolidation episode contribute for the success of the consolidation, and the opposite applies if the latter is more based on the revenue side.
2. Fiscal episodes
2.1. Approaches to determine fiscal episodes
The most commonly used approaches to determine fiscal episodes (either fiscal adjustments or expansions) are based on the changes in the cyclically adjusted primary budget balance, which allows the correction of the effects resulting from economic activity such as inflation or real interest rate changes. Therefore, we use the change in the cyclically adjusted primary budget balance as a percentage of GDP, a widely used measure, along the lines of Giavazzi and Pagano (1996), Alesina and Ardagna (1998), and Afonso (2010), and we determine the periods where fiscal episodes occur, which we label in our study respectively FE1, FE2, and FE3.
The FE1 measure follows Alesina and Ardagna (1998) who consider the change in the primary cyclically adjusted budget balance that is at least 2 percentage points of GDP in one year or at least 1.5 percentage points on average in the last two years.
On the other hand, the FE2 measure is the definition used by Giavazzi and Pagano (1996) who proposed using the cumulative changes in the primary cyclically adjusted budget balance that are at least 5, 4, 3 percentage points of GDP in respectively 4, 3 or 2 years, or 3 percentage points in one year.
The FE3 measure, used by Afonso (2010), defines the occurrence of a fiscal episode when either the change in the primary cyclically adjusted balance is at least one and a half times the standard deviation (in the panel) in one year, or when such change is at least one standard deviation on average in the last two years.
Finally, we also use the fiscal consolidations episodes identified by the IMF1. These episodes are identified by looking at IMF and OECD historical reports and by checking what countries intended to do at the time of publication. The IMF’s policy-action based
approach uses descriptive historical facts to describe what happened to the deficit in a particular period.
Our analysis covers the period 1970-2010 for 14 European Union countries plus other four OECD economies: Austria, Belgium, Denmark, Finland, France, Germany, Greece, Ireland, Italy, the Netherlands, Portugal, Spain, Sweden, U.K., and Australia, Canada, Japan and the U.S. Overall, we have a annual panel whose dimension reaches a maximum of 738 observations.2
2.2. The fiscal episodes
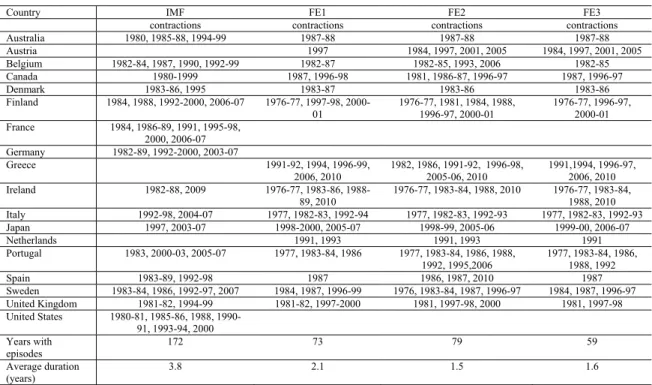
In Table 1 we report the fiscal episodes computed according to the above mentioned four strategies. Under the headings FE1, FE2, and FE3 we report the fiscal episodes, computed using the three alternative approaches proposed respectively by Giavazzi and Pagano (1996), Alesina and Ardagna (1998), and Afonso (2010), as discussed in the previous section. In addition, we also report in the table the fiscal contraction episodes as taken from Devries et al. (2011).
[Table 1]
From Table 1 we observe that the number of fiscal contractions ranges from 59, in the approach proposed by Afonso (2010), to 79, using the approach from Giavazzi and Pagano (1996) approach. The IMF reports a much higher number of years where fiscal contractions take place (in around 42% of the years there are fiscal contractions), even though the covered time sample is smaller (1980-2007).
The average duration of the reported fiscal episodes is around 1.6 years for the approaches of Alesina and Ardagna (1998), and Afonso (2010), around 2 years following the approach proposed by Giavazzi and Pagano (1996), and around 3.8 years for the fiscal contractions identified by the so-called policy action-based approach.
The three methods that determine fiscal episodes on the basis of the change in the cyclically adjusted primary balance essentially coincide in identifying, for instance, the fiscal contractions of Denmark in 1983-84 and of Ireland in 1988-89. A broadly similar pattern also emerges from the IMF approach.
2 The data are from the AMECO European Commission database: Net lending (+) or net borrowing (-)
excluding interest of general government adjusted for the cyclical component. Adjustment based on potential GDP (% of GDP at market prices), codes 1.0.319.0.UBLGBP; Total expenditure: general government (% of GDP at market prices), codes 1.0.319.0.UUTGF, 1.0.319.0.UUTGE; Total revenue: general government, (% of GDP at market prices), codes 1.0.319.0.URTGF, 1.0.319.0.URTGE;General government consolidated gross debt (based on ESA 1995) and former definition (linked series) (% of GDP at market prices) codes 1.0.319.0.UDGGF, 1.0.319.0.UDGGL
2.3. Characteristics of the fiscal episodes
Regarding the characteristics of the fiscal episodes, the fiscal conditions prevailing just before the beginning of a consolidation episode seem to have had an impact on the size of subsequent efforts.3 The larger the cyclically adjusted primary deficit, the larger was the size of ensuing fiscal consolidation. This may reflect that large deficits made it more necessary to consolidate and, at the same time, raised public awareness of the extent of the fiscal imbalance problem, making it easier to act.
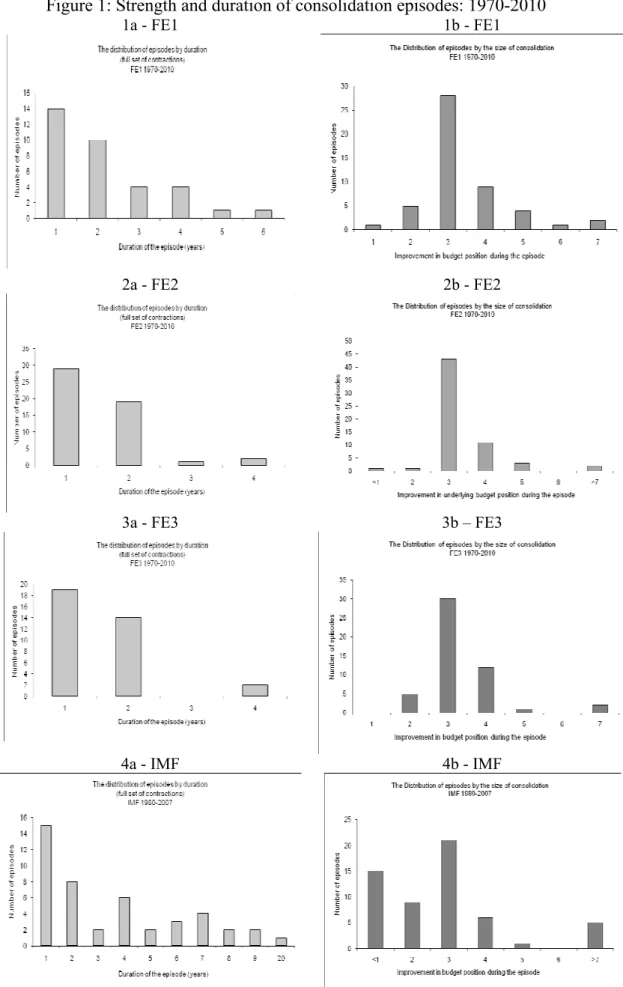
Moreover, most of the consolidation episodes were of short duration (with some exceptions for the IMF-based measure, see Table 1) and involved relatively modest gains (Figure 1). However, there were a number of large efforts, amounting to improvements of more than 7% of GDP for the four measures of fiscal episodes, as well as a few episodes lasting for four years (or more in the case of the IMF-based measure).
[Figure 1]
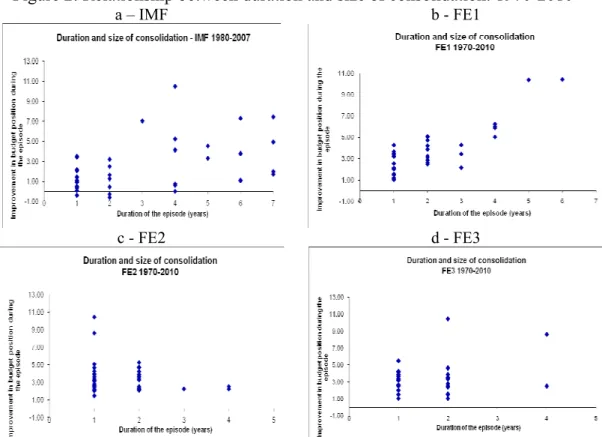
Furthermore, and in general, it is also possible to observe that sizeable consolidation episodes also lasted for longer periods, and vice-versa (Figure 2).
[Figure 2]
3. Success of fiscal adjustments
It is usually understood that higher real GDP growth is of crucial importance for the success of consolidation efforts, notably given also the denominator effect in this context. Figure 3.a-d shows the relevance of real GDP growth, relating the change in the debt ratio between tsand tf+2 to the change in the output gap between ts−1and
1 + f
t (with ts indicating the first year of the fiscal consolidation period andtf the final year). The latter change indicates the cumulated difference between actual real GDP growth and potential real growth in the years tsto tf+1. Simply eyeballing the charts,
one can observe that fiscal consolidations tend to bring about reductions in debt ratios only if economic growth is strong and the output gap increases. If the output gap falls, fiscal consolidations have an associated lower drop in the debt ratio.
[Figure 3]
For our econometric analysis in this context, we assume that a fiscal adjustment is successful (SU) if the improvement in the cyclically adjusted primary budget balances
(b) for two consecutive years is at least η-times the standard deviation of the cyclically adjusted primary budget balance in the full panel:
1 0 1, if 0, otherwise t i i t b SU = + ησ ∆ > =
∑
. (1)In our analysis we use a threshold value of η = 1 in (2).
In order to assess the relevance of the composition of the fiscal adjustment we use the dummy variable EXP as an explanatory variable in the subsequent Logit analysis. Therefore, EXP, as a percentage of GDP, is defined as follows:
1, if ( exp / ) 0, otherwise t t t b EXP = ∆ ∆ >λ , (2)
where exp is the value for total expenditure in year t, and λ is a threshold value (assuming the values 1/2, 2/3, 3/4). A similar dummy variable construction, as explained in (2), is done regarding total revenue.
Table 2 reports the number of fiscal consolidation episodes, or events, together with the respective success rate for each of the approaches used to determine the fiscal episode. According to Table 2, the success rate, measured as the number of successful fiscal consolidations over the total number of fiscal consolidation episodes, ranges from 37% in the IMF so called-policy action-based method to around 64-65% in the FE2 and FE3 approaches.
[Table 2]
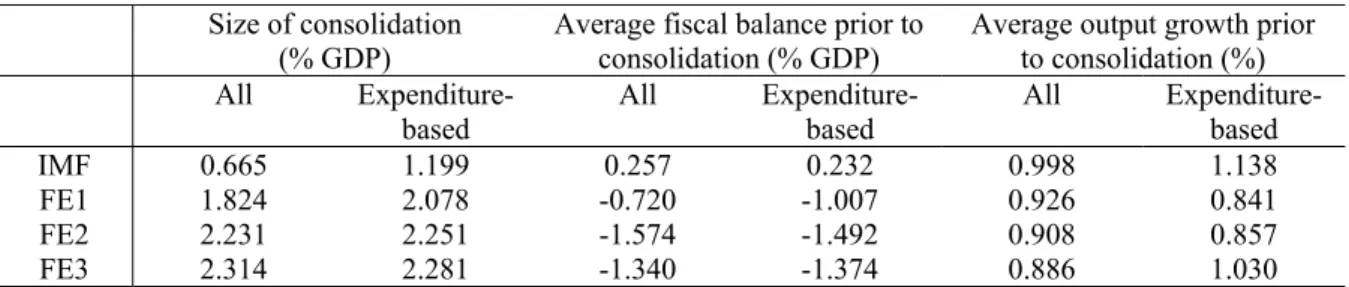
In addition, and from Table 3, we can also observe that the size of the fiscal consolidations does not differ much in terms of the share of the consolidation that is done via the expenditure side of the budget. This is notably true in the cases of the FE2 and FE3 approaches, but a slightly relative stronger adjustment is found in this context for the two other approaches.
[Table 3]
Having determined the nature of the fiscal consolidation episodes as either successful or unsuccessful, we can also assess their potential determinants. Therefore, a Logit model was estimated, as follows
[
]
i i Z Z i i e e Z S E P + = = = 1 | 1 , (3)where E[S=1|Zi] is the conditional expectation of the success of a fiscal consolidation,
= ; , 0 , , 1 successful not is ion consolidat the if successful is ion consolidat the if S , (4)
One can interpret (3) as the conditional probability that a successful consolidation occurs given Zi, and in general terms we have:
1 2 1 1 2( )
i i i i i i
Z =α +α D + β b +δ EXP +δ b EXP , (5)
where b is the change in the cyclically adjusted primary balance, the dummy variable
EXP was defined in (2), and D is the duration of the fiscal adjustment. The results of
such estimations are reported in Tables 4 to 7 for each of the four alternative methods that we use to determine the fiscal episodes. We also report several thresholds for the share of the fiscal adjustment that occurred via spending or revenue.
According to our results, in all four cases, the change in the cyclically adjusted primary balance contributes positively for the success of a fiscal consolidation. The share of the consolidation that takes place via the spending side of the budget has almost always a positive estimated coefficient but it is never statistically significant (columns 1 to 3 in Table 4).4 On the other hand, the estimated coefficients of the share of the
adjustment that is carried out via the revenue side is almost always negative, and, in the case of the FE3 approach for fiscal episodes, is statistically significant (see columns 4 to 6 in Table 4). Therefore, in these cases, if a fiscal consolidation is more based on the revenue side that reduces the corresponding probability of success.
[Table 4]
In addition, a larger duration always contributes positively to the probability of success of the fiscal adjustment in the approaches FE1, FE2, FE3, but it is not statistically significant in the case of the IMF approach. Finally, we also tested the possibility of an interaction effect between the change in the cyclically adjusted primary balance and the expenditure thresholds but no statistically significant effect was uncovered (columns 10 to 12 in Table 4).
4. Conclusion
We revisited the so-called expansionary fiscal adjustments using alternative measures of fiscal episodes. In a panel of OECD countries between 1970 and 2010 we assessed to what extent the composition and duration of fiscal adjustments play a role in their success via the estimation of logit models.
We uncover the result that such fiscal episodes tend to bring about reductions in debt ratios only if economic growth is strong and the output gap increases. Furthermore, the size of the fiscal consolidations does not differ much in terms of the share of the consolidation that is done via the expenditure side of the budget. Finally, evidence suggests that the change in the cyclically adjusted primary balance contributes positively for the success of a fiscal consolidation and the opposite applies if the latter is more based on the revenue side. Also duration matters and it contributes positively to the probability of success of a fiscal consolidation episode.
References
1. Afonso, A. (2010). “Expansionary fiscal consolidations in Europe: new evidence”,
Applied Economics Letters, 17 (2), 105-109.
2. Afonso, A., Nickel, C., Rother, P. (2006). “Fiscal consolidations in the Central and Eastern European countries,” Review of World Economics, 142 (2), 402-421.
3. Alesina, A., Ardagna, S. (1998). “Tales of Fiscal Contractions,” Economic Policy, 27, 487-545.
4. Barrios, S., Langedijk, S., Pench, L. (2010). “EU fiscal consolidation after the financial crisis: Lessons from past experience”, European Commission, Economic Papers 418.
5. Devries, P., Guajardo, J., Leigh, D., Pescatori, A. (2011), “An action-based analysis of fiscal consolidation in OECD countries”, IMF WP No. 11/128.
6. Giavazzi, F., Pagano, M. (1996). “Non-keynesian Effects of Fiscal Policy Changes: International Evidence and the Swedish Experience,” Swedish Economic Policy
Review, 3 (1), 67-103.
7. Giudice, G., Turrini, A., in’t Veld, J. (2004). “Non-keynesian fiscal consolidation in the EU? Ex post evidence an ex ante analysis”, CEPR Discussion Paper 4388.
8. Heylen, F., Everaert, G. (2000). “Success and Failure of Fiscal Consolidation in the OECD: A Multivariate Analysis,” Public Choice, 105 (1/2), 103-124.
9. McDermott, C., Wescott, R. (1996). “An Empirical Analysis of Fiscal Adjustments,” International Monetary Fund Staff Papers, 43 (4), 725-753.
10. Perotti, R. (1998). “The Political Economy of Fiscal Consolidations,” Scandinavian
Table 1: Fiscal Episodes (FE), based on the change in the primary cyclically adjusted budget balance and on the so-called policy action-based approach
Country IMF FE1 FE2 FE3
contractions contractions contractions contractions
Australia 1980, 1985-88, 1994-99 1987-88 1987-88 1987-88 Austria 1997 1984, 1997, 2001, 2005 1984, 1997, 2001, 2005 Belgium 1982-84, 1987, 1990, 1992-99 1982-87 1982-85, 1993, 2006 1982-85 Canada 1980-1999 1987, 1996-98 1981, 1986-87, 1996-97 1987, 1996-97 Denmark 1983-86, 1995 1983-87 1983-86 1983-86 Finland 1984, 1988, 1992-2000, 2006-07 1976-77, 1997-98, 2000-01 1976-77, 1981, 1984, 1988, 1996-97, 2000-01 1976-77, 1996-97, 2000-01 France 1984, 1986-89, 1991, 1995-98, 2000, 2006-07 Germany 1982-89, 1992-2000, 2003-07 Greece 1991-92, 1994, 1996-99, 2006, 2010 1982, 1986, 1991-92, 1996-98, 2005-06, 2010 1991,1994, 1996-97, 2006, 2010 Ireland 1982-88, 2009 1976-77, 1983-86, 1988-89, 2010 1976-77, 1983-84, 1988, 2010 1976-77, 1983-84, 1988, 2010 Italy 1992-98, 2004-07 1977, 1982-83, 1992-94 1977, 1982-83, 1992-93 1977, 1982-83, 1992-93 Japan 1997, 2003-07 1998-2000, 2005-07 1998-99, 2005-06 1999-00, 2006-07 Netherlands 1991, 1993 1991, 1993 1991 Portugal 1983, 2000-03, 2005-07 1977, 1983-84, 1986 1977, 1983-84, 1986, 1988, 1992, 1995,2006 1977, 1983-84, 1986, 1988, 1992 Spain 1983-89, 1992-98 1987 1986, 1987, 2010 1987 Sweden 1983-84, 1986, 1992-97, 2007 1984, 1987, 1996-99 1976, 1983-84, 1987, 1996-97 1984, 1987, 1996-97 United Kingdom 1981-82, 1994-99 1981-82, 1997-2000 1981, 1997-98, 2000 1981, 1997-98 United States 1980-81, 1985-86, 1988, 1990-91, 1993-94, 2000 Years with episodes 172 73 79 59 Average duration (years) 3.8 2.1 1.5 1.6
Notes: all measures computed by the authors, except the IMF one.
FE1 – measure based on Giavazzi and Pagano (1996): the cumulative change in the primary cyclically adjusted budget balance is at least 5, 4, 3 percentage points of GDP in respectively 4, 3 or 2 years, or 3 percentage points in one year.
FE2 – measure based on Alesina and Ardagna (1998): the change in the primary cyclically adjusted budget balance is at least 2 percentage points of GDP in one year or at least 1.5 percentage points on average in the last two years.
FE3 – measure based on Afonso (2010): a fiscal episode occurs when either the change in the primary cyclically adjusted balance is at least one and a half times the standard deviation (from the full panel sample) in one year, or when the change in the primary cyclically adjusted balance is at least one standard deviation on average in the last two years.
IMF – measure computed by Devries et al,.(2010), so-called policy action-based approach to account for consolidation episodes.
Table 2: Events and successes, 1970-2010 Total
Events Successes Success Rate (%) IMF 171 63 36.8 FE1 73 39 53.4 FE2 79 51 64.6 FE3 59 38 64.4
Table 3: Size of Consolidations, total budget balance, 1970-2010 Size of consolidation
(% GDP) Average fiscal balance prior to consolidation (% GDP) Average output growth prior to consolidation (%) All
Expenditure-based All Expenditure-based All Expenditure-based IMF 0.665 1.199 0.257 0.232 0.998 1.138 FE1 1.824 2.078 -0.720 -1.007 0.926 0.841 FE2 2.231 2.251 -1.574 -1.492 0.908 0.857 FE3 2.314 2.281 -1.340 -1.374 0.886 1.030
Table 4: Consolidation successes: logistic regressions (using different thresholds), 1970-2010 (FE3 case)
Specification Expenditure Revenue Expenditure Interaction
1 2 3 4 5 6 7 8 9 10 11 12 constant -2.053** -1.917** -1.669** -0.572 -0.545 -0.669 -6.026*** -6.220*** -5.684*** -1.338** -1.294** -1.251* (0.896) (0.890) (0.835) (0.734) (0.758) (0.725) (1.937) (2.032) (1.854) (0.669) (0.655) (0.654) dcapb 1.001*** 0.944*** 0.941*** 0.766*** 0.828*** 0.786*** 1.553*** 1.537*** 1.499*** 0.837*** 0.834*** 0.876*** (0.311) (0.293) (0.298) (0.281) (0.272) (0.285) (0.457) (0.451) (0.443) (0.278) (0.294) (0.278) exp23 1.013 1.114 (0.691) (0.800) exp12 0.785 1.068 (0.677) (0.802) exp34 0.556 0.763 (0.675) (0.797) rev23 -1.315* (0.671) rev12 -1.108* (0.661) rev34 -1.352* (0.693) duration 1.770*** 1.836*** 1.752*** (0.682) (0.696) (0.662) inter23 0.142 (0.280) inter12 0.077 (0.267) inter34 -0.042 (0.281) McFadden R2 0.229 0.217 0.208 0.250 0.237 0.250 0.372 0.370 0.358 0.203 0.200 0.199 N 59 59 59 59 59 59 59 59 59 59 59 59
Note: the standard errors are in parenthesis. *, **, *** denote significance at 10, 5 and 1% levels. Interaction terms between dcapb and EXP.
Figure 1: Strength and duration of consolidation episodes: 1970-2010
1a - FE1 1b - FE1
2a - FE2 2b - FE2
3a - FE3 3b – FE3
4a - IMF 4b - IMF
Note: budget position measured by the cyclically adjusted primary balance (% of GDP). Source: authors’ computations.
Figure 2: Relationship between duration and size of consolidation: 1970-2010
a – IMF b - FE1
c - FE2 d - FE3
Note: cyclically adjusted primary balance (% of GDP). Source: authors’ computations.
Figure 3: Output gap (before the episode), debt evolution (after the episode): 1970-2010 a - IMF aus3 bel1 bel2 bel3 bel4 den1 den2 fin2 fin3 fin4 fra2 fra3 fra4 fra5 fra6 ger2 ger3 ir1 it1 it2 jp1 jp2 pt1pt2 pt3 sp1 sp2 swe1 swe2 swe3 swe4 uk1 uk2 us1 us2 us3 us4 us5 -2 0 0 20 40 C h an ge in Go v. D e bt -.02 -.01 0 .01 .02
Change output gap
Output Gap evolution and evolution of Government Debt
b - FE1 aus1 bel1 can1 can2 den1 fin1 fin2 fin3 gre1 gre2 gre3 gre4 ir1 ir2 ir3 it1 it2 it3 jap1 jap2 net1 net2 pt2 pt3 sp1 swe1 swe2 swe3 uk1 uk2 -10 0 10 20 30 40 C h an ge in Go v. De bt -.02 -.01 0 .01 .02
Change output gap
Output Gap evolution and evolution of Government Debt
c - FE2 aus1 aus2 aus3 aus4 bel1 bel2 bel3 can1 can2 can3 den1 fin1 fin2 fin3 fin4 fin5 fin6 gre1 gre2 gre3
gre4gre5 gre6 ir1 ir2 ir3 it1 it2 it3 jap1 jap2 net1 net2 pt2 pt3 pt3 pt5 pt6 pt7 sp1 swe1 swe2 swe3 swe4 uk1 uk2uk3 -10 0 10 20 30 40 C h an ge in Go v. D e bt -.02 -.01 0 .01 .02
Change output gap
Output Gap evolution and evolution of Government Debt
d - FE3 aus1 aus2 aus3 aus4 bel1 can1 can2 den1 fin1 fin2 fin3 gre1 gre2 gre3 gre4 gre5 ir1 ir2 ir3 it1 it2 jap1 jap2 net1 pt2 pt3 pt4 sp1 swe1 swe2 uk1 uk2 -1 0 0 10 20 30 40 Ch an ge in Go v. De bt -.02 -.01 0 .01 .02
Change output gap
Output Gap evolution and evolution of Government Debt
Note: change in the debt ratio between ts and tf+2 (%); change in the output gap between ts-1 and
tf+1(pp). s, f, respectively starting year and final year of the fiscal consolidation. Source: authors’