R E S E A R C H A R T I C L E
Open Access
Rare coral under the genomic microscope:
timing and relationships among Hawaiian
Montipora
Regina L. Cunha
1,2*, Zac H. Forsman
3, Roy Belderok
3, Ingrid S. S. Knapp
3, Rita Castilho
1,2and Robert J. Toonen
3Abstract
Background: Evolutionary patterns of scleractinian (stony) corals are difficult to infer given the existence of few diagnostic characters and pervasive phenotypic plasticity. A previous study of Hawaiian Montipora (Scleractinia: Acroporidae) based on five partial mitochondrial and two nuclear genes revealed the existence of a species complex, grouping one of the rarest known species (M. dilatata, which is listed as Endangered by the International Union for Conservation of Nature - IUCN) with widespread corals of very different colony growth forms (M. flabellata and M. cf. turgescens). These previous results could result from a lack of resolution due to a limited number of markers, compositional heterogeneity or reflect biological processes such as incomplete lineage sorting (ILS) or introgression. Results: All 13 mitochondrial protein-coding genes from 55 scleractinians (14 lineages from this study) were used to evaluate if a recent origin of the M. dilatata species complex or rate heterogeneity could be compromising phylogenetic inference. Rate heterogeneity detected in the mitochondrial data set seems to have no significant impacts on the phylogenies but clearly affects age estimates. Dating analyses show different estimations for the speciation of M. dilatata species complex depending on whether taking compositional heterogeneity into account (0.8 [0.05–2.6] Myr) or assuming rate homogeneity (0.4 [0.14–0.75] Myr). Genomic data also provided evidence of introgression among all analysed samples of the complex. RADseq data indicated that M. capitata colour morphs may have a genetic basis. Conclusions: Despite the volume of data (over 60,000 SNPs), phylogenetic relationships within the M. dilatata species complex remain unresolved most likely due to a recent origin and ongoing introgression. Species delimitation with genomic data is not concordant with the current taxonomy, which does not reflect the true diversity of this group. Nominal species within the complex are either undergoing a speciation process or represent ecomorphs exhibiting phenotypic polymorphisms.
Keywords: Across-branch compositional heterogeneity, Introgressive hybridization, Species complex, RADseq, Corals Background
Reef-building corals are a complex ecosystem involving bi-otic interactions within the holobiont (the cnidarian host and its associated microorganisms). Multiple sources of genetic variation involving e.g. parallel evolution [1], and the observed ubiquitous phenotypic plasticity [2] have recognizably obscured phylogenetic inference and species delimitation within the order Scleractinia (stony corals). Defining species boundaries plays a central role in the
establishment of conservation policies [3] and biodiversity assessment [4].
The use of a small number of loci usually provides suitable results for distantly related organisms but often produce gene tree discordance when shallower divergences are in-volved due to population-level effects such as allele fre-quency changes [5]. However, the concatenation of multiple independent loci can also produce misleading results [6], when, for example, heterogeneity among gene trees is not modeled appropriately [7]. Incomplete lineage sorting (ILS) and interspecific hybridization are among the most common causes of genome-wide heterogeneity in closely related species [8]. Across-branch compositional heterogeneity (i.e., nonstationarity) may also have strong effects on the
© The Author(s). 2019 Open Access This article is distributed under the terms of the Creative Commons Attribution 4.0 International License (http://creativecommons.org/licenses/by/4.0/), which permits unrestricted use, distribution, and reproduction in any medium, provided you give appropriate credit to the original author(s) and the source, provide a link to the Creative Commons license, and indicate if changes were made. The Creative Commons Public Domain Dedication waiver (http://creativecommons.org/publicdomain/zero/1.0/) applies to the data made available in this article, unless otherwise stated.
* Correspondence:rcunha@ualg.pt
1University of Algarve, Campus de Gambelas, 8005-139 Faro, Portugal 2Centre of Marine Sciences, CCMAR, University of Algarve, Campus de
Gambelas, 8005-139 Faro, Portugal
phylogenetic inference because it groups unrelated taxa that share similar base compositional biases [9–11].
The multispecies coalescent approach [12, 13] and Bayesian species delimitation models using genome-wide data [14] may represent an alternative when single locus are insufficient to solve species boundaries (African bee-tles, [15]; green algae, [16]). Restriction-site associated DNA sequencing (RADseq) along with the production of thousands of single nucleotide polymorphisms (SNPs) is being increasingly used in shallow systematics, particularly in species delimitation of recent radiations [17,18] or to evaluate the existence ancestral hybridization and intro-gression [19].
Phylogenetic inference within stony corals of the order Scleractinia has been hindered by a suit of factors in-cluding hybridization [20] and historical introgression [21]. Nuclear internal transcribed spacers (ITS) and a suite of mitochondrial markers have been widely used in coral phylogenies [22–24], but the existence of multiple ITS copies [25, 26] or the reduced utility of mitochon-drial markers to delimit species [27, 28] has hindered our understanding of the evolution and molecular ecol-ogy of scleractinian corals.
The coral genus Montipora (Scleractinia, Acroporidae) is widely distributed across the Indian and the Pacific Oceans [29]. While putative reticulate evolution and hybridization were detected in some Australian Montipora species [30], it is not clear to what extent this phenomenon is widespread. A study on the Hawaiian congeners based on several mito-chondrial (cytochrome oxidase subunit I, control region, cytochrome b, 16S rRNA, and ATP6) and nuclear (ITS and ATPsβ) markers, revealed the existence of a species complex (M. dilatata/M. flabellata/M. cf. turgescens), and phylogen-etic patterns consistent with ILS, hybridization, polymorph-ism or phenotypic plasticity but the available data could not resolve among these alternate hypotheses [31].
Our objective was to determine if sampling all 13 nearly complete protein-coding genes of the mitochondrial gen-ome and phylogenomic (RADseq) data would allow the resolution of species boundaries within the Montipora dilatata/M. flabellata/M. cf. turgescens complex. Conser-vation actions should be based on evolutionary distinctive-ness metrics (e.g. full-coverage species-level phylogenies diversity over time; [32,33]). This approach requires a sig-nificant amount of data, not always available for the target clade. Other approaches, including expert opinions or phylogenies with lower taxonomic coverage, may also per-form well in the establishment of species boundaries [34].
We used the mitogenomic data set to analyse across-branch compositional biases and perform a dating analysis. We included a larger number of scleractinian representatives (six families and 15 genera) with an ex-tensive fossil record required for date estimation. We intended to evaluate if a recent origin of the M. dilatata
species complex could be hindering phylogenetic infer-ence. RADseq data from 16 samples representing seven nominal Montipora species was used to investigate if ILS and/ or introgressive hybridization could be compromis-ing species delimitation within the M. dilatata complex. We also evaluate whether the morphological variants of the highly polymorphic congener M. capitata can be distinguished at genomic level and how the range of variation within this undisputed species can be com-pared to their endangered congeners. In addition, a range of phenotypes (laminar, encrusting, plating, and branching) of M. capitata and included pooled libraries of distinct colour morphs (red and yellow/orange) previously shown to have different symbiont communi-ties [35] were sampled to characterize within-species variation.
Results
Phylogenetic relationships within Scleractinian based on mitogenomic data
Mapping paired reads in Geneious v.8.1.4 to the mito-chondrial genome of Montipora cactus (GenBank # NC_006902) resulted in a mean of 4583 reads per sample covering 97% of the reference sequence at a mean depth of 61 ± 60 (mean ± standard deviation) per library (Additional file 1: S1B). The concatenated nu-cleotide dataset of the 55 scleractinians (49 species plus five morphotypes and pooled samples within M. capitata) representing 6 families and 15 genera plus the two outgroups (57 taxa in total) comprised 11,484 characters. The net uncorrected p-distance between
M. capitata and M. dilatata species complex was
0.004 ± 0.001. Uncorrected p-distances within the M.
capitata clade and the M. dilatata species complex
clade (M. dilatata/M. flabellata/M. cf. turgescens) were both zero.
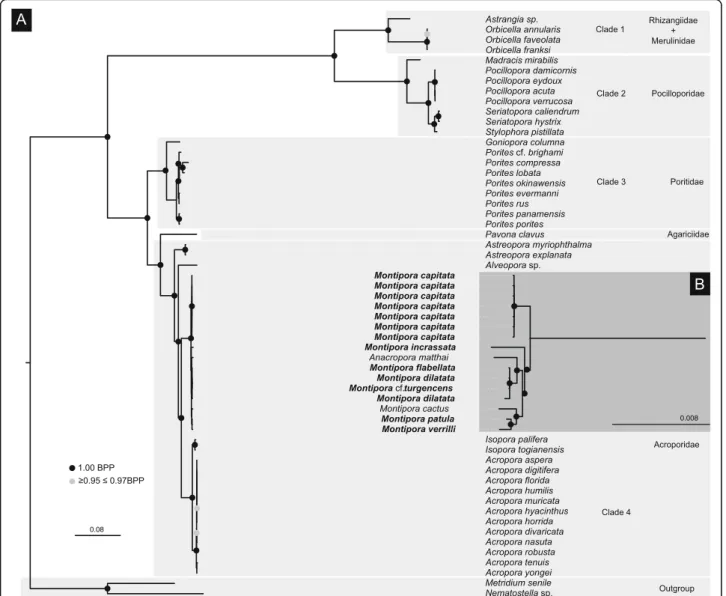
P4 analysis of the concatenated mitochondrial dataset rejected among-lineage composition homogeneity (p-value = 0.00). The analysis under the node-discrete composition heterogeneity model (NDCH2; p-value = 0.85) indicated the existence four main clades including genera from the following families: clade 1 - Rhizangiidae + Merulinidae; clade 2 - Pocilloporidae; clade 3 - Poriti-dae; clade 4 - Acroporidae (Fig. 1). Similar to previous studies [36, 37], the clade corresponding to the family Acroporidae also included the genus Alveopora (Poriti-dae). Phylogenetic relationships within the M. dilatata species complex were unresolved. Montipora capitata was retrieved as the sister lineage to the remaining species of the genus. Montipora patula and M. verrilli grouped to-gether to the exclusion of M. cactus. BI analyses performed with MRBAYES under the assumption of a homogeneous model of rate change yielded a topology (Additional file2: S2) identical to P4.
In RAxML, we used the concatenated mitochondrial nu-cleotide dataset with eight partition schemes as determined by PARTITIONFINDER, and corresponding evolutionary models, all accommodating rate heterogeneity: (1) nad5; (2) nad1; (3) cyt b and cox3; (4) nad2, nad3 and nad4; (5) cox2, nad6and nad4L; (6) atp6; (7) atp8 and (8) cox1. The best substitution model was GTR + I +Γ for all partitions. This analysis (Additional file3: S3) yielded a similar topology to the P4 tree with the two following exceptions: (1) phylogen-etic relationships within the Montipora complex (M. dila-tata/M. flabellata/M. cf. turgescens) were unresolved in P4
and MRBAYES whereas in RAxML M. dilatata (sample
Mdil12) from Kane‘ohe bay was retrieved as the sister
lineage of all remaining species, and (2) phylogenetic rela-tionships between M. capitata morphs were unresolved in MRBAYES, while samples 1 and 2 (red plate/branch and red branch) clustered together with high statistical support in RAXML.
Dating analyses
MULTIDIVTIME (Fig. 2) estimate for the crown group
age of Montipora is 10.5 [5.3–16.6] Myr, while BEAST (Additional file 4: S4) shows a more recent origin for the genus at 4.3 [3.6–5.1] Myr. According to M
ULTI-DIVTIME, the crown group age of M. capitata is 0.6
[0.02–2.4] Myr, whereas BEAST estimates it at 0.2
Fig. 1 a Majority-rule consensus tree of a composition-heterogeneous Bayesian analysis of the concatenated dataset of the 13 protein-coding genes of the mitochondrial genome of 55 scleractinian corals (49 species plus five morphotypes and pooled samples within M. capitata) representing 6 families and 15 genera plus the two outgroups Nematostella sp. and Metridium senile. The NDCH2 analysis was performed in P4 using duplicate runs each consisting of 2 million generations using a GTR + I +Γ model. Bayesian posterior probability values are shown in black circles for values of maximal probability (1.00) and grey circles for values between 0.95 and 0.97. b Inset highlighted in dark grey showing a detail of the inferred phylogenetic relationships within Montipora. Families are highlighted in light grey. Specimens in bold were sequenced in this study
[0.06–0.4] Myr. The crown group age of the complex Montipora dilatata/M. flabellata/M. cf. turgescens was estimated at 0.8 [0.05–2.6] Myr or 0.4 [0.1–0.8], as estimated by MULTIDIVTIME and BEAST, respectively.
SNP-based analyses
The‘coral’ data set averaged ~ 946,887 reads passing fil-tering per library with a coverage depth of 15.63 ± 8.77 (mean ± stdev) (Additional file1: S1B).
The Venn diagram (Additional file6: S6) plotted using the program BioVenn [38] shows minimal overlap be-tween putative coral and symbiont loci. 64% (43,423) of the overall loci (67,598) had significant hits to the M. capitata draft genome, [39], whereas only 6% (4,286) were significant against the Symbiodinium minutum
genome [40] and 7% (4,727) against the Fugacium kawa-gutii genome [41]. As such, we used the‘coral’ data set in all analyses.
The net uncorrected p-distance based on the‘coral’ data set between Montipora capitata and Montipora dilatata species complex was 0.301 ± 0.043. Uncorrected p-dis-tances within the M. capitata clade and M. dilatata species complex clade (M. dilatata/M. flabellata/M. cf.
turgescens) were 0.056 ± 0.011 and 0.140 ± 0.022,
respectively.
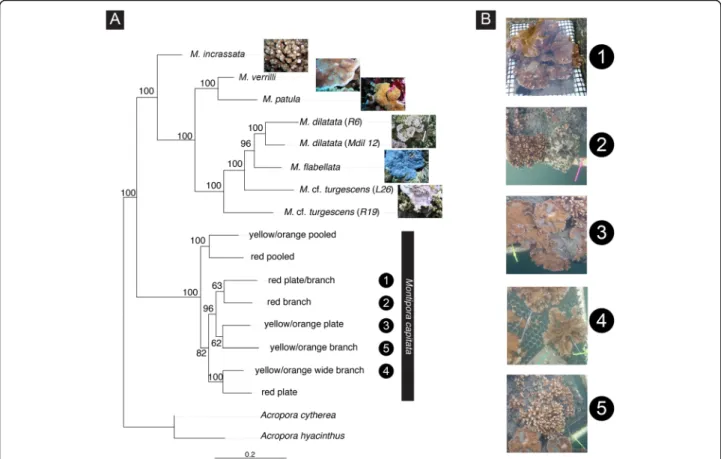
ML analysis based on the‘coral’ dataset (Fig.3), recov-ered the two M. dilatata samples in a clade that received high statistical support. Montipora cf. turgescens (sample L26) did not cluster with its conspecifics (sample R6). Montipora patula and M. verrilli were retrieved as the Fig. 2 Bayesian divergence dating analysis obtained with MULTIDIVTIME. Divergence dates were estimated on the Bayesian topology inferred by P4 and based on the concatenated dataset of the nearly complete 13 mitochondrial protein-coding genes of 55 scleractinian corals (49 species plus five morphotypes and pooled samples within M. capitata) representing 6 families and 15 genera plus the two outgroups Nematostella sp. and Metridium senile (which are automatically removed from the resulting topology). Numbers at the nodes represent age estimates for the main groups in million years. Asteriks at the nodes represent minimum age constraints obtained from the fossil record, and 95% confidence intervals are represented by the blue bars
sister clade of the species. The ML analysis (Fig. 3) showed some level of correspondence between pheno-typic variability and genetic clustering within Montipora capitata. Yellow/orange colonies 3 and 5 and red col-onies 1 and 2 grouped together but with relatively low statistical support. Images of each species and Montipora morphotypes used in the analyses are shown in Additional file 7: S7. We found no genetic association between samples with similar shapes (e.g., colonies 3 and 5 grouped together and show plate and branch shapes, respectively) thus we performed no further ana-lyses on this relationship. More stringent options regard-ing missregard-ing data (−-max-missregard-ing 0.75; 16,379 SNPs) yielded an identical ML topology but with less statistical support for the recovered clades (not shown); therefore, we used the file with a larger number of SNPs (60,602 SNPs) in the analyses.
Bayes factor comparisons for species delimitation using MLE (Table 1) clearly reject current taxonomy, favouring the hypothesis that groups M. capitata by colour morphs and splits the remaining samples into dif-ferent species. The second-best hypothesis is the one that considers M. dilatata and M. flabellata as a single
species and splits the remaining samples into different species. The hypothesis that considers the M. dilatata complex as a single species received low support.
The species tree based on the‘coral’ data set estimated by SVDQuartets yielded a topology (Additional file 5: S5) in which M. dilatata (samples Mdil12 and R6) groups with M. flabellata in the same clade, and the two samples of M. cf. turgescens do not cluster together. The species tree marginally supports a genetic basis for the observed polymorphisms; only yellow/orange colonies 4 and 5 grouped together (Additional file5: S5).
Genomic admixture
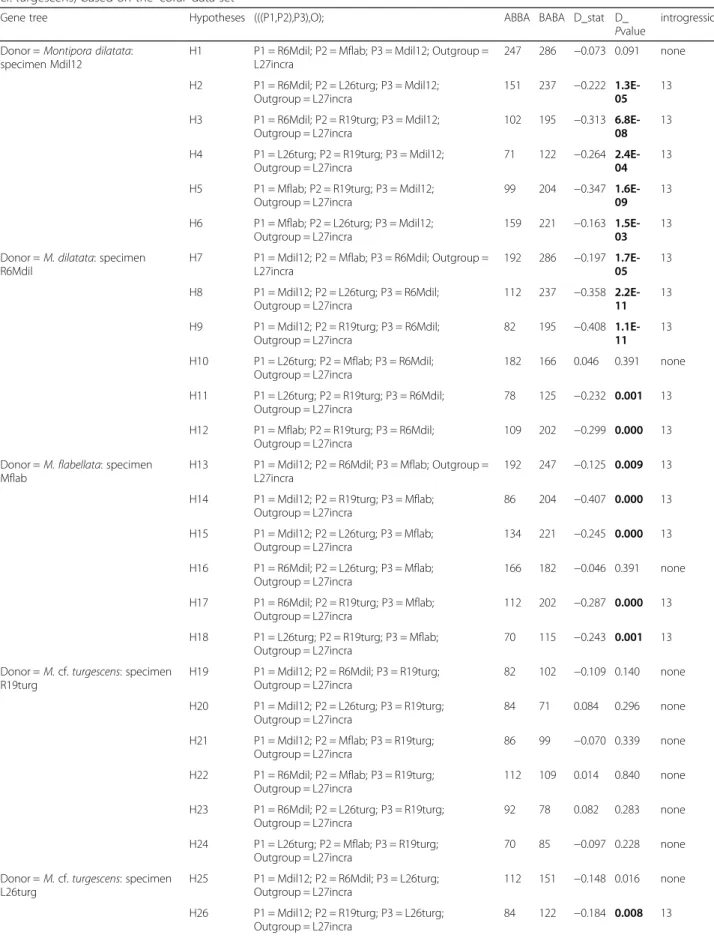
Given the conflicting results we obtained regarding phylo-genetic relationships within the M. dilatata complex de-pending on the methods used (RAxML: M. dilatata monophyletic; SVDQuartets: M. dilatata paraphyletic) we tested for the existence of ILS/introgression. We used the D-statistic calculation [42] to distinguish between both processes. Considering the dubious taxonomic status of the species belonging to the complex, we tested for all 30 possible combinations of donor/admixed lineages between the five samples (Table2).
Fig. 3 Maximum likelihood phylogram of Hawaiian Montipora corals inferred with RAxML based on the‘coral’ dataset (draft genome-based assembly of RADseq data from 16 samples; 60,602 SNPs). Numbers at the nodes represent Bayesian Posterior Probabilities. Acropora cytherea and A. hyacinthus are the selected outgroup. Numbers in the black circles, both on the panel images and branches of the phylogenetic tree, correspond to five distinct morphotypes within Montipora capitata. Specimen labels are indicated within parentheses
Results showed evidence of introgression because of the significant discordant ABBA/BABA site patterns (highlighted in bold in Table 2) between: (i) the donor population M. dilatata (sample Mdil12) vs. all samples but M. cf. turgescens (sample R19turg); (ii) the donor lineage M. dilatata (sample R6) vs. all samples but M. cf. turgescens (sample R19turg); (iii) the donor lineage M. flabellatavs. all samples but M. cf. turgescens (sam-ple R19turg), and (iv) the donor lineage M. cf. turgescens (sample L26turg) vs. M. dilatata (sample Mdil12). Discussion
Phylogenetic reconstructions and species delimitation of scleractinian corals have long been hampered by a
dis-agreement between genetic data and colony-level
morphology [43–47]. This challenge is particularly diffi-cult among genera in which colony morphology is known to be highly variable, such as the Hawaiian Mon-tipora. For example, the rare coral M. dilatata was listed as Endangered by IUCN following a 1996 bleaching event that reduced the population to just two known colonies in the Main Hawaiian Islands [48]. In 2009, M. dilatata, M. flabellata, M. turgescens, M. patula and M. verrilliwere included in a petition to list 83 coral species for protection under the US Endangered Species Act [49]. Several genetic markers called into question the taxonomic validity of these species, however there was not enough data to test alternative hypotheses of pos-sible introgression, incomplete lineage sorting or rapid speciation [31].
Here we used all 13 mitochondrial protein-coding genes and reduced representation genomic sequencing in excess of 60,000 SNPs to evaluate phylogenetic rela-tionships within the Hawaiian M. dilatata species com-plex in a more rigorous hypotheses testing framework than the [31] study.
Montipora phylogenetic relationships sampling greater portions of the genome
Overall, our phylogenetic reconstructions based on mitogenomic data are consistent with previous work,
particularly when examining deeper nodes but show some discrepancies, mostly at intra-generic level. BI and ML ana-lyses (Fig.1, Additional file2: S2 and Additional file 3: S3) showed that Acropora and Isopora are sister genera to Mon-tipora, as reported in previous studies using a more com-prehensive taxon sampling of the Scleractinia [50,51]. The inclusion of Anacropora matthai within the Montipora clade (Fig.1, Additional file2: S2 and Additional file3: S3) was also already described in [36, 52, 53], suggesting that its taxonomic status needs a revision. Our mito-chondrial-based analyses (Fig. 1) further confirmed lack of differentiation between Porites lobata and P. compressa as described in [54].
All analyses based on genomic data (with the single exception of the RAxML topology) revealed that M. dilatata and M. flabellata correspond to a single spe-cies, and the two samples of M. cf. turgescens represent different evolutionary significant units, which does not reflect current taxonomy. Additional population level sampling is needed to determine if the genetic structure within this clade is due to partitioning across geographic regions, habitats, or morphology. Results presented here show the existence of hidden diversity within the genus Montipora that was not detected by the mitochondrial markers, showing the importance of sampling a greater portion of the genome for species delimitation.
Impact of rate heterogeneity on phylogenetic inference and dating estimates
The use of models that do not consider lineage-based compositional heterogeneity may provide strong support for an incorrect topology (e.g., wrong placement of eu-karyotes [55] or the placental mammals [56] in the tree of life). As such, we explored if there were topological differences between the analyses based on mitogenomic data performed under a homogeneous model of se-quence evolution or accommodating among-lineage compositional heterogeneity.
Although our results showed the existence of heterogen-eity in the concatenated mitochondrial dataset (the homo-geneous composition vector was rejected, P = 0.000), its
Table 1 Species delimitation using BFD* with SNP data from the Hawaiian Montipora based on the‘coral’ data set. The six analysed models are ranked according to their Bays Factor (BF) value
Model MLE Rank BF
A - current taxonomy − 572.42 5 N/A
B - splits M. dilatata and M. cf. turgescens samples into different species −318.88 2 −507.1
C - M. dilatata complex as a single species − 721.67 5 298.5
D - groups M. capitata by colour morphs (Yellow/orange; Red) − 288.39 1 − 568.1
E - Lumps M. dilatata into a single species; splits all remaining samples of the complex as different species −338.36 4 − 468.1 F - Groups M. dilatata and M. flabellata into a single species; splits M. cf. turgescens −328.74 3 − 487.4 MLE marginal likelihood estimate, BF Bayes factor.
Table 2 Measure of the phylogenetic admixture among the species of the Montipora dilatata complex. (M. dilatata/M. flabellata/M. cf. turgescens) based on the‘coral’ data set
Gene tree Hypotheses (((P1,P2),P3),O); ABBA BABA D_stat D_
Pvalue
introgression Donor = Montipora dilatata:
specimen Mdil12
H1 P1 = R6Mdil; P2 = Mflab; P3 = Mdil12; Outgroup = L27incra
247 286 −0.073 0.091 none
H2 P1 = R6Mdil; P2 = L26turg; P3 = Mdil12; Outgroup = L27incra
151 237 −0.222 1.3E-05
13 H3 P1 = R6Mdil; P2 = R19turg; P3 = Mdil12;
Outgroup = L27incra
102 195 −0.313 6.8E-08
13 H4 P1 = L26turg; P2 = R19turg; P3 = Mdil12;
Outgroup = L27incra
71 122 −0.264
2.4E-04 13 H5 P1 = Mflab; P2 = R19turg; P3 = Mdil12;
Outgroup = L27incra
99 204 −0.347
1.6E-09 13 H6 P1 = Mflab; P2 = L26turg; P3 = Mdil12;
Outgroup = L27incra
159 221 −0.163 1.5E-03
13 Donor = M. dilatata: specimen
R6Mdil
H7 P1 = Mdil12; P2 = Mflab; P3 = R6Mdil; Outgroup = L27incra
192 286 −0.197 1.7E-05
13 H8 P1 = Mdil12; P2 = L26turg; P3 = R6Mdil;
Outgroup = L27incra
112 237 −0.358 2.2E-11
13 H9 P1 = Mdil12; P2 = R19turg; P3 = R6Mdil;
Outgroup = L27incra
82 195 −0.408
1.1E-11 13 H10 P1 = L26turg; P2 = Mflab; P3 = R6Mdil;
Outgroup = L27incra
182 166 0.046 0.391 none
H11 P1 = L26turg; P2 = R19turg; P3 = R6Mdil; Outgroup = L27incra
78 125 −0.232 0.001 13
H12 P1 = Mflab; P2 = R19turg; P3 = R6Mdil; Outgroup = L27incra
109 202 −0.299 0.000 13
Donor = M. flabellata: specimen Mflab
H13 P1 = Mdil12; P2 = R6Mdil; P3 = Mflab; Outgroup = L27incra
192 247 −0.125 0.009 13
H14 P1 = Mdil12; P2 = R19turg; P3 = Mflab; Outgroup = L27incra
86 204 −0.407 0.000 13
H15 P1 = Mdil12; P2 = L26turg; P3 = Mflab; Outgroup = L27incra
134 221 −0.245 0.000 13
H16 P1 = R6Mdil; P2 = L26turg; P3 = Mflab; Outgroup = L27incra
166 182 −0.046 0.391 none
H17 P1 = R6Mdil; P2 = R19turg; P3 = Mflab; Outgroup = L27incra
112 202 −0.287 0.000 13
H18 P1 = L26turg; P2 = R19turg; P3 = Mflab; Outgroup = L27incra
70 115 −0.243 0.001 13
Donor = M. cf. turgescens: specimen R19turg
H19 P1 = Mdil12; P2 = R6Mdil; P3 = R19turg; Outgroup = L27incra
82 102 −0.109 0.140 none
H20 P1 = Mdil12; P2 = L26turg; P3 = R19turg; Outgroup = L27incra
84 71 0.084 0.296 none
H21 P1 = Mdil12; P2 = Mflab; P3 = R19turg; Outgroup = L27incra
86 99 −0.070 0.339 none
H22 P1 = R6Mdil; P2 = Mflab; P3 = R19turg; Outgroup = L27incra
112 109 0.014 0.840 none
H23 P1 = R6Mdil; P2 = L26turg; P3 = R19turg; Outgroup = L27incra
92 78 0.082 0.283 none
H24 P1 = L26turg; P2 = Mflab; P3 = R19turg; Outgroup = L27incra
70 85 −0.097 0.228 none
Donor = M. cf. turgescens: specimen L26turg
H25 P1 = Mdil12; P2 = R6Mdil; P3 = L26turg; Outgroup = L27incra
112 151 −0.148 0.016 none
H26 P1 = Mdil12; P2 = R19turg; P3 = L26turg; Outgroup = L27incra
impact on the scleractinian phylogeny seems minimal given the similar topologies obtained with methods having differ-ent assumptions (RAxML: gamma model of rate hetero-geneity, P4: across-branch compositional heterogeneity vs. MRBAYES: rate homogeneity). On the other hand, our results show that heterogeneity in among-lineage base composition clearly affects dating analyses. BEAST (rate homogeneity) showed more recent age estimates at the tips and an older root (Additional file 4: S4) when compared with MULTIDIVTIME(rate heterogeneity; Fig.2). The crown group ages of the Hawaiian Montipora were quite different if estimated with MULTIDIVTIME (10.5 Myr) or BEAST (4.3 Myr). Only a few studies are taking into account among-lineage compositional biases when dating divergences (e.g., cichlids [57]), and usually involve the removal of problem-atic genes and loss of significant phylogenetic information. In the methodology we used, age estimates are based on the complete data set and performed over a tree that was inferred with nonstationary models.
Genetic association with phenotypic variability
We used phenotypic variation among well-characterized colour variants of M. capitata to evaluate if there is a genetic basis for the observed polymorphisms. Bayes Factor Delimitation (BFD*) based on > 60,000 SNPs showed a significant correlation between colour variabil-ity and genetic clustering, as indicated by the highest BF value of the model that included the grouping of sam-ples according to their colour (Hypothesis D; Table1).
ML based on the ‘coral’ data set grouped M. capitata colonies by colour (Fig. 3), suggesting that there may be a genetic component to these variants, warranting fur-ther attention. Red and yellow/orange colonies of M. capitatagrowing under identical conditions revealed dis-tinct fluorescent phenotypes [58], which may also support a genetic basis underlying the colour polymorphism. Furthermore, Innis and colleagues [35] found that M. capitata colour morphs contain distinct proportions of clades of photosynthetic dinoflagellates family
Symbiodi-niaceae, in the genera Cladocopium and Durusdinium
(formerly clade C and D), and Shore-Maggio and colleagues showed the same was true of the microbial communities [59] and disease susceptibility [60] of these colour morphs. We found no genetic basis for the pheno-typic differences associated to colony shape (Table1).
Incomplete lineage sorting, introgressive hybridization or a recent origin for the HawaiianMontipora?
The difficulty in establishing species boundaries within the M. dilatata complex has been attributed to either ILS [31] or interspecific hybridization [30], but these as-sumptions were not previously tested. D-statistics tests (Table 2) identified the existence of introgression between all samples of the complex. However, only M. dilatata, M. flabellata and sample L26turg (M. cf. tur-gescens) were identified as donor lineages. Genomic ad-mixture was identified between sympatric lineages (e.g., M. dilatata- sample Mdil12 vs. M. flabellata both from Kāne‘ohe Bay, O‘ahu, Hawaii), but also among samples found in allopatry (e.g., M. cf. turgescens - sample L26turg, Kure Atoll, Northwestern Hawaiian Islands, NWHI vs. M. dilatata - sample Mdil12, Kāne‘ohe Bay).
Reproductive isolation between species is a gradual process allowing introgression of allopatric lineages upon secondary contact, long time after their divergence [61]. In broadcast spawners like Montipora corals, which have the ability to disperse over long distances and maintain gene flow among distant populations, divergence may take even longer and we estimated a very recent origin for the species complex (see next paragraph). Further, the geo-graphic distribution of the nominal species of the complex largely overlaps, and introgression in parapatric lineages was recently described [62]. Introgressive hybridization was also detected in another group of scleractinian corals of the genus Pocillopora [63].
Phylogenetic inference between closely related taxa can be hindered by several factors such as lack of genetic variation in recently-derived taxa [64]. Our dating ana-lysis estimated the crown group age of the complex
Table 2 Measure of the phylogenetic admixture among the species of the Montipora dilatata complex. (M. dilatata/M. flabellata/M. cf. turgescens) based on the‘coral’ data set (Continued)
Gene tree Hypotheses (((P1,P2),P3),O); ABBA BABA D_stat D_
Pvalue
introgression H27 P1 = Mdil12; P2 = Mflab; P3 = L26turg;
Outgroup = L27incra
134 159 −0.085 0.144 none
H28 P1 = R6Mdil; P2 = Mflab; P3 = L26turg; Outgroup = L27incra
166 166 0.000 1.000 none
H29 P1 = R6Mdil; P2 = R19turg; P3 = L26turg; Outgroup = L27incra
92 125 −0.152 0.025 none
H30 P1 = R19turg; P2 = Mflab; P3 = L26turg; Outgroup = L27incra
115 85 0.150 0.034 none
alpha = 0.01.
Montipora dilatata/M. flabellata/M. cf. turgescens under the NDCH2 composition heterogeneity model at 0.8 Myr [0.04–2.62] (Fig. 2). This recent origin is most cer-tainly hampering phylogenetic inference.
Conclusions
Delineating species is critical to our ability to address conservation and management goals, but the boundaries between species can be challenging in groups such as scleractinian corals because genetic data disagree with established taxonomy and gross morphology. Here, we included all 13 mitochondrial coding-genes and RADseq data (> 60,000 SNPs) to test how previous results could be impacted by lack of informative loci, across-branch compositional heterogeneity or biological processes such as introgressive hybridization. We generated the most comprehensive mitogenomic data set gathered to date for scleractinian corals. Despite the volume of data avail-able, we still fail to clearly resolve relationships among nominal species within the M. dilatata species complex. Nevertheless, genomic data revealed new findings: (1) current taxonomy [65] does not reflect the true diversity within the genus; (2) species delimitation tests favoured the model that considered M. dilatata and M. flabellata as a single species and splits the two samples of M. cf. turgescens as different evolutionary significant units; (3) species delimitation tests and ML analysis supported a genetic basis for the observed colour polymorphisms in M. capitata, and (4) the existence of introgression among the species of the complex is confirmed. Dating analyses indicated a very recent origin for the complex. Age estimates varied depending on whether compos-itional heterogeneity was taken into account (0.8 Myr) or rate homogeneity was assumed (0.4 Myr). Genomic admixture was identified between sympatric lineages but also between samples found in allopatry; however, the geographic distribution of the nominal species belonging to the complex largely overlaps, allowing parapatric introgression. Phylogenomic data presented here ques-tions the endangered status of M. dilatata and the taxo-nomic validity of the remaining species of the complex also showing the existence of cryptic genetic diversity within the genus warranting further study.
Methods
Taxon sampling
Tissue from 16 samples belonging to the genus Monti-porawere collected from Hawai’i and the Central Pacific between 2010 and 2013 and stored either in salt-satu-rated dimethyl sulfoxide (DMSO) buffer [66] or in 95% ethanol prior DNA extraction. All our samples had a mean sample size of 1–2 cm2
and were taken by non-le-thal tissue biopsy of the corals as required by the State collection permits (SAP-HIMB2010, SAP-HIMB2011,
SAP-HIMB2012, SAP-HIMB2013) that we obtained to sample these organisms. There were no colonies har-vested (or permanently damaged) for this research (all heal within less than 30 days from the biopsy sampling), and all were sampled as approved by the State and Fed-eral agencies responsible for their management.
The samples included six different morphological types (morphs) and two pooled samples (red and yellow/ orange) of M. capitata, two samples of M. dilatata, two samples of M. turgescens, and one sample from each of the following nominal species: M. verrilli, M. patula, M. incrassata, and M. flabellata (Additional file 1: S1A). We sampled a range of variation within M. capitata in-cluding samples (five fragments from each colour morph) that were collected around the Hawai‘i Institute of Marine Biology and grown from ~2cm fragments in a ‘common garden’ floating rack, in a lagoon environment for six years.
For the mitogenomic analyses, we used all 13 mito-chondrial protein-coding genes from 14 Montipora sam-ples sequenced in this study and retrieved from the GeneBank 41 coral species of the order Scleractinia, representing a total of 6 families and 15 genera (Gene-Bank accession numbers in the Additional file 1: S1A, Genomic libraries were deposited in the NCBI short read archive with the bioproject ID PRJNA554733). Taxon sampling essentially focused on the family Acro-poridae (genera Acropora, Montipora, Isopora and Ana-cropora). The remaining taxa were selected because of their fossil record, which is required for calibration in the dating analysis.
Laboratory procedures, sequence alignment and genetic distances
Genomic DNA was extracted from coral tissue using the OMEGA (BIO-TEK) E-Z 96 Tissue DNA Kit and eluted in 2 × 100μl. Extractions were quantified using the AccuBlueTM (Biotium, Inc.). Libraries were generated using the ezRAD method [67, 68]. Genomic DNA was digested using the isoschizomer restriction enzymes MboI and Sau3AI (New England BioLab), which both cleave at GATC recognition sites. Details on library preparation are described in Johnston [63]. All libraries were size-selected between 300 and 500 bp and only after passing the quality control steps (bioanalyser and qPCR) were sequenced at the Hawai’i Institute of Marine Biology (HIMB) Genetics Core Facility following the Illumina TruSeq Sample Prep v2 Low Throughput protocol.
The 16 Illumina Montipora libraries were assembled to the mitochondrial genome of Montipora cactus (NC_ 006902) to get the consensus sequences using the de-fault settings (high sensitivity iterated up to five times and the medium/read mapping settings) in GENEIOUS
v.8.1.4 (Biomatters, Auckland, New Zealand; https://
www.geneious.com). We failed to get reliable
mitochon-drial consensus sequences from two of the sequenced li-braries corresponding to the samples MturgL26 (M. cf. turgescens) and mCAPsamp (M. capitata).
Following Medina et al. [69], the actinarians Nematos-tellasp. and Metridium senile (GenBank accession num-bers: DQ643835 and HG423143, respectively) were selected as the outgroup of the Scleractinia used in the mitogenomic analyses. Each mitochondrial protein-cod-ing gene from the 55 scleractinians (14 samples from this study) plus the two outgroups (57 taxa in total) was individually aligned with MAFFTv7.245 [70]. The inverte-brate mitochondrial genetic code was used to detect open reading frames (ORFs) and stop codons and de-duce the amino acid sequences of each of the 13 partial mitochondrial protein-coding genes in MESQUITE v3.2 [71]. Those alignments were concatenated into a single dataset (57 taxa, 11,484 bp) used in Bayesian inference (BI) and maximum likelihood (ML) analyses. All newly generated mitochondrial protein-coding sequences have been deposited in GenBank, for which accession num-bers are provided in the Additional file1: S1A.
Sequence distances of the mitochondrial concatenated data set with 500 bootstrap replicates were calculated in MEGA5 [72]. Uncorrected within p-distances were com-puted for the following groups: (1) all M. capitata sam-ples representing a wide range of colony morphology, and (2) all samples within the M. dilatata complex (M. dilatata: Mdil12 + R6; M. cf. turgescens: R19 + L26 and M. flabellata). Net-sequence distances were estimated between M. capitata and M. dilatata complex.
Phylogenetic analyses of mitochondrial DNA based on standard homogeneous models
Bayesian Inference (BI) analyses based on the concatenated mitochondrial dataset (57 taxa, 11,484 bp) were performed with MRBAYESv3.2.1 [73] under a homogeneous model of rate change (rates = equal). All analyses were run for 9 × 10⁷generations (four simultaneous Markov chains; 1 × 10³ sample frequency) following a discarded burn-in of 10%. The convergence to the stationary distributions was con-firmed by inspection of the MCMC samples using Tracer v. 1.6 [74].
Across-branch compositional heterogeneity
To analyse if there was across-branch compositional het-erogeneity in the concatenated nucleotide data set from the 13 mitochondrial protein-coding genes representing 55 Scleractinian lineages, we first inferred a phylogeny under a model of composition homogeneity as imple-mented in P4 v1.2.0 [9]. As the results indicated a null probability for this model we used the node-discrete composition heterogeneity (NDCH2) model [9] with
GTR + I + Γ, also implemented in P4 v1.2.0. This soft-ware performs a Bayesian MCMC analysis which allows composition to vary among lineages, with a distinct composition vector for each node [11].
We performed ML analysis of the concatenated mito-chondrial data set with RAxML v8.2.10 [75] using the option–q that specifies the file name which contains the assignment of models to alignment partitions for mul-tiple models of substitution under the GTR-CAT ap-proximation (gamma model of rate heterogeneity). We used PARTITIONFINDER2 v.2.1.1 [76] with the corrected Akaike Information Criterion (AICc) to select the best partitioning scheme and corresponding best-fit model of substitution. The best-scoring ML tree was determined from 100 randomized maximum-parsimony starting trees using the rapid hill-climbing algorithm, and 1000 bootstrap replicates were drawn on each best-scored ML tree using the exhaustive bootstrap algorithm.
P4, BI and ML analyses were performed on the CCMAR computational cluster facility (http://gyra.ualg. pt) and on the R2C2 computational cluster facility pro-vided by the IT Department of the University of Algarve.
Dating analyses of mitogenomic data
To date major splitting events within Hawaiian Monti-poraand estimate the origin of the M. dilatata complex, we used 55 Scleractinian lineages that exhibit extensive fossil record and have mitogenomic data available. Two relaxed molecular-clock approaches were used to evalu-ate the impact of revalu-ate heterogeneity on devalu-ate estimevalu-ates. The software MULTIDIVTIME [77] includes an input top-ology, which in this case was set to the one inferred by P4 that accommodates across-branch compositional het-erogeneity, and BEASTv.1.8.4 [78] allows the use of rate homogeneity models.
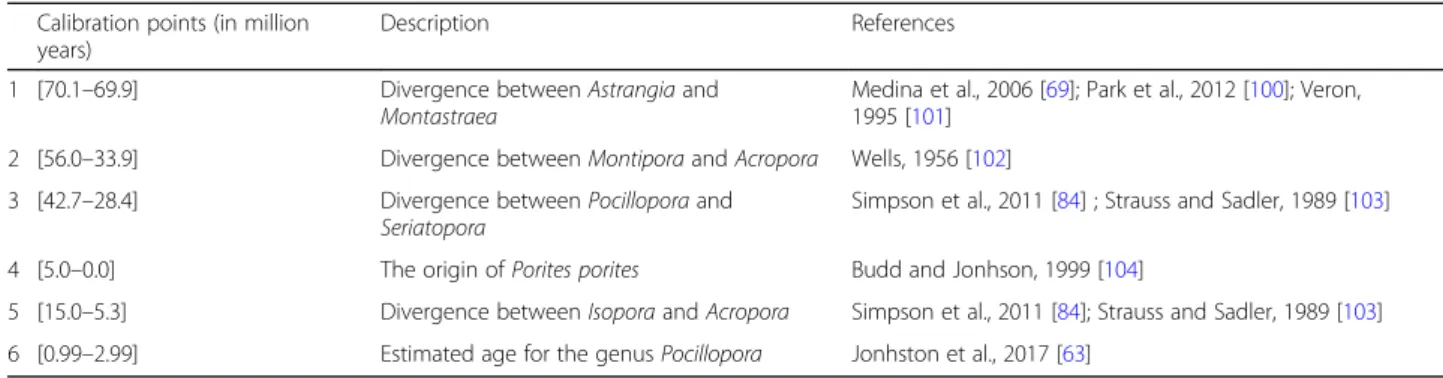
MULTIDIVTIME: following Thorne and Kishino [79], we used PAML v.3.14 [80] to estimate ML parameters using a discrete gamma distribution with five rate categories and the F84 model of nucleotide substitution that was selected because of computational tractability [81]. E ST-BRANCHES [82] was used to estimate branch lengths and subsequently MULTIDIVTIME was used to estimate diver-gence times. This method requires a prior assumption for the mean and standard deviation of the time of the ingroup root node (rttm) that represents the calibration of the root of the tree. This parameter was set to 24.5 time units, where in this analysis, one-time unit repre-sents 10 million years (Myr). This value was based on the earliest record of the true scleractinians in during the Anisian (≈ 245) Myr [83,84]. The standard deviation of the prior distribution was set to its maximum value (equal to the mean) to avoid violation of the definition of a prior. Calibrations are indicated in Table 3. The MCMC method was employed to approximate both
prior and posterior distributions [82]. Initial parameter values were randomly selected to initialize the Markov chain and then, a burn-in period of 100,000 cycles was completed before parameters were sampled from the MCMC chain. Afterwards, the state of the Markov chain was sampled every 100 cycles until a total of 10,000 generations.
BEAST: we selected the Birth-Death Incomplete Sam-pling tree prior because we were only using a fraction of the extant Scleractinia. As we wanted to compare date es-timates between models incorporating across-branch compositional heterogeneity as implemented in P4/Multi-divtime and homogeneous models, we used BEASTwithout the gamma model. We used the same calibrations as in the MULTIDIVTIMEanalysis described in Table3 that were modeled with a normal distribution: (1) divergence be-tween Astrangia and Montastraea (mean = 70, stdev = 0.1, 2) divergence between Montipora and Acropora (mean = 44.95, stdev = 11.05, 3) divergence between Pocillopora and Seriatopora (mean = 35.55, stdev = 7.15, 4) estimated origin of Porites porites (mean = 2.5; stdev = 2.5, 5) diver-gence between Isopora and Acropora (mean = 10.15, stdev = 4.85, 6) estimated age for the genus Pocillopora (mean = 1.99, stdev = 0.65). We ran two independent runs for 100,000,000 generations, sampling every 1000 genera-tions. The final tree was produced by TREEANNOTATOR using the“maximum clade creditability” option and mean node height, after burn-in of 10% of the generations. The convergence to the stationary distribution was confirmed by inspection of the Markov Chain Monte Carlo (MCMC) samples and of effective sample sizes (ESS should be > 200) using TRACERv1.6.0 [74].
SNP-based analyses
We used 16 individuals representing a range of morph-ologies and two pooled samples representing common colour morphs (yellow/orange and red) of M. capitata, to characterize within species variability within this notoriously polymorphic species and determine possible relationships between genotype and phenotype (more details in Additional file 1: S1A). In addition, we
included two samples of each nominal species M. dila-tata and M. cf. turgescens, and one sample from M. fla-bellata to analyse phylogenetic relationships within the M. dilatataspecies complex. We also included a sample of M. incrassata and M. verrilli to further analyse phylo-genetic relationships within Montipora.
FastQC was used for a preliminary quality control of the pair-end reads [85]. The raw reads from Illumina were cleaned with Trim Gallore! [86] and subsequently analysed with dDocent 2.2.25 [87, 88], a pipeline that combines several software packages (https://github.com/
jpuritz/dDocent/). All libraries were mapped to the M.
capitatadraft genome [39] using BWA [89] with the fol-lowing settings: -L 20,5 -t 32 -a -M -T 10 -A 1 -B 4 -O 6 -R. We usedVCFTOOLS v0.1.15 [90] to filter the resulting variant call file (VCF) from dDocent analysis using the following options: --remove-indels --max-missing 0.50 --thin 300 --mac 3 --minQ 30. We performed an add-itional analysis using max-missing = 0.75 to evaluate the impact of missing data on phylogenomic reconstruction.
To evaluate the level of contamination from Symbiodi-niaceae de-novoassembly of all data was performed with dDocent v2.2.25 [87, 88] with a clustering threshold of 0.85, default mapping and SNP calling parameters. Prior to filtering, only loci with at least 2x coverage within libraries and present in at least 3 libraries were retained. The reference sequences for all loci (n = 67,598) gener-ated by dDocent were then compared at the amino acid-level using tBLASTx [91] to several available reference genomes in order to determine if the locus was of putative coral or Symbiodiniaceae origin.
To convert the filtered SNPs in VCF format to PHYLIP for phylogenetic analysis we used a python script (https:// github.com/edgardomortiz/vcf2phylip) that also performs an additional filtering (a minimum of 10 samples are re-quired to be present at a locus, where the default value is 4 to use in a phylogenomic analysis). The dataset hereafter called‘coral’ consisted of 60,602 SNPs.
Uncorrected p-distances with 500 bootstrap replicates were calculated in MEGA5 [72] following the same pro-cedure described for the mitochondrial data.
Table 3 Calibration points used in the mitogenomic dating analysis
Calibration points (in million years)
Description References
1 [70.1–69.9] Divergence between Astrangia and
Montastraea
Medina et al., 2006 [69]; Park et al., 2012 [100]; Veron, 1995 [101]
2 [56.0–33.9] Divergence between Montipora and Acropora Wells, 1956 [102]
3 [42.7–28.4] Divergence between Pocillopora and
Seriatopora
Simpson et al., 2011 [84] ; Strauss and Sadler, 1989 [103]
4 [5.0–0.0] The origin of Porites porites Budd and Jonhson, 1999 [104]
5 [15.0–5.3] Divergence between Isopora and Acropora Simpson et al., 2011 [84]; Strauss and Sadler, 1989 [103] 6 [0.99–2.99] Estimated age for the genus Pocillopora Jonhston et al., 2017 [63]
ML analyses based on the ‘coral’ data set were per-formed with RAxML v8.2.10 [75]. Following the manual recommendations, the analysis was run under the GTRGAMMA evolutionary model. The best-scoring ML tree was determined from 100 randomized maximum-parsimony starting trees using the rapid hill-climbing al-gorithm, and 100 bootstrap replicates were drawn on the best-scored ML tree using the exhaustive bootstrap algorithm. Acropora cytherea was selected as outgroup.
We used Bayes delimitation with genomic data (BFD*), a species delimitation method for analysis of SNP data [14] to establish the number of species within Monti-pora. BFD* combines the BEAST V.2.4.8 [92] add-on SNAPP [93] with path sampling that estimates marginal likelihoods to use in Bayes factor model selection [14]. We used the VCF file from the dDocent run based on the M. capitata draft genome assembly. The filtered VCF (as described earlier) was converted to a binary nexus format using the script vcf2phylip (https://github.
com/edgardomortiz/vcf2phylip; [94]). We conducted
path sampling with 24 steps to estimate the marginal likelihood estimates (MLE). The MCMC chain for path sampling analysis was run in BEAST V.2.4.8 for 1,000,000 generations and sampled every 1000 with a pre-burnin of 100,000. We used the framework of Kass and Raftery [95] to evaluate the strength of support of Bayes factor (BF) comparisons of competing models. A positive BF test statistic (2 x loge) reflects evidence in favor model 1, whereas negative BF values support model 2 [14]. A BF value between 2 and 6 represents positive evidence and BF > 10 is decisive. We tested six different hypotheses: (A) supports current taxonomy (M. verrilli, M. patula, M. capitata, M. incrassata, M. flabellata, M. cf. turges-cens and M. dilatata) with all individuals of the same nominal species grouping together; (B) splits M. cf. tur-gescensand M. dilatata samples in different species; (C) groups all samples belonging to the Montipora dilatata complex into a single species: M. cf. turgescens (samples L26 + R19); M. flabellata; M. dilatata, (samples R6 + Mdil12); (D) groups M. capitata samples by colour morph (red and yellow/orange) as a single species, and the remaining Montipora samples as separate species; (E) lumps M. dilatata into a single species; splits all remaining samples of the complex as different species; (F) groups M. dilatata and M. flabellata into a single species; splits M. cf. turgescens. Acropora cytherea was used as outgroup in all models.
We used SVDQuartets (Singular Value Decomposition for quartets) [96] to estimate the species tree under the multi-species-coalescent model from SNP data (‘coral’ data set), as implemented in PAUP* v.4.0a (build 163) [97]. We assessed node support with 100 bootstraps, and an exhaustive search of all possible quartets (3060) were evaluated using the QFM quartet assembly algorithm.
Testing introgression
Phylogenetic discordances (differences in gene tree top-ologies) can result from either incomplete lineage sort-ing (ILS) or introgressive hybridization. Given the conflicting patterns of the ML SNP-based topology based and the species tree, we tested all 30 possible combinations of genomic admixture among the nominal species belonging to the species complex M. dilatata/M. flabellata/ M. cf. turgescens (see Table2 for further de-tails). We selected M. incrassata as outgroup based on the results we obtained in the phylogenetic analyses.
We estimated the Patterson’s D-statistic [98, 99] running the python script dfoil.py https://github.com/ jbpease/dfoil with the “--mode dstat” option for a four-taxon D-statistic calculation [42]. In a four-taxon phylo-genetic relationship represented by (((P1, P2), P3), O)
where P represents the lineages of interest for
hybridization and O the outgroup, the D-statistic com-pares two incongruent SNP patterns, ABBA and BABA, in which“B” is the derived allele and “A” the ancestral allele [98,99]. In the absence of gene flow and random mating, frequencies of the two patterns are expected to be similar [99]. Under a ILS scenario, we would expect that both pat-terns (ABBA/BABA) would be sampled with equal fre-quency while a statistically significant imbalance would reflect introgression [42].
Additional files
Additional file 1:S1. A. Species_list: Scleractinian corals used in the mitogenomic data set, accession numbers corresponding to the complete mitochondrial genomes retrieved from GenBank and to the newly sequenced 13 partial mitochondrial protein-coding genes of the 14 Montipora samples used in the mitogenomic analyses. List of Montipora samples used in the RADseq analyses. B. Sample_information: collected sample information regarding mitogenomic and genomic analyses (number of reads, reads length, mean depth coverage and standard deviation, percentage of the reference sequence). (XLSX 18 kb)
Additional file 2:S2. A. Bayesian analysis showing phylogenetic relationships among 55 scleractinian corals (49 species plus five morphotypes and pooled samples within M. capitata) representing 6 families and 15 genera plus the two outgroups Nematostella sp. and Metridium senile based on the concatenated mitochondrial dataset (13 protein-coding genes). B. Inset showing a detail of the topology referring to the genus Montipora zoomed 20x. This analysis was produced by MRBAYESunder a homogeneous model of rate change. Bayesian posterior probability (BPP) values are shown in black circles for values of maximal probability (1.00) and a grey circle for a value of 0.57. (JPG 587 kb)
Additional file 3:S3. A. Maximum likelihood phylogram of 55 scleractinian corals (49 species plus five morphotypes and pooled samples within M. capitata) representing 6 families and 15 genera plus the two outgroups Nematostella sp. and Metridium senile based on the concatenated mitochondrial dataset (13 protein-coding genes) produced by RAxML under a gamma model of rate heterogeneity. B. Inset showing a detail of the topology referring to the genus Montipora zoomed 100x. Numbers at the nodes represent bootstrap proportions. (PDF 230 kb)
Additional file 4:S4. BEASTmaximum clade credibility chronogram showing main cladogenetic events among 55 scleractinian corals (49 species plus five morphotypes and pooled samples within M. capitata) representing 6 families and 15 genera plus the two outgroups
Nematostella sp. and Metridium senile. The 95% highest posterior density (HPD) intervals are represented by the blue bars, and numbers at the nodes represent million years. (PDF 226 kb)
Additional file 5:S5. Species tree based on 60,602 SNPs from the‘coral’ data set estimated with SVDquartets. Numbers at the nodes represent bootstrap proportions. Image plates represent in-situ photographs of Montipora species sampled for this study and of the morphotypes within Montipora capitata. (JPG 386 kb)
Additional file 6:S6. Venn diagram showing the overlap between putative coral (Montipora capitata) and symbionts (Symbiodinium minutum and Fugacium kawagutii) loci. (PDF 109 kb)
Additional file 7:S7. In-situ photographs of Montipora species sampled for this study and of the morphotypes within Montipora capitata. (JPG 3488 kb)
Abbreviations
BFD*:Bayes Factor Delimitation with genomic data; DMSO: Salt-saturated dimethyl sulfoxide; HIMB: Hawai’i Institute of Marine Biology; ILS: Incomplete lineage sorting; ITS: Nuclear internal transcribed spacers; IUCN: International Union for Conservation of Nature; NCBI: National Center for Biotechnology Information; NDCH2: Node-discrete composition heterogeneity model; NWHI: Northwestern Hawaiian Islands; RADseq: Restriction-site associated DNA sequencing; SNPs: Single nucleotide polymorphisms; VCF: Variant call file Acknowledgements
We thank Cymon J. Cox and Filipe Sousa for all the help with P4. We are also very grateful to Edgardo M. Ortiz for sharing the python script to convert VCF files into PHYLIP and NEXUS binary formats. We thank Erika C. Johnston, Romina Henriques and Miguel Baltazar Soares for the help with RADseq data analyses. We wish to thank Ashley Smith and Christina Runyan for identifying and collecting the orange/yellow and red Montipora capitata phenotypes. Ashley Smith passed away before she was able to finish her dissertation research and we dedicate this work towards her research interests in her honour.
Authors’ contributions
RLC, ZHF and RJT conceived the study, ISSK and RB collected the data. RLC and ZHF analysed the data, RC provided financial support for the acquisition of computational facilities for genomic analyses and designed the figures. RLC and RJT wrote the manuscript and all authors provided critical feedback approving the final version of the manuscript.
Funding
RLC was supported by the Portuguese Foundation for Science & Technology (FCT) post-doctoral fellowship (SFRH/BPD/109685/2015). Sequencing for this project was supported by the Pauley Foundation and NSF-OA#1416889 to RJT. This is HIMB contribution # 1765 and SOEST # 10748. This study also re-ceived Portuguese national funds from FCT - Foundation for Science and Technology through project UID/Multi/04326/2019 and from the operational programs CRESC Algarve 2020 and COMPETE 2020 through projects EMBRC.PT 022121 and BIODATA.PT ALG-01-0145-FEDER-022231.
Availability of data and materials
The datasets generated and/or analysed during the current study are available in the GeneBank (accession numbers in the Additional file1: S1A and NCBI SRA bioproject ID PRJNA554733).
Ethics approval and consent to participate
Our research activities for this project were covered by the State of Hawai’i, Department of Land & natural Resources, Special Activity Permits: SAP-HIMB2010–1, SAP-HIMB2011–1, SAP-HIMB2012–63, SAP-HIMB2013–47 issued to the Hawai’i Institute of Marine Biology.
Consent for publication Not applicable. Competing interests
The authors declare that they have no competing interests.
Author details
1University of Algarve, Campus de Gambelas, 8005-139 Faro, Portugal. 2Centre of Marine Sciences, CCMAR, University of Algarve, Campus de
Gambelas, 8005-139 Faro, Portugal.3Hawai‘i Institute of Marine Biology, University of Hawai‘i at Mānoa, Kāne‘ohe, HI 96744, USA.
Received: 6 February 2019 Accepted: 11 July 2019
References
1. Fukami H, Budd AF, Paulay G, Solé-Cava A, Chen CA, Iwao K, Knowlton N. Conventional taxonomy obscures deep divergence between Pacific and Atlantic corals. Nature. 2004;427(6977):832–5.
2. Sawall Y, Al-Sofyani A, Hohn S, Banguera-Hinestroza E, Voolstra CR, Wahl M. Extensive phenotypic plasticity of a Red Sea coral over a strong latitudinal temperature gradient suggests limited acclimatization potential to warming. Sci Rep. 2015;5:8940.
3. Vitecek S, Kučinić M, Previšić A, Živić I, Stojanović K, Keresztes L, Bálint M, Hoppeler F, Waringer J, Graf W. Integrative taxonomy by molecular species delimitation: multi-locus data corroborate a new species of Balkan Drusinae micro-endemics. BMC Evol Biol. 2017;17(1):129.
4. Gómez-Zurita J, Cardoso A, De la Cadena G, Jurado-Rivera JA, Maes J-M, Montelongo T, Nguyen DT, Papadopoulou A. High-throughput biodiversity analysis: Rapid assessment of species richness and ecological interactions of Chrysomelidae (Coleoptera) in the tropics. ZooKeys. 2016;597:3.
5. Golding B, Felsenstein J. A maximum likelihood approach to the detection of selection from a phylogeny. J Mol Evol. 1990;31(6):511–23.
6. Kubatko LS, Degnan JH. Inconsistency of phylogenetic estimates from concatenated data under coalescence. Syst Biol. 2007;56(1):17–24. 7. Liu Y, Cox CJ, Wang W, Goffinet B. Mitochondrial phylogenomics of early
land plants: mitigating the effects of saturation, compositional heterogeneity, and codon-usage bias. Syst Biol. 2014;63(6):862–78. 8. Nater A, Burri R, Kawakami T, Smeds L, Ellegren H. Resolving evolutionary
relationships in closely related species with whole-genome sequencing data. Syst Biol. 2015;64(6):1000–17.
9. Foster PG. Modeling compositional heterogeneity. Syst Biol. 2004;53(3):485–95. 10. Moran RJ, Morgan CC, O'Connell MJ. A guide to phylogenetic
reconstruction using heterogeneous models—a case study from the root of the placental mammal tree. Computation. 2015;3(2):177–96.
11. Puttick MN, Morris JL, Williams TA, Cox CJ, Edwards D, Kenrick P, Pressel S, Wellman CH, Schneider H, Pisani D, et al. The Interrelationships of Land Plants and the Nature of the Ancestral Embryophyte. Curr Biol. 2018;28(5):733–45 e732. 12. Rannala B, Yang Z. Bayes estimation of species divergence times and
ancestral population sizes using DNA sequences from multiple loci. Genetics. 2003;164:1645–56.
13. Yang Z, Rannala B. Bayesian species identification under the multispecies coalescent provides significant improvements to DNA barcoding analyses. Mol Ecol. 2017;26(11):3028–36.
14. Leaché AD, Fujita MK, Minin VN, Bouckaert RR. Species delimitation using genome-wide SNP data. Syst Biol. 2014;63(4):534–42.
15. Ahrens D, Fujisawa T, Krammer HJ, Eberle J, Fabrizi S, Vogler AP. Rarity and incomplete sampling in DNA-based species delimitation. Syst Biol. 2016;65:478–94. 16. Leliaert F, Verbruggen H, Vanormelingen P, Steen F, Lopez-Bautista J,
Zuccarello G, Clerck O. DNA-based species delimitation in algae. Eur J Phycol. 2014;49(2):179–96.
17. Shaffer HB, Thomson RC. Delimiting Species in Recent Radiations. Syst Biol. 2007;56(6):896–906.
18. Herrera S, Shank TM. RAD sequencing enables unprecedented phylogenetic resolution and objective species delimitation in recalcitrant divergent taxa. Mol Phylogenet Evol. 2016;100:70–9.
19. Eaton DA, Ree RH. Inferring phylogeny and introgression using RADseq data: an example from flowering plants (Pedicularis: Orobanchaceae). Syst Biol. 2013;62(5):689–706.
20. Richards ZT, van Oppen MJH, Wallace CC, Willis BL, Miller DJ. Some Rare Indo-Pacific Coral Species Are Probable Hybrids. PloS One. 2008;3(9):e3240. 21. Putnam HM, Adams DK, Zelzion E, Wagner NE, Qiu H, Mass T, Falkowski PG,
Gates RD, Bhattacharya D. Divergent evolutionary histories of DNA markers in a Hawaiian population of the coral Montipora capitata. PeerJ. 2017;5:e3319. 22. Forsman ZH, Guzman HM, Chen CA, Fox GE, Wellington GM. An ITS region
phylogeny of Siderastrea (Cnidaria: Anthozoa): is S. glynni endangered or introduced? Coral Reefs. 2005;24:343–7.
23. Forsman ZH, Wellington GM, Fox GE, Toonen RJ. Clues to unraveling the coral species problem: distinguishing species from geographic variation in Porites across the Pacific with molecular markers and microskeletal traits. PeerJ. 2015;3:e751.https://doi.org/10.7717/peerj.7751.
24. Hellberg ME, Prada C, Tan MH, Forsman ZH, Baums IB. Getting a grip at the edge: recolonization and introgression in eastern Pacific Porites corals. J Biog. 2016;43(11):2147–59.
25. Vollmer SV, Palumbi SR. Testing the utility of internally transcribed spacer sequences in coral phylogenetics. Mol Ecol. 2004;13(9):2763–72. 26. Chen CA, Chang C-C, Wei NV, Chen C, Lein Y-T, Lin H-E, Dai C-F,
Wallace C. Secondary structure and phylogenetic utility of the ribosomal internal transcribed spacer 2 (ITS2) in scleractinian corals. Zool Stud. 2004;43(4):759–71.
27. Hellberg ME. No variation and low synonymous substitution rates in coral mtDNA despite high nuclear variation. BMC Evol Biol. 2006;6(1):24. 28. Budd AF, Nunes FL, Weil E, Pandolfi JM. Polymorphism in a common
Atlantic reef coral (Montastraea cavernosa) and its long-term evolutionary implications. Evol Ecol. 2012;26(2):265–90.
29. Veron J, Stafford-Smith MG. Corals of the World. Townsville: Australian Institute of Marine Science; 2000.
30. Van Oppen M, Koolmees E, Veron J. Patterns of evolution in the scleractinian coral genus Montipora (Acroporidae). Mar Biol. 2004;144(1):9–18.
31. Forsman ZH, Concepcion GT, Haverkort RD, Shaw RW, Maragos JE, Toonen RJ. Ecomorph or endangered coral? DNA and microstructure reveal Hawaiian species complexes: Montipora dilatata/flabellata/turgescens & M. patula/verrilli. PLoS One. 2010;5(12):e15021.
32. Redding DW, Hartmann K, Mimoto A, Bokal D, DeVos M, Mooers AØ. Evolutionarily distinctive species often capture more phylogenetic diversity than expected. J Theor Biol. 2008;251(4):606–15.
33. Huang D. Threatened reef corals of the world. PLoS One. 2012;7(3):e34459. 34. Curnick D, Head C, Huang D, Crabbe MJC, Gollock M, Hoeksema B, Johnson
K, Jones R, Koldewey H, Obura D. Setting evolutionary-based conservation priorities for a phylogenetically data-poor taxonomic group (Scleractinia). Anim Conserv. 2015;18(4):303–12.
35. Innis T, Cunning R, Ritson-Williams R, Wall CB, Gates RD. Coral color and depth drive symbiosis ecology of Montipora capitata in Kāne'ohe Bay, O'ahu, Hawai‘i. Coral Reefs. 2018;37(2):423–30.
36. Fukami H, Chen CA, Budd AF, Collins A, Wallace C, Chuang Y-Y, Chen C, Dai C-F, Iwao K, Sheppard C. Mitochondrial and nuclear genes suggest that stony corals are monophyletic but most families of stony corals are not (Order Scleractinia, Class Anthozoa, Phylum Cnidaria). PloS one. 2008;3(9):e3222. 37. Budd AF, Romano SL, Smith ND, Barbeitos MS. Rethinking the phylogeny of
scleractinian corals: a review of morphological and molecular data. Integr Comp Biol. 2010;50(3):411–27.
38. Hulsen T, de Vlieg J, Alkema W. BioVenn–a web application for the comparison and visualization of biological lists using area-proportional Venn diagrams. BMC genomics. 2008;9(1):488.
39. Shumaker A, Putnam H, Qiu H, Price DC, Zelzion E, Harel A, Wagner N, Gates RD, Yoon HS, Bhattacharya D. Genome analysis of the rice coral Montipora capitata. Sci Rep. 2019;9:2571.
40. Shoguchi E, Shinzato C, Kawashima T, Gyoja F, Mungpakdee S, Koyanagi R, Takeuchi T, Hisata K, Tanaka M, Fujiwara M. Draft assembly of the Symbiodinium minutum nuclear genome reveals dinoflagellate gene structure. Curr Biol. 2013;23(15):1399–408.
41. Lin S, Cheng S, Song B, Zhong X, Lin X, Li W, Li L, Zhang Y, Zhang H, Ji Z. The Symbiodinium kawagutii genome illuminates dinoflagellate gene expression and coral symbiosis. Science. 2015;350(6261):691–4. 42. Pease JB, Hahn MW. Detection and Polarization of Introgression in a
Five-taxon Phylogeny. Syst Biol. 2015;64(4):651–62.
43. Gittenberger A, Reijnen BT, Hoeksema BW. A molecularly based phylogeny reconstruction of mushroom corals (Scleractinia Fungiidae) with taxonomic consequences and evolutionary implications for life history traits. Contrib Zool. 2011;80(2):107–32.
44. Huang D, Licuanan WY, Baird AH, Fukami H. Cleaning up the“Bigmessidae”: molecular phylogeny of scleractinian corals from Faviidae, Merulinidae, Pectiniidae and Trachyphylliidae. BMC Evol Biol. 2011;11:37.
45. Kitahara MV, Stolarski J, Cairns SD, Benzoni F, Stake JL, Miller DJ. The first modern solitary Agariciidae (Anthozoa, Scleractinia) revealed by molecular and microstructural analysis. Inv Syst. 2012;26(3):303–15.
46. Benzoni F, Arrigoni R, Stefani F, Reijnen B, Montano S, Hoeksema BW. Phylogenetic position and taxonomy of Cycloseris explanulata and C. wellsi
(Scleractinia: Fungiidae): lost mushroom corals find their way home. Contrib Zool. 2012;81(3):125–46.
47. Arrigoni R, Kitano YF, Stolarski J, Hoeksema BW, Fukami H, Stefani F, Galli P, Montano S, Castoldi E, Benzoni F. A phylogeny reconstruction of the Dendrophylliidae (Cnidaria, Scleractinia) based on molecular and micromorphological criteria, and its ecological implications. Zool Scripta. 2014;43(6):661–88.
48. DeVantier L, Hodgson G, Huang D, Johan O, Licuanan A, Obura D, Sheppard C, Syahrir M, Turak E: Montipora dilatata. . The IUCN Red List of Threatened Species 2008 2008,https://doi.org/10.2305/IUCN.UK.2008.RLTS.T1331 70A3612492.en. Downloaded on 13 September 2018.:e.T133170A3612492. 49. Brainard RE, Birkeland C, Eakin CM, Mcelhany P, Miller MW, Patterson M,
Piniak GA. In: Commer. D: NOAA Tech. Memo, NOAA-TM-NMFS-PIFSC-27, editors. Status review report of 82 candidate coral species petitioned under the U.S. Endangered Species Act, vol. 530; 2011.
50. Wallace C, Chen C, Fukami H, Muir P. Recognition of separate genera within Acropora based on new morphological, reproductive and genetic evidence from Acropora togianensis, and elevation of the subgenus Isopora Studer, 1878 to genus (Scleractinia: Astrocoeniidae; Acroporidae). Coral Reefs. 2007;26(2):231–9. 51. Kitahara MV, Lin M-F, Forêt S, Huttley G, Miller DJ, Chen CA. The“naked
coral” hypothesis revisited–evidence for and against scleractinian monophyly. PLoS One. 2014;9(4):e94774.
52. Fukami H, Omori M, Hatta M. Phylogenetic relationships in the coral family Acroporidae, reassessed by inference from mitochondrial genes. Zool Sci. 2000;17(5):689–96.
53. Kitahara MV, Cairns SD, Stolarski J, Blair D, Miller DJ. A comprehensive phylogenetic analysis of the Scleractinia (Cnidaria, Anthozoa) based on mitochondrial CO1 sequence data. PloS one. 2010;5(7):e11490. 54. Forsman ZH, Knapp ISS, Tisthammer K, Eaton DAR, Belcaid M, Toonen RJ.
Coral hybridization or phenotypic variation? Genomic data reveal gene flow between Porites lobata and P. compressa. Mol Phylog Evol. 2017;111:132–48. 55. Cox CJ, Foster PG, Hirt RP, Harris SR, Embley TM. The archaebacterial origin
of eukaryotes. Proc Natl Acad Sci. 2008;105(51):20356–61.
56. Morgan CC, Foster PG, Webb AE, Pisani D, McInerney JO, O’Connell MJ. Heterogeneous Models Place the Root of the Placental Mammal Phylogeny. Mol Biol Evol. 2013;30(9):2145–56.
57. Azuma Y, Kumazawa Y, Miya M, Mabuchi K, Nishida M. Mitogenomic evaluation of the historical biogeography of cichlids toward reliable dating of teleostean divergences. BMC Evol Biol. 2008;8(1):215.
58. Forsman ZH, Knapp ISS, Szabo Z, Toonen RJ. Intraspecific fluorescent phenotypes in Montipora capitata. Galaxea J Coral Reef Stud. 2014;16:17–8. 59. Shore-Maggio A, Runyon CM, Ushijima B, Aeby GS, Callahan SM. Differences
in bacterial community structure in two color morphs of the Hawaiian reef coral, Montipora capitata. Appl Env Microbiol. 2015;81:7312–8.
60. Shore-Maggio A, Callahan SM, Aeby GS. Trade-offs in disease and bleaching susceptibility among two color morphs of the Hawaiian reef coral, Montipora capitata. Coral Reefs. 2018;37(2):507–17.
61. Huang JP. Parapatric genetic introgression and phenotypic assimilation: testing conditions for introgression between Hercules beetles (Dynastes, Dynastinae). Mol Ecol. 2016;25(21):5513–26.
62. Souissi A, Bonhomme F, Manchado M, Bahri-Sfar L, Gagnaire P-A. Genomic and geographic footprints of differential introgression between two divergent fish species (Solea spp.). Heredity. 2018;121(6):579–93. 63. Johnston EC, Forsman ZH, Flot J-F, Schmidt-Roach S, Pinzón JH, Knapp ISS,
Toonen RJ. A genomic glance through the fog of plasticity and diversification in Pocillopora. Sci Rep. 2017;7(1):5991.
64. Cariou M, Duret L, Charlat S. Is RAD-seq suitable for phylogenetic inference? An in silico assessment and optimization. Ecol Evol. 2013;3(4):846–52. 65. Hoeksema BW, Cairns S: World List of Scleractinia. 2019. http://www.
marinespecies.org/scleractinia. Accessed 19 May 2019.
66. Gaither MR, Szabó Z, Crepeau MW, Bird CE, Toonen RJ. Preservation of corals in salt-saturated DMSO buffer is superior to ethanol for PCR experiments. Coral Reefs. 2011;30(2):329–33.
67. Toonen RJ, Puritz JB, Forsman ZH, Whitney JL, Fernandez-Silva I, Andrews KR. Bird CE: ezRAD: a simplified method for genomic genotyping in non-model organisms. PeerJ. 2013;1:e203.
68. Knapp ISS, Puritz JB, Bird CE, JL W, Sudek M, Forsman ZH, Toonen RJ. ezRAD- an accessible next-generation RAD sequencing protocol suitable for non-model organisms_v3.2. 2016.https://www.protocols.io/view/ ezrad-an-accessible-next-generation-rad-sequencing-e9pbh5n. Accessed 15 May 2017.