University of Algarve
Faculty of Marine and Environmental Sciences
The influence of inert diets on digestive
capacity of fish larvae species:
Diplodus sargus
and Solea
senegalensis
Inês Maria dos Santos Guerreiro
Masters in Aquaculture and Fisheries Specialization Aquaculture
University of Algarve
Faculty of Marine and Environmental Sciences
The influence of inert diets on digestive
capacity of fish larvae species:
Diplodus sargus
and Solea
senegalensis
Inês Maria dos Santos Guerreiro
Masters in Aquaculture and FisheriesSpecialization Aquaculture 2008
Thesis supervision by:
Internal coordinator: Doutora Laura Ribeiro (Centro de Ciências do Mar - CCMAR)
Professora Doutora Maria Teresa Dinis (Universidade do Algarve)
External coordinator: Dr. Pedro Marques Pousão Ferreira
(Investigador auxiliar e responsável pela Estação Piloto de Piscicultura de Olhão do Instituto Nacional dos Recursos Biológicos – IPIMAR)
Acknowledgements
À Doutora Maria Teresa Dinis pela forma inspiradora como fala sobre a aquacultura, e por ser óptima a transmitir os seus conhecimentos.
À Doutora Laura Ribeiro por ter aceite ser minha orientadora, pela paciência, disponibilidade, motivação, explicações e pela planificação de todo o trabalho.
Ao Dr. Pedro Pousão pelos esclarecimentos, preocupação e disponibilidade demonstrados ao longo do trabalho.
Ao grupo de Aquacultura por ter possibilitado a realização da parte experimental do trabalho no seu laboratório, e pelos jantares pagos a que fui… :)
À direcção do IPIMAR por ter possibilitado a realização da parte de cultivo nas instalações da Estação Piloto de Piscicultura de Olhão do Instituto Nacional dos Recursos Biológicos.
Ao pessoal da EPPO pelo apoio durante a realização do cultivo e por serem como são, pois são muito divertidos e fizeram com que passasse lá muitos bons momentos.
Ao João e ao Pedro porque sem eles teria ido todos os dias a pé para a EPPO e por terem sido excelentes companhias de viagem.
À Mahaut que me ensinou e ajudou no cultivo, me deu algumas boleias para a EPPO e por se ter revelado uma pessoa excepcional com a qual me diverti bastante.
À Vanessa que realizou o cultivo do linguado e me passou algumas informações para o trabalho.
À Vera por me ter ensinado como se determinam as enzimas e por ter tido uma grande paciência para as minhas fantásticas perguntas e dúvidas quase existenciais.
Ao pessoal do laboratório por me ter ajudado sempre que precisei, especialmente à Mónica que, embora ainda não me conhecesse, foi até à EPPO para ajudar nas amostragens.
A todos os meus amigos por me terem apoiado e por serem quem são. Quero agradecer especialmente à Lúcia pois, mesmo a passar por uma fase muito complicada da sua vida, soube ouvir os meus problemas parvos, ajudar-me e fazer-me companhia. Sem o apoio dela não teria conseguido. Obrigada Lúcia!
Aos meus pais porque sem eles nunca teria chegado aqui e também à minha irmã pois ouvem-me a falar de assuntos dos quais não fazem a mínima ideia do que são, mas fazem que sim com a cabeça e me apoiam sempre.
Abstract
The present study aimed to analyse the effect of weaning on white seabream and Senegalese sole digestive capacity by analysing pancreatic and intestinal digestive enzymes. For white seabream an earlier introduction of the diet was analysed, so diet was introduced at 20 and 27 days after hatching (DAH), respectively, W20 and W27 treatments. For sole (30 DAH) two weaning strategies were studied, namely sudden weaning, SW treatment, and 5 days co-feeding, CF treatment.
The experiment with white seabream was divided in two periods, until 20 days where the pattern of digestive enzymes activity was analysed; after 20 DAH where the introduction of inert diet was analysed for 3 weeks period, ending at 41 and 48 days respectively for W20 and W27 treatment. For sole, the experimental period was carried out between 30 and 60 DAH.
Trypsin, amylase, lipase, pepsin, alkaline phosphatase, acid phosphatase, aminopeptidase and leucine-alanine peptidase, were analysed on different larval segments (whole larvae, abdominal cavity, digestive tract segment and brush border).
Until 20 DAH trypsin, alkaline phosphatase, leucine-alanine, aminopeptidase and acid phosphatase specific activities increased significantly, while pepsin, amylase and lipase kept relatively constant until 20 DAH.
Regarding white seabream weaning, W27 treatment exhibited higher growth than W20 treatment. Nonetheless, no significant differences were observed on fish larvae digestive enzymatic capacity between treatments 3 weeks after inert diet introduction, and although larvae from W20 treatment were more affected initially they were able to recover to similar levels of activity. This study suggested that inert diet can be included in the feeding regime of white seabream as early as 20 DAH
Sole post larvae from SW treatment exhibited higher growth and survival rate than CF treatment. Trypsin, alkaline phosphatase and leucine-alanine specific activities decreased until 40 DAH, while amylase, pepsin and aminopeptidase kept more or less constant until 40 DAH, where no differences were observed between treatments. The total activity tended to decrease until 40 DAH, but without significant differences between treatments. At 60 DAH there were not significant differences in enzymes specific and total activities between treatments.
The decrease observed for digestive enzymes total activity reflected the poor condition of sole larvae from both treatments. Both strategies of weaning resulted in poor results.
Key words: Diplodus sargus, Solea senegalensis, digestive enzymes, weaning,
Resumo
O conhecimento da fisiologia digestiva de larvas de peixes marinhos ao longo do seu desenvolvimento é crucial para compreender as capacidades digestivas das espécies, e assim permitir a sua produção em aquacultura.
O sargo, Diplodus sargus, e o linguado, Solea senegalensis, são duas espécies de elevado valor económico e com potencial de cultivo, sendo por isso importante estudar aspectos relacionados com a sua fisiologia digestiva. Com este trabalho pretendeu-se estudar a influência do alimento inerte na capacidade digestiva do sargo e do linguado, através da quantificação da actividade de diferentes enzimas digestivos. No caso do sargo, analisou-se o efeito de uma adaptação precoce ao alimento inerte, ao introduzir-se a dieta aos 20 dias após a eclosão (DAE; W20) e comparando com o tratamento em que a dieta foi introduzida aos 27 DAE (W27; normal/controlo). No caso do linguado avaliou-se a estratégia de adaptação ao alimento inerte, nomeadamente uma adaptação súbita – tratamento SW – ou uma co-alimentação durante 5 dias – tratamento CF –, ambos com início aos 30 DAH.
No caso do sargo consideram-se duas fases experimentais. Na primeira fase que decorreu até aos 20 dias, analisou-se o padrão da actividade enzimática ao longo do desenvolvimento das larvas. Na segunda fase, avaliou-se o efeito de uma adaptação precoce ao alimento inerte nos enzimas digestivos durante 3 semanas, terminando o ensaio aos 41 e 48 DAE, respectivamente, para o tratamento W20 e W27. O plano alimentar consistiu em rotíferos (4-26 DAE), Artemia naupli (13-19 DAE),
Artemia metanaupli (16-26 DAE para o tratamento W20 e 16-33 DAE para o
tratamento W27) e alimento inerte (20-41 DAE para o tratamento W20 e 27-48 para o tratamento W27).
Em relação ao linguado, o período experimental decorreu entre os 30 e 60 DAE consistindo o plano alimentar em Artemia (30-34 DAE para o tratamento CF) e alimento inerte (30-60 DAE).
No caso do sargo, realizaram-se amostragens aos 0, 2, 9, 13 e 20 DAE para caracterizar o padrão de actividade digestiva. Enquanto no ensaio de adaptação ao alimento inerte, realizaram-se amostragens no início da adaptação, uma e três semanas após a introdução do alimento inerte. Em relação ao linguado, efectuaram-se amostragens aos 30, 35, 40, 50 e 60 DAE pós-larvas de linguado.
No sargo analisou-se a tripsina, a amilase, a pepsina, a lipase, a fosfatase alcalina, a leucina-alanina peptidase, a aminopeptidase e a fosfatase ácida. No linguado apenas foi analisado a tripsina, amilase, pepsina, fosfatase alcalina, aminopeptidase e leucina-alanina peptidase. Os dados da actividade enzimática foram apresentados como actividade específica: U mg protein−1 e actividade total: U larva−1.
A actividade enzimática foi determinada em diferentes segmentos, ao longo do desenvolvimento larvar. No sargo, até aos 20 DAE utilizou-se todo o corpo da larva para a análise enzimática, enquanto as larvas mais velhas foram dissecadas a fim de se obter a porção abdominal. No linguado, até aos 40 DAE as pós-larvas foram dissecadas obtendo-se a porção abdominal, enquanto nas idades posteriores as pós-larvas foram dissecadas para se obter o segmento pancreático e o intestinal, o qual foi ainda utilizado para obter o prato estriado do intestino.
As larvas de sargo apresentaram um crescimento exponencial tanto em peso como em comprimento. Até aos 20 DAE as actividades específicas da tripsina, fosfatase alcalina, leucina-alanina peptidase, aminopeptidase e fosfatase ácida aumentaram significativamente, enquanto as actividades específicas da pepsina, amilase e lipase mantiveram-se relativamente constantes. As actividades da lipase e leucina-alanina só foram detectadas aos 9 DAE. A actividade da pepsina teve o maior valor de actividades aos 0 DAE mas aos 2 DAE não se detectou actividade. A actividade total dos enzimas estudados aumentou significativamente até aos 20 DAE.
No ensaio de adaptação ao alimento inerte, as larvas de sargo do tratamento W27 comparativamente às larvas do tratamento W20 apresentaram um maior crescimento em peso e comprimento e uma sobrevivência superior. Três semanas após a introdução do alimento inerte no plano alimentar do sargo, as larvas do tratamento W20 apresentavam uma tendência em ter uma actividade enzimática superior, embora sem apresentarem diferenças significativas entre os tratamentos. Neste mesmo período, as larvas do tratamento W20 comparativamente com as larvas do tratamento W27 apresentaram no prato estriado uma maior actividade específica da aminopeptidase. A actividade total dos enzimas estudados aumentou significativamente até ao final da experiência, sendo significativamente maior nas larvas do tratamento W27. No entanto, analisando o aumento relativo da actividade dos enzimas digestivos, observou-se que as larvas do tratamento W20 exibiram um aumento relativo após as três semanas da introdução do alimento inerte no plano alimentar. Três semanas após a introdução do alimento inerte não se observaram diferenças significativas no índice de maturação dos enterócitos para ambos os tratamentos.
Em relação ao linguado, as pós-larvas do tratamento SW comparativamente às pós-larvas do tratamento CF apresentaram um maior crescimento em peso e comprimento e uma sobrevivência superior. As actividades específicas da tripsina, fosfatase alcalina e leucina-alanina peptidase decresceram até aos 40 DAE, enquanto as actividades específicas da amilase, pepsina e aminopeptidase se mantiveram relativamente constantes até os 40 DAE. A esta idade não existiram diferenças
significativas entre as actividades específicas dos tratamentos. As actividades específicas determinadas no prato estriado decresceram até aos 40 DAE, mas sem se observarem diferenças significativas entre os tratamentos. A actividade total até aos 40 DAE teve uma tendência decrescente mas sem diferenças estatísticas entre os tratamentos. Considerando a fosfatase alcalina, aos 40 DAE a percentagem de maturação dos enterócitos é significativamente superior nas larvas do tratamento SW.
Aos 60 DAE não ocorreram diferenças significativas nas actividades específicas dos enzimas entre os tratamentos do linguado. Os valores de actividade total analisados no pâncreas e intestino mantiveram-se quase inalterados entre as duas idades e tratamentos analisados. Aos 60 DAH não ocorreram diferenças significativas entre tratamentos relativamente à percentagem de maturação dos enterócitos.
O padrão de actividade dos enzimas digestivos estudados no sargo esteve relacionado com a organogénese e o tipo de alimento usado nos diferentes estados de desenvolvimento. Este estudo permitiu verificar que antecipando a introdução do alimento inerte no plano alimentar das larvas de sargo, neste caso aos 20 DAE, a capacidade digestiva não é afectada, uma vez que as larvas no final do período experimental apresentavam níveis de actividade enzimática semelhantes aos apresentados pelas larvas do tratamento W27.
A actividade enzimática no linguado não foi afectada pelo tipo de desmame e, quando o foi, no final do período experimental o nível de actividade enzimática era semelhante para ambos os tipos de desmame. O método de desmame mais ambicionado pela indústria é o desmame súbito já que permite uma redução na utilização de alimento vivo. Neste estudo o tipo de desmame que menos afectou fisicamente as pós-larvas foi o desmame súbito, mas os resultados não permitem concluir que este seja o melhor método, já que ambas as estratégias alimentares produziram fracos resultados. O decréscimo observado na actividade enzimática total reflectiu a baixa condição física exibida pelas pós-larvas de ambos os tratamentos.
Palavras-chave: Diplodus sargus, Solea senegalensis, enzimas digestivas, desmame,
Índice
1. Introduction... 1
The species………..4
Diplodus sargus………..4
Solea senegalensis………6
Objectives of this study………...7
2. Materials and methods... 8
2.1 Larval rearing conditions ... 8
2.1.2 Broodstock and egg incubation ... 8
Diplodus sargus………..8 Solea senegalensis………8 2.1.3 Larval rearing ... 9 Diplodus sargus………..9 Solea senegalensis………..10 2.1.3.1 Experimental design………..11 Diplodus sargus……….11 Solea senegalensis………...12 2.1.4 Sampling ... 13 Diplodus sargus………14 Solea senegalensis………..14
2.2 Biometric analytical measurement... 14
2.3 Enzymatic analysis... 14
2.3.1 Fish larvae dissection... 14
Diplodus sargus………15
Solea senegalensis………..15
Diplodus sargus and Solea senegalensis………16
2.3.2 Enzymatic assays... 17
2.3.2.1 Trypsin analysis………...17
2.3.2.2 Aminopeptidase analysis………17
2.3.2.3 Amylase analysis……….17
2.3.2.4 Alkaline phosphatase analysis………..18
2.3.2.5 Pepsin analysis………18
2.3.2.6 Lipase analysis……….18
2.3.2.7 Intestinal peptidases analysis………18
2.3.2.8 Acid phosphatase analysis……….19
2.3.2.10 Enzyme activity expression……….19
2.4 Data analysis ... 20
3. Results... 21
3.1 Growth and survival ... 21
Diplodus sargus………21
Ontogenic development……….………….21
Growth after weaning……….………….21
Solea senegalensis………...23
3.2 Enzymatic activity... 24
Diplodus sargus………..24
Enzymatic ontogenetic development..……….………….24
Digestive enzymes activities at weaning………..28
Solea senegalensis………..34
Enzymatic activity in sole post larvae digestive tract…………...………..34
Enzymatic activity on pancreatic and intestinal segment after dissection…..39
4. Discussion ... 43
Diplodus sargus………43
Growth and ontogeny of digestive enzymes.……….………….43
Weaning at different stages of development………...46
Solea senegalensis………..50
Enzymatic activity in sole post larvae digestive tract………...51
Enzymatic activity on pancreatic and intestinal segment after dissection…..54
1. Introduction
To successfully rear aquaculture species through the larval stage is essential to know their nutritional physiology (Zambonino-Infante and Cahu, 2007). Nowadays aquaculture species have assumed a great importance regarding the scarcity of some marine fish resources and the increasing demand of food to support the world population. An adequate nutrition is essential to be successful in rearing fish larvae and post-larvae and to quickly achieve big and healthy adults and this depends on the effective ingestion, digestion and assimilation of the right nutrients contained in the diet (Lazo et al., 2007).
Nowadays aquaculture industry searches for fish species with potential to be reared with sustainable methodologies, in other words, fish which is cultivated in a healthier manner. Mesocosm technology combines intensive and extensive aquaculture, being a semi-intensive technique, that is considered a potential sustainable method which solves many problems found in intensive and extensive methods such as biological and technical ones (Papandroulakis et al., 2004). Papandroulakis et al. (2004) successfully reared Diplodus sargus sargus with a mesocosm technology. Solea senegalensis and Diplodus sargus seem to be species that presents potential for this type of production.
The first period of cultivation of marine species is entirely dependent of live feeds, and this raises the production costs (Rosenlund et al., 1997). In fact one of the main objectives of aquaculture is a complete substitution of live feed by inert diets, although it was only accomplished with European sea bass larvae (Zambonino-Infante and Cahu, 2007). Live feed provides better growth and survival in early stages of fish larvae but has some disadvantages such as they may act as vectors of diseases, the nutritional value can be variable, the nutritional quality is difficult to manipulate and above all they are time-consuming to produce and consequently expensive (Pousão-Ferreira et al., 2003; Ribeiro et al., 2005). Substitution of live feed by compound diets is essential to reduce the production costs and for a sustainable production of high and constant quality juveniles (Cahu and Zambonino-Infante, 2001). So, today there are huge efforts to reduce the period of live feed, and introduce compound diet as early as possible.
Among the different technologies used to reduce the period of live feeds, a period of co-feeding is frequently adopted, because beyond reducing the period of live feed the aim is to obtain quality juveniles that are yet dependent of live feed. Co-feeding has been demonstrated to improve larval performance, when compared with feeding only
dry or live feed, and to wean in a shorter time (Roselund et al., 1997; Pousão-Ferreira
et al., 2003; Engrola et al., 2007). For Kolkovski et al. (1997), co-feeding presents
advantages in weaning fish larvae since visual and chemical stimuli increases inert diet ingestion and there are a biochemical influence of live feed in larvae digestion and assimilation. A more suitable nutrient supply is given when co-feeding dry and live feed (Roselund et al., 1997; Cañavate & Fernández-Díaz, 1999). Other advantage of co-feeding is that the presence of live feed together with inert diet makes larvae accept more easily the inert diet when the live feed is withdrawn (Cañavate & Fernández-Díaz, 1999; Pousão-Ferreira et al., 2003). The period of co-feeding changes depending on species, last only a few days in some species or several weeks in others (Conceição et
al., 2007).
The study of the ontogeny and activity of enzymes in fish larvae might be of great importance to understand the digestive process and to reduce the period of live feed (Cara et al., 2003; Suzer et al, 2007). Different levels of enzymes and enzyme activities could indicate different nutrient requirements by larvae (Ribeiro et al, 2008), and this information can help to define adequate nutritional protocols for specific ages (Tengjaroenkul et al, 2002; Tramati and Mazzola, 2005). Changes in the diet are not the principal reason for changes in the enzymatic activity during ontogeny, but determine the plateau level of enzymes, being fishes able to modulate their enzymatic activity as the characteristics of feed change (Cahu and Zambonino-Infante, 1994).
During development, digestive enzyme capacity has been used to evaluate the larval digestive capacity, as an indicator of larval development and as a predictor of future survival (Cara et al., 2003). It has been proposed that proteolytic enzymes activities can influence the maximum growth rate that fish can attain (Blier et al, 2002).
Digestion involves several enzymes, such as trypsin, aminopeptidase, amylase, alkaline phosphatase, acid phosphatase, pepsin, lipase, leucine-alanine peptidase. These enzymes can be divided in proteolytic enzymes and lipolitic enzymes.
Proteolytic enzymes namely trypsin, aminopeptidase, amylase, alkaline and acid phosphatase, pepsin and leucine-alanine peptidase can be found in three areas of the digestive tract, stomach, pancreas and intestine.
Lipolitic enzymes are secreted by the hepatopancreas or pancreas, and one example is lipase (Zambonino-Infante and Cahu, 2007).
Digestion of proteins, the principal component required for fish growth, is carried out by pancreatic proteases, before the formation of the stomach (Zambonino-Infante and Cahu, 2001). Proteins are cleaved in smaller peptides which are cleaved in aminoacids and dipeptides at brush border. Before the maturation of the brush border, peptides are absorbed and digested in the cytosolic lumen on enterocytes by cytosolic
enzymes, as the leucine-alanine peptidase and acid phosphatase (Zambonino-Infante and Cahu, 2001).
Pepsin is an enzyme whose function is the digestion of proteins. In marine fish larvae stomach only appears several weeks after hatching. In Pleuronectes
americanus pepsin activity was only detected later on after stomach maturation with
the appearance of gastric glands bicarbonate sodium secretion (Douglas et al., 1999). The secretion of pepsin has been related with the transition from larvae to juvenile stage (Zambonino-Infante and Cahu, 2007). The lack of a functional stomach does not hind protein digestion, because there are many other enzymes that digest proteins, such as pancreatic and intestinal enzymes, so this enzyme does not seem crucial for protein digestion (Cahu and Zambonino-Infante, 2001; Zambonino-Infante and Cahu, 2007).
Trypsin is a pancreatic enzyme presenting the typical characteristics of pancreatic enzymes: is expressed at first feeding, the secretion and activity in the intestinal lumen increases in the first weeks of development characterizing the normal maturation process of pancreas. Trypsin is considered an important enzyme for digestion because it is the only pancreatic enzyme that activates other enzymes (Lazo
et al., 2007). In fishes, trypsin shows a higher affinity for intact proteins than for
hydrolysed ones (Zambonino-Infante and Cahu, 2007) and its presence before mouth opening suggests that its activity is not induced by feed (Zambonino-Infante and Cahu, 2001). Besides, studies with Atlantic cod and Atlantic salmon described a strong correlation between trypsin activity and growth rate and food conversion efficiency (Blier et al, 2002).
Amylase is another pancreatic enzyme, which can be considered characteristic of the post-natal period, as lactase in mammals. Amylase activity exhibits high levels of activity in the first days of fish larvae development and then shows a decrease in its activity. This decrease may be genetically programmed and reflect different nutritional requirements at different periods of life (Zambonino-Infante and Cahu, 2001). Glycolytic chains and glycogen are components of the diet that can stimulate amylase activity in fish larvae (Cahu and Zambonino-Infante, 2001).
After the digestion by the pancreatic enzymes the components of feed are digested by intestinal enzymes that can be located inside enterocytes (cytosolic) or on brush border membranes. Leucine-alanine peptidase and acid phosphatase are cytosolic enzymes, alkaline phosphatase and aminopeptidase are brush border enzymes. Leucine-alanine peptidase and acid phosphatase are responsible for completing protein digestion, reducing peptides in aminoacids in enterocytes cytoplasm. Micropinocytosis and intracellular digestion of proteins in the posterior
intestine helps in the digestion, compensating the lack of a functional stomach (Cara et al., 2003). These enzymes activity are stimulated by incorporating protein hydrolysate in the diet (Zambonino-Infante and Cahu, 2007).
The concomitant decrease of cytosolic enzymes activity with the increase of brush border enzymes activity is characteristic of intestinal maturation and the beginning of an adult mode of digestion (Zambonino-Infante and Cahu, 2001). It is thought that the structure most probably responsible for the digestion of luminal peptides in vertebrates is the intestinal epithelium. When intestine maturation occurs, peptides digestion is mainly done by alkaline phosphatase and aminopeptidase (Cara
et al., 2003). Alkaline phosphatase is sintetized in the Golgi apparatus of the
enterocytes (Tengjaroenkul et al, 2002).
To summarize, acid phosphatase is an indicator of protein pynocitosis, leucine-alanine and aminopeptidase of complete hydrolysis at an intestinal level and alkaline phosphatase is an indicator of absorption of aminoacids (Cara et al., 2003). Leucine-alanine has been used as a marker of larval mode of digestion (Kvåle et al., 2007).
Maturation of enterocytes is of great importance for the larvae, since good growth and survival is achieved with early maturation of enterocytes. This maturation is genetically programmed but an inadequate diet may delay or avoid the enterocyte maturation inducing larvae mortality (Cahu and Infante, 2001; Zambonino-Infante and Cahu, 2007).
Lipase is one of the main lipolitic enzymes, and is secreted as a response to the presence in the lumen of his substrate of triglycerides. But the secretion mediated by the substrate has limits because 15% of triglycerides in the feed is the maximum capacity of lipase synthesis for some marine fish species (Cahu and Zambonino-Infante, 2001). Lipase is responsible for catalysing the hydrolysis of carboxy-ester bonds. The region of the intestine were occur the digestion and absorption of lipids is the anterior intestine (Zambonino-Infante and Cahu, 2007). In young larvae regulation of lipolitic enzymes seems to be efficient, fact that can explain why larval growth is so dependent on dietary lipid levels (Cahu and Zambonino-Infante, 2001).
The total activity of enzymes increases with age due to an increase in the larval size, on the contrary the specific activity decreases with age, not because the enzymatic activity decrease but because there are an increase in tissue proteins (Zambonino-Infante and Cahu, 2001).
The Species
European aquaculture is developing very fast, and in Mediterranean countries is supported mainly by gilthead seabream (Sparus aurata) and sea bass (Dicentrarchus
labrax) (Aquamedia). Since production of these species has increased, prices are
decreasing and industry profits had been severely reduced. For this reason D. sargus cultivation assumed a great importance, as new candidate to extend the range of cultivated species (Cara et al., 2003) and assumes a great role in Mediterranean aquaculture because of its high value, demand and easy adaptation to captivity (Sá et al., 2006). Its high potential is partly due to the decrease of more than 50%, in catches, between 1987 and 2004 in the southern of Portugal (D’Anna et al., 2004, Santos et al., 2006).
As the methods of cultivation from gilthead seabream are similar to the ones that can be used with white seabream they were adopted. Although gilthead and white seabream presented a similar growth, white seabream fingerlings grows faster but in later stages the growth rate decrease considerably, compared with gilthead seabream (Sá et al., 2006).
White seabream farming exhibits still several bottlenecks, such as the lack of information on nutritional requirements and consequently the difficulty on formulating the ideal diet for an optimal growth hinder the farming of this species (Sá et al., 2006). One of the main problems is the persistence of skeletal deformities (Saavedra et al., 2006) which is probably a consequence of a non adequate food.
The essential steps of organogenesis are similar in all teleost fish (Sánchez-Amaya et al, 2007). Sarasquete et al. (1995) studied the larval ontogeny of gilthead seabream, a sparidae fish. At 3 DAH (days after hatching), when gilthead seabream first feed it has the mouth and anus opened, pancreas, liver and a digestive tract differentiated in three portions: foregut including the oesophagus and a primordial stomach, the midgut (anterior intestine) and the hindgut (posterior intestine). Between 4 and 6 DAH the pyloric sphincter and intestinal valves appear. At 5 DAH larvae had lipid vacuoles in the enterocytes of midgut. Around 6-7 DAH acidophilic supranuclear inclusions become visible in the epithelial cells of the hindgut. Gastric glands were not observed in the first 30 days of life of gilthead seabream.
Some researchers pointed out that at early stages this species is omnivorous, eating both algae and small larvae, changing to carnivorous feeding behaviour at an adult stage, when it begins to eat bivalves and others molluscs (Sá et al., 2006). Nonetheless it is suggested that D. sargus is omnivorous, having an opportunistic behaviour (Ozorio et al., 2006). More specifically, white seabream is a diurnal omnivorous that have a diet dominated by algae and benthic invertebrates. They eat mostly algae, and also echinodermata, mainly composed by the sea urchin Arbacia
lixula, Sphaerechinus granularis and Paracentrotus lividus. The third group more eaten is Barnacles especially from the family Verrucidae. Worms are frequently eaten too and Gastropods mainly from the sub-classe Prosobranchia, including Patella sp.,
Ocinebrina aciculate, Jujubinus pseudogravinae and Bittium sp, are an important
group. At lower levels they predate fish eggs, amphipods, gastropods, fish, tunicates, decapods, bivalves and others invertebrates (Figueiredo et al., 2005).
In wild, white seabream usually live in the rocky infralittoral fish assemblage (D’Anna et al., 2004). Rocky habitats have shown to give a better environment, giving more food and protection against predation, allowing fish to become twofold fatter when compared with sandy ones (Ozorio et al., 2006).
Solea senegalensis (Kaup, 1858) / Senegalese sole
Since the 1990´s sole has been considered a promising specie for aquaculture in Europe (Conceição et al., 2007), because of its high price, high demand and decline in fisheries. It is a common fish species in Mediterranean and southern Atlantic waters, well adapted to warm climates, normaly exploited in southern Europe and are highly economical (Cañavate & Fernández-Díaz, 1999; Dinis et al., 1999).
Sole is a gonochoric species, with the females maturing at age 3+ when the total length is 32 cm, spawning in spring, between March-June. In captivity these species have natural spawning, stopping the egg emission below 16 ºC (Dinis et al., 1999). Adult fish can be infected by the ectoparasite Hemibdella solea and have outbreaks of pasteurellosis or pseudotuberculosis (Dinis et al., 1999).
Sole postlarvae suffers a drastic metamorphosis some days after hatching, that starts on 11 DAH and is completed by 19 DAH, settling in the bottom of the rearing tanks (Dinis et al., 1999). Sole presents a peculiar mode of ingestion, being not an active predator, waits that feed sinks and eat in the bottom of tanks, grazing continuously on Artemia sp. (Engrola et al., 2007). Sole can be successfully first feed with Artemia nauplii or rotifers being the last one the prey most used (Dinis et al., 1999).
Besides the complex metamorphosis sole as other problems of cultivation such as difficulties in weaning, occasional problems of malpigmentation, high incidence of skeletal deformities and morphological malformations related with the migration of the eye (Dinis et al., 1999; Conceição et al., 2007). Juveniles can suffer for example from epizootic mortalities due to pasteurellosis cause by the presence of Photobacterium
damsela subsp. piscicida (Dinis et al., 1999).
Major morphological changes were observed within the first 2 days of sole life. At 2 DAH, when sole first feed it has the mouth and anus opened, pancreas, liver and the
digestive tract is differentiated in five portions: buccal-pharyngeal cavity, oesophagus, incipient stomach, anterior and posterior intestine. At the same age in the anterior portion of intestine it can be observed a brush border which is a more basophilic cytoplasm with several apical vesicles and dense granules. The thickness of the brush border can be observed with larval growth. Around 16 DAH when larvae start to lose symmetry the anterior intestine delineates the lower part of the abdominal cavity and posterior intestine delineated the posterior part of the cavity. Around 27 DAH gastric glands are seen for the first time (Ribeiro et al., 1999b).
In the wild the feeding regime is based in majority in polychaetes (Hediste
diversicolor) and in less quantities amphipods, copepods and isopods (Dinis et al.,
1999; Sá et al., 2003). Objectives of this study
The present study aimed to study the influence of inert diets on the digestive capacity of fish larvae.
In the case of Diplodus sargus two sub-objectives were defined, first to study the pattern of digestive enzymes during larval development, and secondly to analyse the effect of an early weaning on larval digestive capacity.
Regarding Solea senegalensis it was aimed to study different weaning strategies, namely sudden weaning and co-feeding, on sole digestive capacity.
2. Materials and methods
2.1 Larval rearing conditions
Larval rearing was carried out at Estação Piloto de Piscicultura de Olhão (EPPO) from INRB (Instituto Nacional dos Recursos Biológicos) I.P. (Instituto público) –IPIMAR for both fish species, in 300 L cylindrical round bottom tanks maintained in a semi-closed circuit, in a temperature controlled room.
2.1.2 Broodstock and egg incubation
D. sargus
White seabream broodstock composed of 30 fishes with an average weight and length of 999.5 g and 37.5 cm respectively, were captured from the wild and stocked in 10.6 m3 tanks. Broodstock were kept at a density of 2.8 kg/m3 and a biomass of 29.9 kg. Fish were fed daily with squid(Illex spp.) and inert diet “RodoSoja® Ultra Energia, (Sorgal®”, Portugal) with a size of 8 to 10 mm. They were submitted to a 9h light: 15h dark photoperiod and water temperature was kept at 18 ± 1 ºC, during the spawning season.
Eggs were obtained from natural spawning and immediately collected in an egg-collector. Eggs were transferred to a glass beacker to separated, viable buoyant eggs from the dead sinking eggs. The spawn weighted 332 g and exhibited a hatching percentage of 26%.
Eggs were incubated in 220 l incubators with a maximum density of 1800 eggs L -1 with a seawater flow of 6 L h-1 and a temperature of 18 ± 1 ºC. Oxygen saturation was always close to saturation (100%) and salinity was maintained at 35 ‰.
S. senegalensis
Senegalese sole broodstock was composed by 45 fishes with an average weight and length of 1500 g and 50 cm respectively, these fishes were captured from the wild and stocked in 18 m3 tank with a seawater supply of 20 L min-1. Broodstock were kept at a density of 3.75 kg /m2and a biomass of 67.5 kg. Fish were fed daily with semi-dry diet Alpis® for broodstock. They were subjected to natural photoperiod and water temperature was kept at 13-19 ºC.
Eggs were obtained from natural spawning and immediately collected in an egg-collector. Eggs were transferred to a glass beacker to separated, viable buoyant eggs
from the dead sinking eggs. The spawn weighted 223 g and exhibited a hatching percentage of 90%.
Eggs were incubated in 220 l incubators with a maximum density of 1100 eggs L -1 with a seawater flow of 6 L h-1 and a temperature of 18 ± 1 ºC. Oxygen saturation was always close to saturation (100%) and salinity was maintained at 35 ‰.
2.1.3 Larval rearing
D. sargus
At 2 DAH white seabream larvae were transferred to a semi-closed sea water system, in 300 L cylindrical round bottom tanks at a density of 80 individuals L-1. On a daily basis, tanks were cleaned, dead larvae collected and water temperature, dissolved oxygen and salinity were monitored. During the rearing period temperature varied between 17.5-19.7 ºC, oxygen between 6.5-9.2 ppm and salinity between 34-36 ‰. During the first 7 days after hatching (DAH) the water flow was 0.4 L min-1, afterwards the flow was increased with larvae age reaching 2 L min-1 by the end of the experiment. Water flow out the tanks by draining through an 80 µm mesh size during the day and a 150 µm mesh size during the night. When larvae were bigger a 500 µm mesh size was used during 24 h. The different mesh sizes were needed due to the different size of the live prey offered to larvae, thus avoiding that prey pass through the mesh before the larvae eat them. Before re-entering in the tanks water had pass through a mechanical filter to remove solid particles, a biological filter which removed solid particles too, and a UV light filter for disinfection. Photoperiod was 14 h light and 10 h dark during all the rearing period.
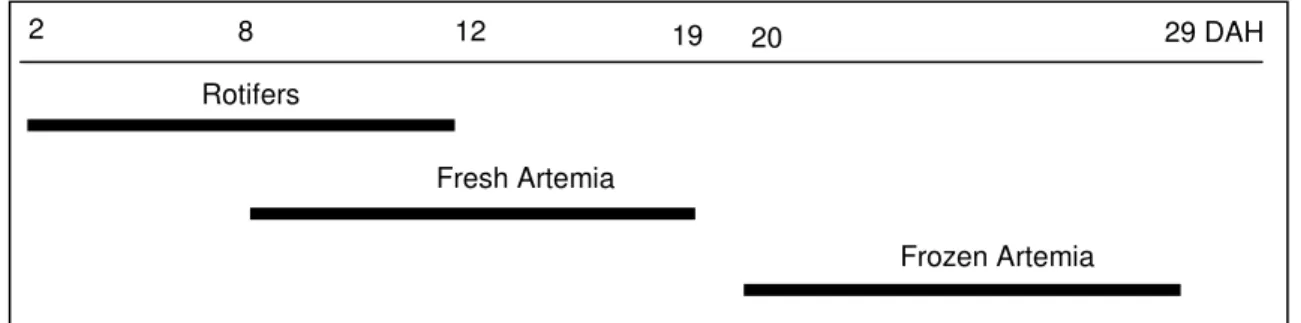
Fish larvae were fed rotifers (Brachionussp) enriched with Protein Selco® from 4 DAH until 26 DAH, at a quantity that varied between 6,000,000 and 600,000 individuals per tank respectively at the first and last days. Nannochloropsis oculata and Isochrysis
galbana, at a quantity of 300,000 cells L-1, were used as green-water technique during
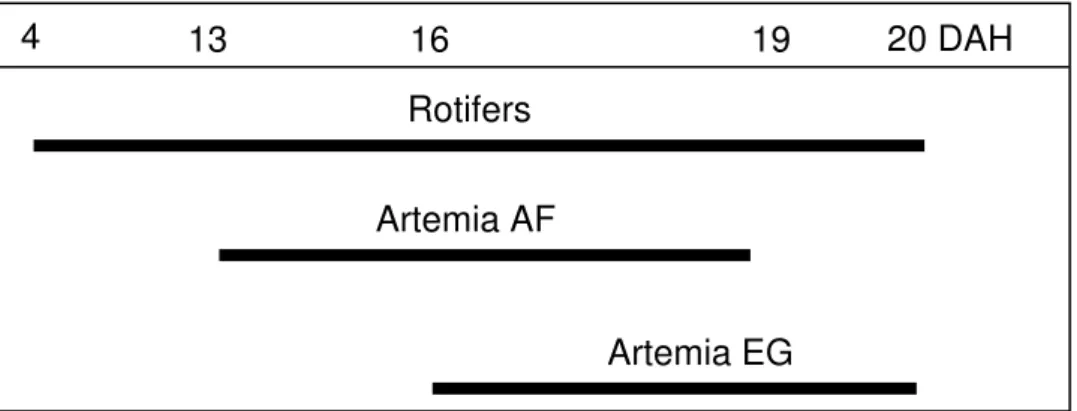
the period larval fish were fed with rotifers. Fish larvae were fed Artemia sp AF (“Artemia franciscana grade”) nauplii between 13 and 19 DAH, respectively with 4,500 and 75,000 individuals per tank. The amount of nauplii was low in the first days to allow larvae to adapt to the new kind of feed. This amount increased until Artemia sp AF was replaced by Artemia sp EG (“Artemia sp enrichment grade”). At 16 DAH larvae begun to be fed with Artemia sp EG metanauplii in a quantity that varied between 60,000 and 2,400 individuals per tank respectively at the first and last days of feeding with metanauplii. Both artemia were enriched with Rich Advanced®.
White seabream larvae feeding plan, before the beginning of treatments is presented in Fig. 1.
Fig. 1 – White seabream larvae feeding plan, before the beginning of treatments.
S. senegalensis
At 2 DAH sole larvae were transferred to a semi-closed sea water system, in 300 L cylindrical round bottom tanks at a density of 40 individuals L-1. On a daily basis, tanks were cleaned, dead larvae collected and water temperature, dissolved oxygen and salinity were monitored. During the rearing period temperature were kept at 20 ± 1 ºC, oxygen between 70-100 % and salinity between 36-39 ‰. Water flow during the experiment was kept at 0.8 L min-1. Water replacement (flow out and flow in) was done as reported previously for D. sargus. Photoperiod was 16 h light and 8 h dark during all the rearing period.
Fish larvae were fed rotifers (Brachionus sp) enriched with microalgae (Nannochloropsis oculata) from 2 DAH until 12 DAH, at a quantity that varied between 4,500,000 and 1,500,000 individuals per tank respectively at the first and last days.
Nannochloropsis oculata at a density of 300,000 cells L-1 was used as green-water
technique during the period larval fish were fed with rotifers. Fish larvae were fed with
Artemia sp EG metanauplii between 8 and 29 DAH, at a quantity that varied between
150,000 and 900,000 individuals mL-1. The amount of metanauplii was low in the first days to allow larvae to adapt to the new kind of feed. Artemia was enriched with microalgae such as rotifers. From 8 to 19 DAH metanauplii were given alive, whereas from 20 to 29 DAH it was given frozen.
Sole larvae feeding plan, before the beginning of treatments is presented in Fig. 2.
Artemia EG
4 13 16 19 20 DAH
Rotifers Artemia AF
Fig. 2 – Sole larvae feeding plan, before the beginning of treatments.
2.1.3.1 Experimental design
D. sargus
The objective of the white seabream experiment was to analyse the effect of early weaning on digestive capacity of larvae. Therefore in treatment W20 inert diet was introduced when fish larvae were 20 DAH whereas in treatment W27 inert diet was introduced at 27 DAH. Weaning was realised in a co-feeding regime with live feed for 6 days. Fish were cultivated until 3 weeks after inert diet introduction in the feeding regime.
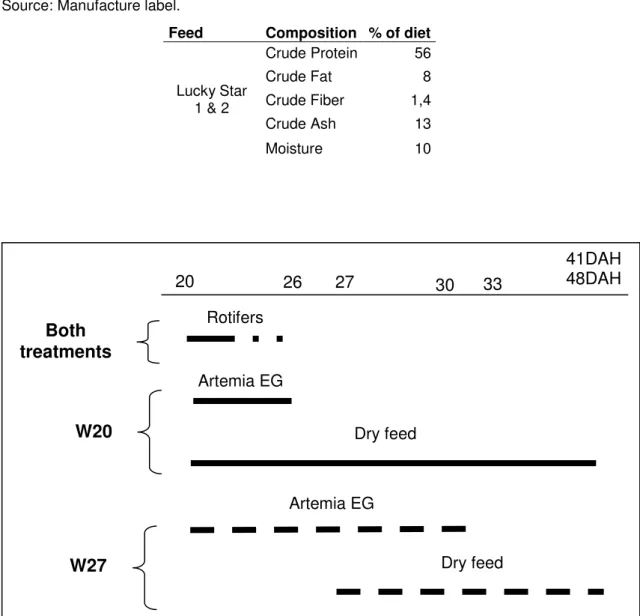
In treatment W20 larvae were co-fed with inert diet, rotifers and Artemia EG which densities decreased into zero by the end of the co-feeding period. There were used 3 types of inert diet, Nippai – Ambrose 100® which was given from 20 DAH until 26 DAH, Lucky Star® 1 given from 24 DAH until 41 DAH and Lucky Star® 2 given from 28 DAH until the end of the experiment.
In treatment W27 when larvae started eating inert diet the period of feeding with rotifers was ended, so larvae were co-fed only with inert diet and Artemia EG whose density in the period of co-feeding with inert diet was reduced until stopped. There were used 3 types of inert diet, Nippai – Ambrose 100® which was given from 27 DAH until 29 DAH, Lucky Star® 1 given from 28 DAH until 44 DAH and Lucky Star® 2 given from 30 DAH until the end of the experiment.
Composition, ingredients and size of the food particle of the Lucky Star is presented in table 1.
Larva feeding plan for both treatments was summarized in Fig. 3.
2 8 12 19 20 29 DAH
Rotifers
Fresh Artemia
Table 1 – Composition of inert diet given to larvae. The ingredients of the feed are: fish meal, squid meal, cereal, krill meal, yeast, vitamin and minerals. Lucky star 1 feed particle size has 100~200 microns and Lucky star 2 has 200~400 microns.
Source: Manufacture label.
Feed Composition % of diet
Crude Protein 56 Crude Fat 8 Crude Fiber 1,4 Crude Ash 13 Lucky Star 1 & 2 Moisture 10
Fig. 3 – White bream larvae feeding plan: Both treatments (semi-dashed line); Treatment W20 (solid line); Treatment W27 (dashed line).
S. senegalensis
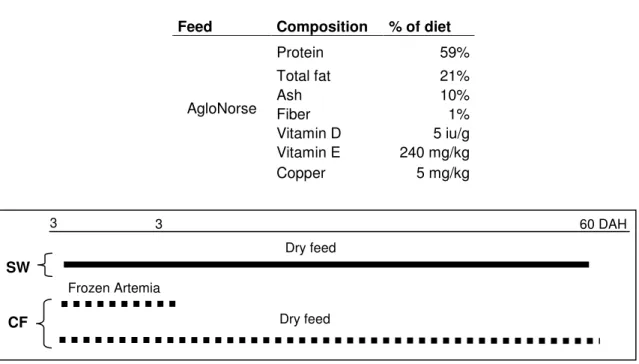
The objective of sole experiment was to analyse the effect of two strategies of weaning on digestive capacity, the sudden weaning and co-feeding. Therefore in fish post larvae from Treatment CF diet was introduced at 30 DAH in a co-feeding regime until 34 DAH, whereas in post larvae from Treatment SW diet was introduced at 30 DAH suddenly.
Fish larvae were counted and distributed by six tanks, 3 for each treatment. 1550 individuals were distributed by each experimental tank at the start of experiment. Tanks
Artemia EG 20 41DAH 48DAH 27 Rotifers Dry feed 30 26 Artemia EG Dry feed W20 W27 33 Both treatments
were similar to the larval rearing tanks and water conditions were the same as reported earlier.
Fish were fed with AgloNorse® that was given in both treatments until visual satiety. Composition per kg of feed, ingredients and size of the food particle of the inert diet is presented in table 2.
Post larva feeding plan for both treatments was summarized in Fig. 4.
Table 2 – Composition per kg of feed of the inert diet given to post larvae. The ingredients of the feed are: fish meal, fish oil, vegetable oil, carbohydrate, mineral and vitamins. AgloNorse feed particle size has 100~200 microns.
Source: Manufacture label.
Feed Composition % of diet
Protein 59% Total fat 21% Ash 10% Fiber 1% Vitamin D 5 iu/g Vitamin E 240 mg/kg AgloNorse Copper 5 mg/kg
Fig. 4 – Sole larvae feeding plan: Treatment SW (solid line); Treatment CF (dashed line).
2.1.4 Sampling
Sampling was always done before feed distribution.
Larvae for enzymatic analysis were washed with distilled water and frozen in liquid nitrogen (-196 ºC).
Larvae for weight measurement were used first for length measurement and then rinsed with 3 % ammonium formiate and distilled water and then frozen in liquid nitrogen.
At the end of the experiment, larval survival was determined by counting larvae remaining in the tanks.
3 3 60 DAH Dry feed Frozen Artemia Dry feed SW CF
D. sargus
In order to measure growth in length and weight, 4 groups of 5 larvae were sampled randomly from the 6 tanks in days 0, 2, 9, 13 and 20 DAH. For the same measurements 10 larvae from each tank were sampled randomly and individually in days 27, 34, 41 DAH for both treatments and in 48 DAH only for treatment W27, because the objective was to evaluate growth during the next 3 weeks after the beginning of ingestion of inert diet.
For enzymatic analysis groups of 120 larvae were collected in 0 and 2 DAH, before they were stocked in the rearing tanks. At 9, 13 and 20 DAH 75 larvae were collected. Fish larvae were sampled for each treatment at the introduction of the inert diet and 1 and 3 weeks after. So at 27 DAH 100 larvae were collected and in the posterior ages were collected only 50 larvae.
S. senegalensis
In order to measure growth in length and weight, 24 larvae were sampled at 30 DAH before the beginning of the treatments, after this age 10 larvae were sampled randomly from all tanks in days 35, 40, 45, 50, 55 and 60 DAH.
For enzymatic analysis 3 groups of 60 larvae were collected in 30 DAH before the redistribution by the twelve tanks. At 35 and 40 DAH 80 larvae were collected from each tank, and 60 larvae at 50 and 60 DAH.
2.2 Biometric analytical measurement
Larval length was measured using a binocular microscope with a micrometric eyepiece with a precision of ± 0.05 mm. Length was measured from the tip of the snout to the end of the caudal fin (total length).
Weight was determined on fish larvae freeze-dried for 24 h and then weighted in a high precision balance Sartorius microbalance (1 ± 0.001 mg).
Relative growth rate was calculated by using the formula: RGR (%) = [exp((ln final weight - ln initial weight)/(final day-initial day))-1*100] (Ricker 1958).
2.3 Enzymatic analysis 2.3.1 Fish larvae dissection
D. sargus
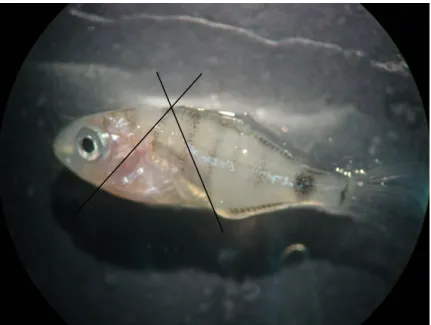
Whole body homogenates were used for enzymatic analysis in larvae younger than 20 DAH due to the small size of larvae. After this age, older larvae were dissected to obtain the abdominal cavity. In Fig. 5 is shown the dissection cut lines to obtain the abdominal cavity.
Larvae were slightly defrost to allow individualization and dissected on a glass maintained on ice (0 ºC) to preserve enzymes activity. The portion obtained was weighted in a balance (Precisa 100A-300M (1 ± 0.00001 g)) to calculate the homogenization volume.
Fig. 5 – Lines indicate dissection cut zones to obtain the abdominal cavity in D. Sargus.
S. senegalensis
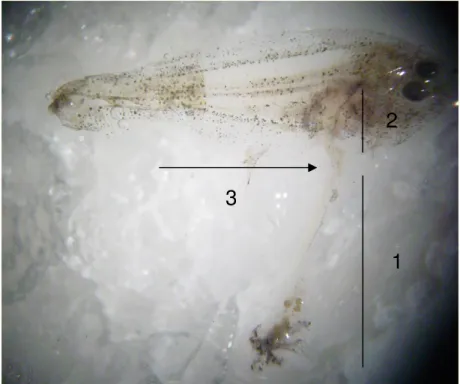
Larvae with 30, 35 and 40 DAH were dissected to obtain the abdominal cavity. Larvae with 50 and 60 DAH were dissected to obtain the pancreatic and intestinal segment. Digestive tracts were cut at the junction of the oesophagus and at the pyloric sphincter to obtain the pancreatic segment including pancreas, stomach and liver, and intestinal segment (Ribeiro et al., 2002). In Fig. 6 is shown the pancreatic and intestinal segment and the area of cut. Larvae were slightly defrost to allow individualization and dissected on a glass maintained on ice (0 ºC) to preserve enzymes activity. The portions obtained were weighted in a balance (Precisa 100A-300M (1 ± 0.00001 g)) to calculate the homogenization volume.
Fig. 6 – Different larvae segments: 1- Intestinal segment; 2- Pancreatic segment; 3- Cut zone to individualize intestinal from pancreatic segment.
D. sargus and S. senegalensis
The pancreatic segment (S. senegalensis) and whole larval body (D. sargus) were homogenized in 15 volumes (w/v) of ice cold distilled water for periods of 2 х 30 seconds. Samples were centrifuged at 3300g at 4 ºC for 3 minutes, and supernatant was sonicated for 10 seconds. For the purification of the brush border segments were homogenized in 30 volumes (w/v) of ice cold Manitol-Tris during 2 х 30 seconds. Afterwards a volume of this homogenate was used for brush border purification whereas the other volume of intestinal homogenate was submitted to the method previously described for pancreas. To the homogenate volume used for brush border purification a certain volume of CaCl2 (0,1M) was added to obtain 10 mM, in order to preserve membrane stability. Samples were then centrifuged at 9000g at 4 ºC for 10 minutes, and the supernatant was centrifuged at 34000g at 4 ºC for 20 minutes. The supernatant was discarded and the precipitated ressuspended with DTT (1mM).
1
2
3
2.3.2 Enzymatic assays
Table 3 – Enzymes assayed and in which species and segment were assayed.
Enzyme Detection site Species
Trypsin pancreas, intestine S. senegalensis, D. sargus
Amylase pancreas, intestine S. senegalensis, D. sargus
Pepsin pancreas S. senegalensis, D. sargus
Lipase pancreas, intestine D. sargus
Aminopeptidase intestine, brush border S. senegalensis, D. sargus
Alkaline phosphatase intestine, brush border S. senegalensis, D. sargus
Acid phosphatase intestine D. sargus
Leucine-alanine peptidase intestine S. senegalensis, D. sargus
2.3.2.1 Trypsin analysis
Trypsin activity determination was based on the study by Holm et al. 1988. In a cuvette, 1000 µl of buffer trizma-CaCl2 (20 mM) pH 8.2, 10 µl of Bapna 0.1 M (Nα-Benzoyl-DL-arginine-p-nitroanilide) and 50 µl of homogenate were mixed. All processes were performed at 25 ºC. The reaction was read in a spectrophotometer at 407 nm.
2.3.2.2 Aminopeptidase analysis
Aminopeptidase activity determination was based on the study by Maroux et al. 1973. In a cuvette 2.47 ml of buffer phosphate (80 mM), 50 µl of the substrate L-leucine p-nitroanilide (0.1 M) and 50 µl of the homogenate were mixed. All processes were performed at 37 ºC. The reaction was read in a spectrophotometer at 410 nm.
2.3.2.3 Amylase analysis
Amylase activity was measured using starch as the substrate (Métais & Bieth, 1968). In a reaction tube 100 µl of starch solution (0.07 M) and 50 µl of the homogenate were incubated in a water bath at 37 ºC during 30 minutes. At the end of this period 20 µl of HCl 1M was added to stop the reaction. Then to the reaction tube were added 400 µl of distilled water and 2 ml of iodine solution. A similar procedure was carried out for the blank tube except that the 50 µl of the homogenate was added only after the reaction was stopped with HCl. The colour developed in these tubes was read against the iodine solution at 580 nm.
2.3.2.4 Alkaline phosphatase analysis
Alkaline phosphatase determination was based on the study by Bessey et al. 1946. In a cuvette, 2.53 ml of a substrate pNPP 5 mM (p-nitrophenylphosphate) dissolved in a solution of carbonate buffer (30 mM) and 50 µl of homogenate were mixed. All processes were performed at 37 ºC. The reaction was read in a spectrophotometer at 407 nm.
2.3.2.5 Pepsin analysis
Pepsin activity was measured using haemoglobin 2.5%, pH 2 as the substrate (Anson, 1938). The substrate was prepared with haemoglobin, water and HCl 1M. In a reaction tube 500 µl of substrate was incubated in a water bath at 37 ºC during 5 minutes. At the end of this period 100 µl of homogenate was added and incubated again during 20 minutes. At the end of this period 1000 µl of TCA 5 % was added to stop the reaction. After stopping the reaction the tube was again incubated during 5 minutes. A similar procedure was carried out for the blank tube except that the 100 µl of the homogenate were added only after the reaction was stopped with TCA. The reaction and blank tube were centrifuged at 4000 g, 4 ºC during 6 minutes, and read immediately at 280 nm against deionised water.
2.3.2.6 Lipase analysis
The activity was measured using p-nitrophenyl myristate as a substrate based on the study by Iijima et al., 1998. The substrate was prepared using Tris-HCl buffer (0.25 M, pH 9), 2-methoxyethanol (0.25 mM), p-nitrophenyl myristate (0.53 mM) and sodium cholate (5 mM). Reaction was stopped using a solution of acetone and n-heptane (1:1). In a reaction tube 500 µl of substrate and 10 µl of homogenate were incubated at 30 ºC during 15 minutes. At the end of this period 700 µl of a stop solution was added to stop the reaction. A similar procedure was carried out for the blank tube except that the 10 µl of the homogenate was added only after the reaction was stopped with the stop solution.
Before reading at 405 nm in a spectrophotometer the blank and reaction tubes were centrifuged at 6080 g, 4 ºC during 2 minutes. The blank and reaction were read against a zero solution that was prepared like the blank but instead of homogenate in the end was added 10 µl of distilled water.
2.3.2.7 Intestinal peptidases analysis
Intestinal peptidase, leucine-alanine peptidase, determination was based on the study by Nicholson & Kim (1975) using leucine-alanine 0.01 M as substrate. The
reaction tube with homogenate was done with 0.5 ml of substrate, 1 ml of LAOR (L-amino oxidase, horseradish peroxidase, o-dianisine and was dissolved in a Tris-HCl 50 mM buffer), 5 minutes in a bath at 37 ºC, 25 µl of homogenate, 20 minutes bath and the reaction was stopped with sulphuric acid. The blank sample tube was made in the same way but instead of adding substrate was added 0.5 ml of Tris-HCl buffer. The blank substrate tube was made the same way as the reaction tube but instead of homogenate 25 µl of water was added. The blank zero was made with only Tris-HCl buffer, LAOR and sulphuric acid to stop the reaction. A standard curve using leucine (0.01 M) was done to determine this enzyme activity. All tubes were read at 530 nm in the spectrophotometer against the blank zero.
2.3.2.8 Acid phosphatase analysis
Acid phosphatase determination was based on the study by Terra et al. 1979. In a cuvette, 2.5 ml of a substrate pNPP 5.5 mM (p-nitrophenylphosphate) made in a solution of citrate buffer 0.1 M (citric acid and sodium citrate) and 50 µl of homogenate were mixed. All processes were performed at 37 ºC. The reaction was read in a spectrophotometer at 405 nm during 5 minutes.
2.3.2.9 Protein analysis
Protein was quantified using the Bradford method (Bradford, 1976) for the pancreatic, intestinal homogenate and brush border homogenate. Depending on the tissue analysed a variable amount of homogenate was mix with the Bradford solution (coumassie blue, ethanol, orthophosphoric acid and distilled water) for 2 minutes and read in a spectrophotometer at 595 nm.
2.3.2.10 Enzyme activity expression
Enzyme activities were calculated as micromoles of substrate hydrolysed per minute (i.e., U) at 37 ºC for alkaline phosphatase, aminopeptidase and leucine-alanine, and 25 ºC for trypsin. Amylase activity was expressed as the equivalent enzyme activity which was required to hydrolyse 1 mg of starch in 30 minutes at 37 ºC. Pepsin activity was expressed as specific activity with 1 U representing 1 mM equivalent of tyrosine liberated per minute per mg of protein at 37 ºC. One unit of lipase activity was defined as 1 mmoL of p-nitrophenol released per minute at 30 ºC.
Enzyme activities were expressed as specific activities, i.e., U/mg protein or mU/mg protein, and as segmental activities, i.e., total activity per larvae segment.
As larvae (D. sargus) from the different treatments had inert diet introduced at different ages it was determined the relative increase using the formula: RI = final total activity (week 1 and 3) / initial total activity (week 0).
Secretion of pancreatic enzymes, trypsin and amylase, was calculated as the ratio of the total activity in the intestinal segment, over the sum of total activity in pancreas and intestine for each enzyme (Zambonino-Infante and Cahu 1999).
The enterocyte maturation index was determined as the ratio between brush border enzyme total activity (alkaline phosphatase, aminopeptidase) and leucine-alanine peptidase total activity (Zambonino-Infante et al., 1997).
2.4 Data analysis
All data of dry weight (mg), total length (mm), specific activity and total activity of digestive enzymes were expressed as means ± standard deviation (SD) of treatment replicates.
Homogeneity of variance was verified using Bartlett’s test. Enzymatic activity data between ages were compared by one-way ANOVA, both for S. senegalensis and for D.
sargus, being followed by Tukey-Kramer Multiple comparison test, when significant
differences were found at the α= 0.05 level (GraphPad InStat 3 (GraphPad software, California, U.S.A.)).
Enzymatic activity data both for S. senegalensis and D. sargus treatments were compared by Unpaired t test. Differences were considered significant when P < 0.05 (GraphPad InStat 3 (GraphPad software, California, U.S.A.)).
Data for S. senegalensis were separately compared between 30 and 40 DAH and at 50 and 60 DAH. Similarly data for D. sargus were separately compared between 0 and 20 DAH and between treatments.
Ontogenesis 0-2 DAH 2-9 DAH 9-13 DAH 13-20 DAH 29,08 18,93 16,13 20,29 0,0 1,0 2,0 3,0 4,0 5,0 6,0 7,0 8,0 9,0 0 2 9 13 20
Age (days after hatching)
L en g th ( m m )) )) 0,000 0,050 0,100 0,150 0,200 0,250 0,300 0,350 0,400 0,450 W ei g h t (m g )) )) Length (mm) Weight (mg) 3. Results
3.1 Growth and survival
D. sargus
Ontogenetic development
Two periods of growth could be identified during white seabream development (Fig. 7). A first period with a smooth increase until 9 DAH, and after this a more pronounced growth specially in term of weight.
The relative growth rate (Table 4), presented an overall increase during larval development, except between 2 and 9 DAH where larvae presented the lower growth rate.
Fig. 7 – Growth of Diplodus sargus larvae: total length (solid line); dry weight (dashed line). Values are presented as means ± standard deviation (n = 20).
Table 4 – Relative Growth Rate (RGR) (% day-1) during ontogenetic development of Diplodus
sargus, using dry weight.
Growth after weaning
Growth was slightly higher in larvae from W27 treatment being both length (Fig. 8) and weight (Fig. 9) statistically superior at 34 and 41 DAH.
0,0 5,0 10,0 15,0 20,0 25,0 20 27 34 41 48
Age (days after hatching)
L en g th ( m m )) )) W20 W27 a b a b W20 W27 0,0 2,0 4,0 6,0 8,0 10,0 12,0 14,0 16,0 18,0 20 27 34 41 48
Age (days after hatching)
W ei g h t (m g )) )) W20 W27 a b a b W20 W27
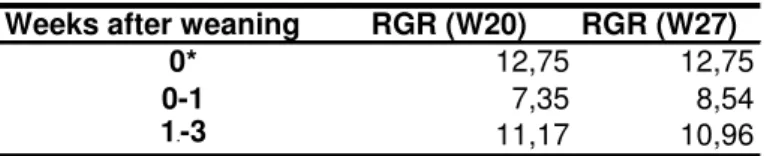
In terms of relative growth rate (Table 5), at week 0-1 larvae from W27 treatment presented a higher RGR, while at week 1-3 larvae from W20 treatment had a higher RGR.
Survival rate was calculated as 3.3% in W20 treatment and 3.8% in W27.
Fig. 8 – Total length growth of Dipodus sargus larvae under the W20 and W27 treatments. Values are presented as means ± standard deviation (n = 30). Different superscripts indicate significant differences between means. Arrows indicate the day of weaning for each treatment.
Fig. 9 – Dry weight growth of Diplodus sargus larvae under the W20 and W27 treatments. Values are presented as means ± standard deviation (n = 30). Different superscripts indicate significant differences between means. Arrows indicate the day of weaning for each treatment. Table 5 – Relative Growth Rate (RGR) (% day-1) after weaning of Diplodus sargus, using dry
0,0 1,0 2,0 3,0 4,0 5,0 6,0 7,0 8,0 9,0 10,0 35 40 45 50 55 60
Age (days after hatching)
L en g th ( m m )) ) CF SW a b
Weeks after weaning RGR (W20) RGR (W27)
0* 12,75 12,75
0-1 7,35 8,54
1.-3 11,17 10,96
* To calculate RGR in the week of inert diet introduction was used the age before weaning and the age at weaning.
S. senegalensis
Sole post larvae length (Fig. 10) was more or less constant, throughout the experiment in both experiments. Length of post larvae from treatment SW at 60 DAH was 1.1 times higher than post larvae from CF treatment.
Sole post larvae dry weight (Fig. 11) exhibited more dispersion than length. In fact post larvae from SW treatment had a significantly higher weight at 40 and 60 DAH than post larvae from CF treatment, while at 45 DAH an opposite pattern was observed.
Relative growth rate exhibited fluctuations during post larvae development presenting periods where fish did not growth. Fish post larvae from CF treatment exhibited the higher growth rate between 40-45 DAH and post larvae from SW treatment between 50-55 DAH. The RGR during the experimental period (30-60 DAH) was higher in post larvae from SW treatment than in post larvae from CF treatment.
Survival rate was calculated as 22% in treatment CF and 25% in SW.
Fig. 10 – Total length growth of Solea senegalensis post larvae under the CF (co-feeding) and SW (sudden weaning) treatments. Values are presented as means ± standard deviation (n = 30). Different superscripts indicate significant differences between means.
0,0 0,5 1,0 1,5 2,0 2,5 3,0 3,5 4,0 4,5 5,0 30 35 40 45 50 55 60
Age (days after hatching)
W ei g h t (m g )) ) CF SW a a a b b b
Growth period (DAH) CF SW 30-40 -2,53 -1,22 40-45 7,62 -0,95 45-50 0,38 2,49 50-55 5,03 8,87 55-60 -4,30 2,32 30-60 0,52 1,65
Relative Growth Rate (RGR)
Fig. 11 – Dry weight growth of Solea senegalensis post larvae under the CF (co-feeding) and SW (sudden weaning) treatments. Values are presented as means ± standard deviation (n = 30). Different superscripts indicate significant differences between means.
Table 6 – Relative Growth Rate (RGR) (% day-1) in the different growth periods, using dry weight.
3.2 Enzymatic activity
D. sargus
Enzymatic ontogenetic development
Trypsin and amylase (Fig. 12) were detected at hatching. Trypsin specific activity exhibited a slight decreased in its activity until 9 DAH, followed by an increase until 20 DAH. Trypsin specific activity at 13 and 20 DAH was more than 2 times higher than at earlier ages.
Amylase specific activity exhibited a slight increase at 2 DAH followed by a slightly decrease at 9 DAH to a value that was maintained rather stable until 20 DAH.
Pepsin activity (Fig. 12) was detected at hatching being the highest level of activity observed when compared with the other ages analysed. At 2 DAH the activity was not detected increasing after this age until 20 DAH.
Lipase activity (Fig. 12) was only detected at 9 DAH followed by a slight increase until 13 DAH to a value that was maintained until 20 DAH.
Alkaline phosphatase, aminopeptidase and acid phosphatase (Fig. 12) were detected as early as hatching.
Alkaline phosphatase specific activity of white seabream fish larvae, increased until 20 DAH. Except for 9 and 13 DAH all other ages differ significantly from each other.
Aminopeptidase specific activity kept a more or less constant level of activity until 9 DAH, increasing afterwards until 20 DAH, presenting a value 2.25 times higher than at 0, 2 and 9 DAH.
Acid phosphatase specific activity, kept the level of activity relatively constant until 9 DAH, after this age the level of activity increased until 20 DAH. Acid phosphatase specific activity of fish aged 13 and 20 DAH differ significantly from other ages and from each other.
Leucine-alanine specific activity (Fig. 12) was only detected at 9 DAH and increased significantly at 13 DAH, keeping a constant level until 20 DAH. The specific activity at 9 DAH is 2.2 times lower than at 13 and 20 DAH.
Trypsin 0 20 40 60 80 100 120 0 2 9 13 20 m U /m g p ro te in in a b b a a Pepsin 0,0E+00 1,0E-05 2,0E-05 3,0E-05 4,0E-05 5,0E-05 6,0E-05 7,0E-05 0 2 9 13 20 m U /m g p ro te in in Amylase 0 0,5 1 1,5 2 2,5 3 3,5 4 0 2 9 13 20 U /m g p ro te in in Lipase 0 0,2 0,4 0,6 0,8 1 1,2 1,4 1,6 0 2 9 13 20 U /m g p ro te in n Alkaline phosphatase 0 50 100 150 200 250 300 350 0 2 9 13 20 m U /m g p ro te in in a d b c c Aminopeptidase 0 10 20 30 40 50 60 0 2 9 13 20
Age (days after hatching)
m U /m g p ro te in in a b a a ab Acid phosphatase 0 100 200 300 400 500 600 0 2 9 13 20
Age (days after hatching)
m U /m g p ro te in n n a a a b c Leucine-alanine 0 50 100 150 200 250 300 350 0 2 9 13 20 U /m g p ro te in in b b a
Fig. 12 – Specific activity of digestive enzymes during Diplodus sargus larvae development. Enzymes were assayed in whole larvae. Results are expressed as means ± SD (n=3). Different letters indicate significant differences between means.