UNIVERSIDADE DO ALGARVE
PRODUCTION OF BIOFUELS FROM
MICROALGAL BIOMASS
Henrique Miguel Mata Carvalho
Thesis to obtain the Master in Environmental Engineering
Work done under the guidance of: Prof. Doutor Luísa Paula Viola Afonso Barreira
Prof. Doutor Raúl José Jorge de Barros
II
UNIVERSIDADE DO ALGARVE
PRODUCTION OF BIOFUELS FROM
MICROALGAL BIOMASS
Henrique Miguel Mata Carvalho
Thesis to obtain the Master in Environmental Engineering
Work done under the guidance of: Prof. Doutor Luísa Paula Viola Afonso Barreira
Prof. Doutor Raúl José Jorge de Barros
III
PRODUCTION OF BIOFUELS FROM MICROALGAL
BIOMASS
Declaração de autoria de trabalho
Declaro ser o autor deste trabalho, que é original e inédito. Autores e trabalhos consultados estão devidamente citados no texto e constam da listagem de referências
incluída.
Henrique Carvalho
Copyright © Henrique Miguel Mata Carvalho. A Universidade do Algarve tem o direito, perpétuo e sem limites geográficos, de arquivar e publicitar este trabalho através de exemplares impressos reproduzidos em papel ou de forma digital, ou por qualquer outro meio conhecido ou que venha a ser inventado, de o divulgar através de repositórios científicos e de admitir a sua cópia e distribuição com objetivos educacionais ou de investigação, não comerciais, desde que seja dado crédito ao autor e editor.
IV
Agradecimentos
Esta secção de agradecimentos, não me permite agradecer, como devia, a todas as pessoas que, ao longo deste projeto me ajudaram, direta ou indiretamente, a cumprir os meus objetivos e a realizar mais esta etapa da minha formação académica.
Desta forma, deixo apenas algumas palavras, poucas, mas um sentido e profundo sentimento de reconhecido agradecimento.
À Prof.ª Luísa Barreira, ao Prof.º Raúl Barros por toda a orientação, estímulos, desafios, apoio e conhecimento transmitido durante a realização deste trabalho. E ao Prof.º João Varela por toda a ajuda e sugestões transmitidas no decorrer deste ano.
À empresa Necton, SA, e às Águas do Algarve, SA por me terem facultado a microalga estudada, os inóculos utilizados e o equipamento para medição da composição do biogás. À Vera Gomes, ao Jorge Carlier, à Ana Assunção, à Ana Constantino e à Prof.ª Maribela Pestana, por toda a ajuda e colaboração nas diferentes fases deste trabalho.
A todo o grupo MarBiotech pela colaboração, ajuda e incentivo durante todo o decorrer deste trabalho.
Aos meus amigos, que de alguma maneira me ajudaram e motivaram no decorrer desta fase da minha vida.
Em especial aos meus pais, irmão e família a quem tudo devo, por todo o apoio, paciência e compreensão que me deram ao longo do tempo.
Por último quero dedicar esta dissertação ao meu avô e à minha tia, sempre foi um sonho dela ver-me completar os estudos.
V
Abstract
With the increase in greenhouse gases (GHG) concentrations on the atmosphere, and the problems associated with it, the interest in the development of microalgae-derived biofuels has grown significantly in recent years. Microalgal biomass presents several advantages over feedstocks commonly used for the production of biofuels. However, current production costs are still too high and uncompetitive when compared to fossil fuels. In order to reduce the production costs of microalgal-based biofuels, the development of a biorefinery combining the production of different biofuels was previously proposed.
In the present work, biodiesel was synthetized from the biomass of Botryococcus braunii, and the properties of the produced biodiesel were assessed according to the European and American specifications. The defatted biomass obtained as a co-product was further upgraded by anaerobic digestion into biogas, using different consortia of bacteria. The net energy and mass balance of the biofuels produced were made, to discuss the viability of microalgal-based biodiesel production coupled with the valorisation of the spent biomass under a biorefinery concept.
B. braunii biomass had an lipid content of 14.8%, after the transesterification the yield was 46.8%, and the final biodiesel yield after purification was 30.5%. The predominant fatty acids present on the biodiesel were C16:0; C18:2n6 and C18:1. The biodiesel produced fulfilled the international specifications, except for the parameters density, viscosity and phosphorus content.
The highest yields obtain on the anaerobic digestion were under mesophilic conditions (35°C). The digestion of the defatted biomass (without lipids, 369 mL biogas/g VS) performed similar or better results than the raw biomass (333 mL biogas/g VS). The defatted biomass reached a biogas methane content of 82% and 72% for 35°C and 25°C, respectively.
The experimental results obtained at a laboratory scale were scaled up with a process simulation software (SuperPro Designer) to produce 1000 kg of biodiesel from 16.4 t of biomass, which will lead to a production of 2687 kg of methane, making an overall energy production of 48145 kWh. However, the energy spent on the process was 94341 kWh.
VI Key-words: Microalgae, Biodiesel, Biogas, Lipid extraction, Anaerobic digestion, B. braunii.
VII
Resumo
O setor energético e dos transportes são os mais poluentes a nível dos gases de efeito estufa na União Europeia representando 60 e 20%, respetivamente. O aumento dos gases de efeito estufa na atmosfera, e os problemas inerentes a estes (aumento da temperatura, secas mais frequentes e por períodos de tempo mais longos, maior pluviosidade e aumento do nível médio da água do mar e aumento da acidificação dos oceanos). A depleção dos combustíveis fósseis e a instabilidade política nos países produtores, podem levar à flutuação dos preços dos combustíveis. Todos estes problemas inerentes ao consumo dos combustíveis fósseis tem levado ao desenvolvimento de novas fontes de combustíveis. Os biocombustíveis produzidos a partir de biomassa algal têm crescido significativamente nos últimos anos. Estes apresentam várias vantagens em comparação com a matéria-prima mais utilizada para a produção de biocombustíveis (menores áreas de cultivo, menores quantidades de água utilizada e não competem com os bens alimentares primários), no entanto os custos de produção atuais ainda são elevados e não conseguem competir com os combustíveis fósseis. A fim de reduzir os custos da produção de biocombustíveis a partir de microalgas, desenvolveu-se o conceito de bio refinaria, combinando a produção de diferentes biocombustíveis, tais como biodiesel, bioetanol e biogás.
No presente trabalho, o biodiesel foi sintetizado a partir da biomassa da microalga Botryococcus braunii e as propriedades do biodiesel produzido foram avaliadas de acordo com as especificações europeias (EN 14214) e americanas (ASTM D6751). A biomassa desengordurada, obtida como coproduto, foi digerida por digestão anaeróbica (a 25 e 35°C) e transformada em biogás, utilizando diferentes consórcios de bactérias (provenientes das Estações de Tratamento de Águas Residuais de Silves e Lagos). O biogás produzido foi analisado de forma a ser conhecida a proporção entre dióxido de carbono e metano, e a existência de sulfureto de hidrogénio (principal contaminante obtido na produção de biogás, e principal razão para não ser possível o seu armazenamento) obtido após a digestão. Para concluir foram realizados balanços de massa e energético dos biocombustíveis produzidos, de forma a discutir a viabilidade da produção do biodiesel à base de microalgas juntamente com a valorização da biomassa tendo por base um conceito de bio refinaria.
VIII A biomassa algal apresentou um conteúdo lipídico de 14.8%, e após a extração dos lípidos, estes sofreram uma transesterificação e formaram o biodiesel. Este passo apresentou um rendimento de 46.8%, sendo que foi sujeito um passo seguinte de purificação com rendimento de 30.5% de forma a cumprir os padrões exigidos na Europa e Estados Unidos da América. Os ácidos gordos predominantes no biodiesel produzido foram os C16:0, C18:2n6 e C18:1, entre os quais, os ácidos gordos insaturados apresentam-se em maioria, 55%. Os ácidos gordos saturados que providenciam uma maior estabilidade oxidativa representam 43%. O biodiesel produzido cumpre a maioria das especificações exigidas pelas normas, excluindo apenas os parâmetros de densidade, viscosidade e fosforo.
Durante a digestão da biomassa original e desengordurada a 35°C foi realizada uma adição de um grama de biomassa no dia 42 e foi realizada num total de 73 dias. O rendimento da digestão da biomassa original pelo consórcio de Lagos foi de 284 mL biogás/g SV, por sua vez o rendimento da produção de biogás pelo inóculo de Silves foi de 312 mL biogás/g SV, para a digestão que durou 42 dias. O rendimento da digestão da segunda adição de biomassa (dia 42 a dia 73) foi de 308 mL biogás/g SV com o inóculo de Lagos e de 322 mL biogás/g SV com o inóculo de Silves. O rendimento total (73 dias de digestão) foi de 333 mL biogás/g SV para ambos os inóculos utilizados. O rendimento da digestão da biomassa desengordurada pelo consórcio de Lagos foi de 369 mL biogás/g SV (melhor resultado obtido nesta experiência), por sua vez o rendimento da produção de biogás pelo inóculo de Silves foi de 297 mL biogás/g SV, para a digestão que durou 42 dias. O rendimento da digestão da segunda adição de biomassa (dia 42 a dia 73) foi de 364 mL biogás/g SV com o inóculo de Lagos e de 308 mL biogás/g SV com o inóculo de Silves. O rendimento total (73 dias de digestão) foi de 359 mL biogás/g SV com o inóculo de Lagos e de 320 mL biogás/g SV com o inóculo de Silves. O inóculo de Lagos obteve um rendimento de 276 mL biogás/g SV na digestão da biomassa inicial, por sua vez o inóculo de Silves obteve um rendimento de 269 mL biogás/g SV na digestão dessa mesma biomassa, os rendimentos obtidos foram semelhantes para ambos os inóculos utilizados, esta experiencia foi realizada durante 46 dias. A biomassa desengordurada ainda apresentou uma produção mais reduzida durante os mesmos 46 dias da biomassa original. O inóculo de Lagos apresentou um rendimento de 172 mL biogás/g SV para esta mesma biomassa. O inóculo de Silves obteve um rendimento superior com 193 mL biogás/g SV. A composição do biogás foi apenas realizada na digestão anaeróbica da biomassa
IX desengordurada a 25 e 35°C com o inóculo de Silves. A composição do biogás a 35°C foi de 82% de metano, 18% de dióxido de carbono e não foi detetada a presença de sulfureto de hidrogénio. A composição do biogás a 25°C foi de 72% de metano, 23% dióxido de carbono e 2 ppm de sulfureto de hidrogénio.
Através de um programa de modelação (SuperPro Designer), os resultados obtidos experimentalmente foram extrapolados para uma produção de 1000 kg de biodiesel, consequentemente a biomassa desengordurada produziu 2687 kg de metano. O rendimento energético do processo foi de 48145 kWh, com um custo de produção de 94341 kWh. As principais matérias-primas para a produção de 1000 kg de biodiesel foram 16.4 t de microalga (peso seco), 200 t de metanol, 179 t de hexano e 2226 t de água, a maioria dos solventes utilizados foram reciclados e utilizados nos próximos processos de produção. Para o reaproveitamento desses solventes foi necessária a sua evaporação, este foi o processo mais dispendioso a nível energético, representando 85% do consumo energético. A exclusão do processo de evaporação desta biorrefinaria resultaria num balanço energético positivo de 33844 kWh.
Palavras-chave: Microalgas, Biodiesel, Biogás, Extração de lípidos, Digestão anaeróbica, B. braunii.
X
Abbreviations
AD Anaerobic digestion C/N Carbon/nitrogen ratio C16:0 Palmitic acid C16:1 Palmitoleic acid C16:2 Hexadecadienoic acid C18:0 Stearic acid C18:1 Oleic acid C18:2n6 Linoleic acid C18:3n6 Linolenic acidCFPP Cold filter plugging point
CN Cetane number
CNG Compressed natural gas
COD Chemical oxygen demand
DB-Lagos Defatted biomass digested with the inoculum from Lagos DB-Silves Defatted biomass digested with the inoculum from Silves
DW Dried weight
EC European Community
EGCM External gas control module
EU European Union
FAME Fatty acids methyl esters
GHG Greenhouse gases
HCl Hydrochloridric acid
XI
IV Iodine value
LCA Life cycle assessment
LCC Life cycle costing
LCI Life cycle inventory analysis
LCIA Life cycle impact assessment
LCSF Long chain saturated factor
MP-AES Microwave plasma-atomic emission spectrometer
MUFA Monounsaturated fatty acids
NEB Net energy balance
Ni/MH Nickel-metal hydride battery
PBR Photobioreactor
PUFA Polyunsaturated fatty acids
RB-Lagos Raw biomass digested with the inoculum from Lagos RB-Silves Raw biomass digested with the inoculum from Silves
SFA Saturated fatty acids
SFE Supercritical fluid extraction
STP Standard temperature and pressure
TAG Triacylglycerol
TLC Thin layer chromatography
TSS Total suspended solids
UV Ultra violet
VS Volatile solids
VSS Volatile suspended solids
XII
Index
Resumo ... VII
1. Objective ... 1
2. Framework ... 2
3. State of the art review... 3
3.1. Fossil fuels as energy sources and greenhouse gases problems ... 3
3.2. Biofuels ... 4
3.3. Microalgal-based biofuels ... 7
3.4. Microalgal cultivation and harvesting ... 12
3.5. Oil extraction ... 16
3.6. Transesterification ... 16
3.7. Biorefinery ... 17
3.8. Life cycle assessment ... 18
3.9. Microalgae (Botryococcus braunii) ... 19
4. Materials and methods ... 21
4.1. Growth of microalgal biomass ... 21
4.2. Determination of total lipids ... 21
4.3. Biodiesel production ... 22
4.3.1. Lipid extraction ... 22
4.3.2. Lipid transesterification and biodiesel purification ... 23
XIII
4.3.4. Assessment of biodiesel properties ... 24
4.4. Determination of Ca, Mg, K, Na and P ... 25
4.5. Anaerobic digestion of raw and spent biomass ... 26
4.5.1. Inoculum characteristics ... 27
4.6. Biogas production ... 29
5. Results and discussion ... 32
5.1. Proximate composition ... 32
5.2. Biodiesel ... 32
5.3. Biogas ... 39
5.4. Energy and mass balance ... 55
6. Conclusion ... 61
XIV
Index of Figures
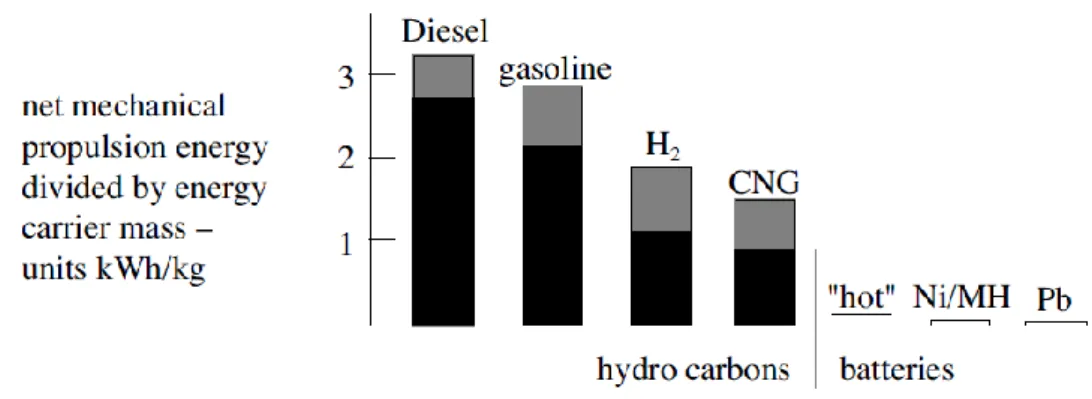
Figure 3.1 - Estimates of energy density of several on-board energy carriers. ... 4
Figure 3.2 - Microalgae potential for the production of biofuels. ... 7
Figure 3.3 - Representation of microalgae growth rate (solid line) and nutrients concentration (dashed line) over time. ... 13
Figure 3.4 - Aerial view of a raceway pond. ... 14
Figure 3.5 - Photobioreactor with horizontal tubes on a parallel distribution. ... 15
Figure 3.6 - Transesterification of triglycerides. ... 17
Figure 3.7 – Energy and mass incomes and outcomes on a microalgae biorefinery. ... 17
Figure 3.8 - Life cycle assessment framework. ... 19
Figure 3.9 – a) Microscopy visualization of B. braunii colonies; b) Microscopy visualization of B. braunii excreting oil from the colonies. ... 20
Figure 4.1 - Green wall airlift photobioreactor at NECTON S.A. facilities... 21
Figure 4.2 - Extraction of the lipids from the B. braunii biomass. ... 22
Figure 4.3 - Transesterification of the lipids to produce the biodiesel. ... 23
Figure 4.4 - Biogas production experiment. ... 26
Figure 4.5 - Anaerobic digester linked to the tedlar bag. ... 27
Figure 4.6 - Measurement of the pressure on the head space to estimate the biogas production. ... 30
Figure 4.7 - Measurement of the biogas composition with a Geotech Biogas 5000. ... 30
Figure 5.1 - Efficiency of the lipid extraction. ... 33
XV Figure 5.3 - Yields of the biodiesel conversion rates ... 35 Figure 5.4 – Daily biogas production from raw biomass at 35°C inoculated with the inoculum from Lagos WWTP (RB-Lagos) and Silves WWTP (RB-Silves). ... 42 Figure 5.5 – Cumulative biogas production from raw biomass at 35°C inoculated with the inoculum from Lagos WWTP (RB-Lagos) and Silves WWTP (RB-Silves). ... 42 Figure 5.6 – Cumulative biogas production of the first 42 days of digestion of the raw biomass at 35°C inoculated with the inoculum from Lagos WWTP (RB-Lagos) and Silves WWTP (RB-Silves). ... 43 Figure 5.7 – Cumulative biogas production of the second gram of raw biomass added at 35°C inoculated with the inoculum from Lagos WWTP (RB-Lagos) and Silves WWTP (RB-Silves). ... 43 Figure 5.8 – Daily biogas production from defatted biomass at 35°C inoculated with the inoculum from Lagos WWTP (DB-Lagos) and Silves WWTP (DB-Silves). ... 45 Figure 5.9 – Cumulative biogas production from defatted biomass at 35°C inoculated with the inoculum from Lagos WWTP (DB-Lagos) and Silves WWTP (DB-Silves). ... 45 Figure 5.10 – Cumulative biogas production of the first 42 days of digestion of the defatted biomass at 35°C inoculated with the inoculum from Lagos WWTP (DB-Lagos) and Silves WWTP (DB-Silves). ... 46 Figure 5.11 – Cumulative biogas production of the second gram of defatted biomass added at 35°C inoculated with the inoculum from Lagos WWTP (DB-Lagos) and Silves WWTP (DB-Silves). ... 46 Figure 5.12 – Daily biogas production from raw biomass at 25°C inoculated with the inoculum from Lagos WWTP (RB-Lagos) and Silves WWTP (RB-Silves). ... 47 Figure 5.13 – Cumulative biogas production from raw biomass at 25°C inoculated with the inoculum from Lagos WWTP (RB-Lagos) and Silves WWTP (RB-Silves). ... 48 Figure 5.14 – Daily biogas production from defatted biomass at 25°C inoculated with the inoculum from Lagos WWTP (DB-Lagos) and Silves WWTP (DB-Silves). ... 49
XVI Figure 5.15 – Cumulative biogas production from defatted biomass at 25°C inoculated with the inoculum from Lagos WWTP (DB-Lagos) and Silves WWTP (DB-Silves). .. 49 Figure 5.16 - Biorefinery scheme of the biodiesel and biogas production. ... 57
XVII
Index of Tables
Table 3.1 - Oil productivity on the different biomass sources, and land area required.. .. 8
Table 3.2 - Comparison between the EN14214 and ASTM D6751 legislations. ... 10
Table 3.3 - Theoretical methane yields for the three major substrates of microalgae. ... 11
Table 4.1 – Wavelengths of the elements. ... 25
Table 5.1 - Proximate composition of B. braunii biomass. ... 32
Table 5.2 - FAME composition of the biodiesel sample from B. braunii. ... 36
Table 5.3 - Comparison of the properties of the B. braunii biodiesel sample with the EN14214 and ASTM D6751 legislations. ... 36
Table 5.4 - Properties of the 2 different inoculums and the 2 different biomasses. ... 40
Table 5.5 - Biogas composition DB-Silves large scale digesters (CH4, CO2 and H2S content). ... 50
Table 5.6 - Biogas production results, methane production and theoretical methane production. ... 51
Table 5.7 – Analytical composition of the reaction mixture after digestion (DB-Silves). ... 53
Table 5.8 - Overall biorefinery energy outputs and inputs. ... 55
Table 5.9 – Mass balance of the raw materials of the biorefinery... 56
Table 5.10 - Quantities of solid and liquid waste from the biorefinery concept. ... 58
1
1. Objective
The present work aims to assess the effectiveness of a biorefinery to process the biomass of Botryococcus braunii into biodiesel, and further upgrade the residual biomass obtained after lipid extraction into biogas by means of anaerobic digestion.
In order to achieve this main objective a series of secondary objectives must be met, such as:
Extraction of the lipid fraction from the biomass using low cost solvents and production of biodiesel;
Assessment of the properties of the produced biodiesel according to the European (EN 14214) and American legislations (ASTM D6751);
Test the effectiveness of different inocula (bacterial consortia) to effectively digest the residual microalgal biomass;
Test the effectiveness of different temperatures for the anaerobic digestion of residual biomass into biogas;
Assess the composition of the produced biogas;
2
2. Framework
On the 20th century, the organic chemicals industry based on crude oil refineries presented a huge importance to the economy, but faced with increasing greenhouse problems, the 21st century biomass refinery will need significant development and re-structure (Clark et al., 2006).
The increase in greenhouse gases can lead to the rise of the surface temperature, heat waves will occur more often and on longer periods of time, precipitation will be more intense and sea level may rise (IPCC, 2014). In the near future, depletion of fossil fuels, and political instability on the producer countries, may cause fluctuations in oil prices. Therefore, new sources of fuels must be sought and developed. One of the most promising, due to their energy density, are the biofuels produced from biomass, the main ones are biogas, biodiesel and bioethanol. Biomass feedstocks can be from many different sources (e.g. wheat, corn, rapeseed, palm oil, soy, Jatropha, sugar cane, municipal waste and starch), although the oleaginous plants are the most used (Naik et al., 2010; Pereira et al., 2013a).
However, the use of oleaginous plants for the production of biofuels is not sustainable on a larger scale, for three main reasons:
Huge crop areas needed for cultivation; Massive quantity of freshwater for irrigation;
Direct competition with food production, which would lead to a general increase in food prices (Chisti, 2007; Schenk et al., 2008; Zhu, 2014).
Microalgae appear as a more sustainable alternative. They are suitable sources of lipids, due to the high capability to accumulate them, can be grown in non-arable lands using salt or brackish water and they do not compete with food production (Chisti, 2007; Mussgnug et al., 2010; Pereira et al., 2013b; Schenk et al., 2008; Varela et al., 2014). However, microalgal biomass production is expensive and, to date, microalgal-based biodiesel cannot compete with the low price of fossil fuels. Therefore, the biorefinery concept applied to microalgae biomass has emerged. This concept relies on the full exploitation of all biochemical constituents, through the development of different products and upgrade of residues produced throughout the process, in order to enhance the final value of a given microalgal biomass (Chisti, 2007; Pereira et al., 2011).
3
3. State of the art review
3.1. Fossil fuels as energy sources and greenhouse gases problems
The industrial revolution escalated the global energy demand, and the prices of fossil fuels tend to increase proportionally to the depletion of the fossil fuel reserves (Mussgnug et al., 2010). Human activities are perturbing the world’s climate; the emissions of greenhouse gases (GHG) for the transportation and energy sectors are the most problematic, representing more than 20 or 60%, respectively in the European Community (Mata et al., 2010). Moreover, atmospheric methane (CH4), nitrous oxide (N2O) and
carbon dioxide (CO2) levels have raised in the past years (Cherubini, 2010; IPCC, 2014).
GHG contributes to global warming, and has significant effects on the environment. In addition, absorption of CO2 by the oceans may decrease the water pH and such
acidification may cause problems on the ecosystems biodiversity (IPCC, 2014; Mata et al., 2010). Over the past decade the transportation sector has shown the highest growth in GHG emissions. The primary source of energy for this sector is oil, and this demand is expected to rise 60% until 2030 (Cherubini, 2010). To reduce GHG produced by fossil fuels, renewable energy sources must be implemented. In this respect, there are many different technologies already being employed, such as solar energy, hydroelectric, thermal, photovoltaic, wind, biofuels, among others (Mata et al., 2010).
Concerning the replacement of fossil fuels for transportation, although there are different alternatives currently established (e.g. electricity and hydrogen driven vehicles) they are only viable for light-duty vehicles. Heavy transportation (e.g. lorries, ships, planes) and industrial machinery will probably require liquid biofuels, because the energy density available on batteries is considerably lower than that of liquid-based fuels (Guzzella & Sciarretta, 2005; Pereira et al., 2013a).
4 Figure 3.1 - Estimates of energy density of several on-board energy carriers (Guzzella & Sciarretta, 2005).
In this context, the EU wants to reach the target of 10% of renewable biofuels in the transport sector until 2020 (Pacini et al., 2013).
3.2. Biofuels
Biofuels are divided into two main categories: 1st and 2nd generation biofuels. First generation biofuels are produced from raw materials that compete with food and feed industries. Therefore, some ethical, political and environmental concerns were raised (Cherubini, 2010; Mata et al., 2010; Naik et al., 2010; Schenk et al., 2008).
The majority of the 1st generation biofuels are produced from animal fats, starch, vegetable oils and sugar. The main feedstocks used are wheat, corn and rapeseed, and the primary biofuels produced are biodiesel, bioethanol, starch-derived biogas and, in smaller quantities vegetable oils, biomethanol, and bioethers. The advantages of first generation are the easier conversion of high sugar or oil content into biofuel; some studies showed a reduction in GHG emissions and fossil energy consumption compared with the conventional diesel and gasoline on a Life Cycle Assessment (LCA; Cherubini, 2010). To overcome the limitations of first generation biofuels, the second generation biofuels gained increasing attention (Cherubini, 2010; Naik et al., 2010; Schenk et al., 2008). Second generation biofuels, do not compete with food crops, are carbon neutral or have a carbon negative impact on the CO2 cycle. The main feedstocks used for its production,
are residues from agriculture, forestry, industry, microalgae and lignocellulosic crops (Naik et al., 2010; Schenk et al., 2008), and the main goal is to enhance biofuel production
5 sustainability (Antizar-Ladislao & Turrion-Gomez, 2008). This generation of biofuels shows improvements on land use efficiency, net energy balance (NEB), water efficiency and environmental performance over the first biofuel generation (Cherubini, 2010; Mata et al., 2010; Schenk et al., 2008), and has the potential to be more price competitive with fossil fuels (Naik et al., 2010).
The three main biofuels produced worldwide are biodiesel, biogas and bioethanol, they substitute diesel, natural gas and gasoline, respectively, with minor engine modifications (Naik et al., 2010).
Biodiesel is a mixture of fatty acids methyl esters (FAME), normally produced from rapeseed, sunflower, soybean, palm oil or waste edible oils. The major producers are Germany, USA, France, Italy and Austria (Cherubini, 2010; Razon & Tan, 2011). Biodiesel presents several advantages over fossil fuels: it is renewable, biodegradable, has reduced particulate emissions, it improves engine lubricity and some are non-toxic. One of the major problems of biodiesel when compared to the regular fuels are the production costs, and normally they need to be heavily subsidized by governments (Razon & Tan, 2011).
The principal feedstocks used on the production of bioethanol are corn-starch, sugarcane, sugar beet and wheat. The biggest producers are USA and Brazil; who alone represent 62% of the global production. Bioethanol production consists on the fermentation of the sugars and a distillation (Cherubini, 2010; Kim & Dale, 2004).
Anaerobic digestion can be done using different biomass feedstocks. In that process anaerobic bacteria can break either organic matter or cell walls and a mixture of carbon dioxide, methane and other gases in smaller quantities are released. The main contaminant is hydrogen sulphide. Contaminants and toxic gases should be separated from the biogas, which can be a substitute to natural gas (Lantz et al., 2007; Naik et al., 2010; Schenk et al., 2008). Due to this, the biogas usually is burn in combined heat and power plants to produce electric energy, avoiding storage (Schenk et al., 2008).
Organic materials used on anaerobic digestion are mainly from corn, manure, organic waste and grasses. If waste residues are the principal constituent of the feedstock used, the biogas can be categorized as 2nd generation biofuel (Cherubini, 2010). The main gases produced are methane (50-80%), carbon dioxide (20-50%) and traces of hydrogen sulphide (0-0.4%) due to the metabolic action of methanogenic bacteria, while the solid
6 remainder can be used as organic fertilizer (Lantz et al., 2007; Naik et al., 2010). The digestate incorporate all the non-degradable substances present in the original feedstock. The degradation increase the nitrogen availability. Consequently, the fertilization efficiency will increase (Lantz et al., 2007).
The anaerobic digestion is divided in four stages: stage 1 – hydrolysis of the lipids, protein and polysaccharides to form monomers and oligomers (e. g. fatty acids, sugars, peptides and amino acids); step 2 – acidogenesis due to the release of propionate, alcohols and butyrate (volatile fatty acids); step 3 – acetogenesis converting the volatile fatty acids into acetate; step 4 – methanogenesis, formation of the methane and carbon dioxide, through the consumption of the acetate (Deppenmeier et al., 1996). The main groups of bacteria who conduct the anaerobic biodegradation are: hydrolytic and fermentative (step 1), acidogenic bacteria (step 2), homoacetogenic and acetogenic bacteria (step 3), and methanogenic bacteria (step 4; Leschine, 1995; Vergara-Fernández et al., 2008). Anaerobic digestion can be operated in two different conditions, mesophilic (35°C) or thermophilic (55°C) (Gunaseelan, 1997; Harun et al., 2010). Anaerobic digestion can occur in aqueous environments, consequently is able to use feedstock sources with high water content without a drying step (Ward et al., 2008).
Microalgae biomass has a great potential for the production of the three major biofuels. Their cells can accumulate a large amount of lipids, usually in the form of triacylglycerols (TAG), carbohydrates, proteins and fats. Figure 3.2 shows the steps for biofuels production (Pereira et al., 2013a; Zhu, 2014).
7 Figure 3.2 - Microalgae potential for the production of biofuels (Adapted from Zhu, 2014).
3.3. Microalgal-based biofuels
Microalgae display several advantages compared to oleaginous plants for the production of biodiesel and other biofuels, namely:
Higher photosynthetic efficiency;
High oil content, which can reach 70% of dried biomass (see table 1 for a comparison between different biomass feedstocks);
Fast growth rates (e. g. microalgae can double their biomass weight within 24 h, and during exponential growth it can be as low as 3.5 h);
Can be cultivated on sea water or brackish water;
Nutrients required for their growth can be obtained from wastewater (e.g. nitrogen and phosphorus);
8 Possibility of cultivation on non-arable land, and consequently not competing with the food and feed markets (Chisti, 2007; Mussgnug et al., 2010; Pereira et al., 2013b; Rodolfi et al., 2009; Zhu et al., 2014).
Table 3.1 - Oil productivity on the different biomass sources, and land area required (Adapted from Chisti, 2007).
Comparison of some sources of biodiesel
Crop Oil yield
(L/ha)
Land area needed (M ha) a Percent of existing US cropping area a Corn 172 1540 846 Soybean 446 594 326 Canola 1190 223 122 Jatropha 1892 140 77 Coconut 2689 99 54 Oil palm 5950 45 24 Microalgaeb 136900 2 1.1 Microalgaec 58700 4.5 2.5
a For meeting 50 % of all transport fuel needs of the United States. b 70 % oil (by wt) in biomass.
c 30 % oil (by wt) in biomass.
Nevertheless, the economics of the whole process are still not able to compete with fossil fuels (Razon & Tan, 2011; Zhu et al., 2014). One of the key disadvantages of microalgae production is the cost of harvest and water removal (Razon & Tan, 2011). Nevertheless, in a near future, microalgae-based biofuels seem to be the only renewable biofuel able to compete with oil-based fuels (Chisti, 2008; Rodolfi et al., 2009).
The typical composition of microalgae biomass is proteins (40-60%), lipids (5-60%), carbohydrates (8-30%), nucleic acids (5-10%) and other valuable minor compounds (pigments, anti-oxidants, fatty acids and vitamins). These components present a wide range of applications: carbohydrates are appropriate feedstock to microbial growth or production of bioethanol; lipids can be used to produce biodiesel (Uggetti et al., 2014); and the long chain fatty acids, pigments, and proteins can be used as nutraceutical and pharmaceutical products (Gangadhar et al., 2016; Pereira et al., 2011; Uggetti et al., 2014).
9 Generally, the oil content of microalgae compared to terrestrial plants is higher; some species can produce 50-60% of lipids (dry weight). The principal methods to extract the lipid content of the microalgae are solvent extraction, oil press, ultrasound and supercritical fluid extraction. Research has shown that Chlorella vulgaris, Nannochloropsis sp., B. braunii, Nitzschia laevis, Parietochloris incise and Schizochytrium sp. are suitable for biodiesel production (Uggetti et al., 2014). With the right stress conditions it is possible to induce the lipid content of many microalgae strains (e. g. nitrogen and phosphorus deficiency, salinity; Mata et al., 2010) . Microalgal oil is converted to biodiesel after transesterification. Biodiesel produced has to meet the EU and USA normatives to be sold on those countries (table 3.2). The biodiesel is composed of different types of FAME, saturated (SFA), monounsaturated fatty acids (MUFA) and polyunsaturated fatty acids (PUFA). Biodiesel must present a low degree of unsaturation of the FAME and a high quantity of SFA and MUFA to abide to the properties regulated by the American and European specifications (Pereira et al., 2013b). The density and viscosity of the biofuel produced can develop problems in the engines, forming deposits. Higher density and viscosity decreases the flow of fuel to the engine, decreasing his power (Knothe, 2005). The Cetane number (CN) represents the ignition quality of the biofuel, and can be correlated to the octane number of the gasoline. High CN can lead to low ignition delays, and vice versa. Higher CN can be derived by the high quantity of saturated fatty acids. Consequently, the higher the CN, the higher the quality of the biofuel and lower emissions of nitrogen oxides to the atmosphere (Knothe, 2005). The Iodine Value (IV) quantifies the unsaturated fatty acids and the iodine content of the biodiesel sample. Iodine value increases with the unsaturation of the biodiesel (Francisco et al., 2010; Ramos et al., 2009). High heating value (HHV) is the heat released during the combustion of the fuel, commonly determined by a bomb calorimeter or estimated using a group contribution method (Levine et al., 2014). Calcium, magnesium, potassium, sodium and phosphorus are some of the pollutants controlled by the environmental agencies. Consequently the biodiesel sample should not exceed the maximum allowed in the legislations. Cold filter plugging point (CFPP) measures the capability of the biodiesel to pass through 0.45 µm filter at the lowest temperature. High CFPP can lead to plugging filters, tubbing line and wax settling, which will create problems on the engine. The higher the saturation of the biodiesel, the higher the melting point (Ramos et al., 2009).
10 Table 3.2 - Comparison between the EN14214 and ASTM D6751 legislations.
Properties Unit EN 14214 ASTM
D6751
Viscosity (40°C) mm2s-1 3.5-5.0 1.9-6.0
Density (15°C) Kg/L 0.86-0.90 n.a.
Cold filter plugging point (CFPP) °C n.a. n.a.
Iodine Value g I/100g ≤120 n.a.
Cetane number - ≥51 ≥47
PUFA (≥ 4 double bonds) % mass ≤1 n.a.
Linolenic acid % mass ≤12 n.a.
HHV MJ/kg n.a. n.a. Ca mg/kg ≤5.0 ≤5.0 Mg mg/kg ≤5.0 ≤5.0 K mg/kg ≤5.0 ≤5.0 Na mg/kg ≤5.0 ≤5.0 P mg/kg ≤4.0 ≤10
One promising approach to substitute the natural gas resources for anaerobic fermentation seems to be fast-growing algae with high lipid, protein and starch content (Mussgnug et al., 2010). Studies with the anaerobic digestion and conversation rates of Macrosystis pyrifera, Tetraselmis, Gracilaria tikvahiae, Hypnea and Ulva have concluded that these species are promising (Vergara-Fernández et al., 2008). Microalgae can be easily fermented when compared with land plants due to the absence of lignin in their composition (Harun et al., 2011; Schenk et al., 2008; Wiley et al., 2011; Zhu, 2014). Microalgae biomass can achieve similar or higher ratio of methane to carbon dioxide production to those of organic matter, 55-75% and 25-45% respectively (Harun et al., 2010; Naik et al., 2010; Schenk et al., 2008). The higher biogas production efficiency is related to the microalgae cell wall properties: the easier the wall breaking, the higher biogas production (Uggetti et al., 2014). Depending on the biomass, the typical yield varies from 0.15 to 0.65 m3 of biogas per kg of biomass; assuming the average values of biogas energy content, microalgae could provide 9360 MJ of energy per metric ton of biomass (Chisti, 2008).
The carbon/nitrogen (C/N) ratio is also important to the yield of the anaerobic digestion: lower C/N ratios can be inhibitory, while high C/N ratios can lead to nitrogen deficiency, taking to a slower decomposition of the residue by the bacteria consortium. Microalgae biomass has a typical C/N ratio of 6. Microalgae with high protein content can be
11 inhibitory to the development of the methanogenic bacteria, due to the production of ammonia. Some studies have shown that a C/N ratio of 25 to 32 has a positive effect on the methane yield and, to improve the process, a secondary substrate can be added to fulfil the lack of nutrients of the initial substrate (Debowski et al., 2013; Uggetti et al., 2014; Wiley et al., 2011). Sialve et al. (2009) compared the production of biogas from microalgae biomass before and after lipid extraction, and it seems to be more profitable to perform the anaerobic digestion of the biomass before lipid extraction.
If the composition of the substrates is known, it is possible to calculate the biogas yields (equation 1 and 2), although the variability in composition could be a problem (Wiley et al., 2011). For microalgae, the biogas yield will probably be less than the theoretical predictions mainly because of the resistance of the cell walls (Wiley et al., 2011). Angelidaki & Sanders (2004) provided a stoichiometrical balance to estimate the theoretical methane yield,
(1) 𝐶𝑛𝐻𝑎𝑂𝑏+ (𝑛 − 𝑎 4− 𝑏 2) 𝐻2𝑂 → ( 𝑛 2− 𝑎 8− 𝑏 4) 𝐶𝐻4+ ( 𝑛 2− 𝑎 8− 𝑏 4) 𝐶𝑂2 (2) 𝐵0 = ( 𝑛 2 − 𝑎 8 − 𝑏 4) ×22.4 12𝑛 + 𝑎 + 16𝑏
Where B0 is the theoretical methane yield (L CH4/g VS), and 224 the molar volume of
methane (STP conditions).
Table 3.3 - Theoretical methane yields for the three major substrates of microalgae (Adapted from Wiley et al., 2011).
Substrate Composition CH4 yield (L/g VS)
Lipids C57H104O6 1.014
Proteins C6H13.1O1N0.6 0.496
12
3.4. Microalgal cultivation and harvesting
As previously mentioned, the microalgal biomass production is expensive compared to crops; even on the microalgal cultivation there are different costs for the different large-scale production setups (Chisti, 2007; Debowski et al., 2013; Wiley et al., 2011). Most important factors to the production are sun light, nitrogen, phosphorus (acts as limiting micronutrient, due to the complexation of metal ions), iron, silicon and carbon dioxide (Chisti, 2007; Mata et al., 2010).
Microalgae can present different metabolisms and can shift between those responding to stress conditions. The main are:
Photoautotrophically – light is the only source of energy used for the photosynthesis;
Heterotrophically – organic compounds are the only source of energy, sun light is not required;
Mixotrophically – the main energy source is photosynthesis, but carbon dioxide and organic compounds have an important roll on growth;
Photoheterotrophycally – organic compound, are used as carbon source, and solar light is used to convert them (Mata et al., 2010).
In figure 3.3 it is possible to see the growth phases and the nutrient depletion over time (Mata et al., 2010).
13 Figure 3.3 - Representation of microalgae growth rate (solid line) and nutrients concentration (dashed line) over time; (1) lag phase; (2) exponential phase; (3) linear phase; (4) stationary phase; (5) decline phase
(Adapted from Mata et al., 2010).
The two most studied methods for microalgal growth in large scale are raceway ponds and tubular photobioreactors (PBR; Chisti, 2007; Mata et al., 2010).
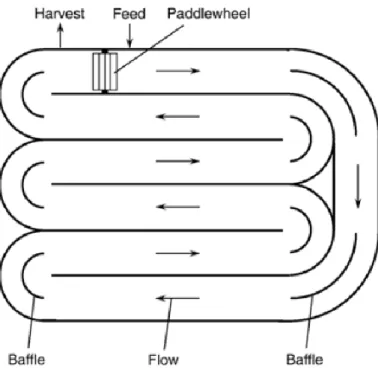
Raceway ponds (figure 3.4) can be built in concrete or compacted soil, and have a recirculation channel with a small depth (0.15-0.3 m). During daylight the culture is fed, and a paddlewheel promotes the mixing and the water is circulated continuously around the circuit to prevent microalgae sedimentation. The corners are round with baffles, and the harvesting step is at the end of the channel (Chisti, 2007; Schenk et al., 2008). Open systems have lower building, operation and maintenance costs. The disadvantages are water evaporation, water temperature control due the environmental conditions, and contamination of the culture by other species. With that, the productivity yields can be affected. To overcome the proliferation of undesired species the cultivation of extremophiles is encouraged (Borowitzka, 1999; Chisti, 2007; Mata et al., 2010; Schenk et al., 2008; Wiley et al., 2011).
C
el
l c
o
ncen
tra
ti
o
n
Time
N
utr
ient c
o
nc
entr
a
ti
o
n
14 Figure 3.4 - Aerial view of a raceway pond (Chisti, 2007).
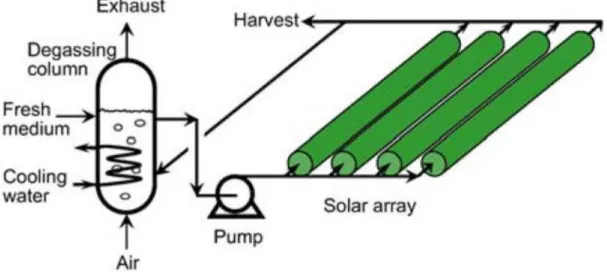
There are many different types of photobioreactors, in which design and operation methods are the main distinguishing factors. The most popular photobioreactors types are flat panels, cylindrical, tubular and disposable (Richmond, 2004). Due to the high diversity of microorganisms, and the differences on the optimal conditions for their culture (nutritional, light requirements and resistance to stress), it is difficult to design a PBR that fits all microalgae species (Richmond, 2004). The major criteria for the construction of PBR are, temperature regulation, durability of the construction material, orientation, inclination, mixing and surface to volume ratio (Mata et al., 2010; Richmond, 2004).
Photobioreactors (figure 3.5) allow the production of a single microalgae species, preventing contaminations with other species or microorganisms, and the optimal conditions for this culture can be achieved. Light, mixing, pH, CO2 losses can be
monitored to ensure a higher volumetric production and higher cell concentration (Borowitzka, 1999; Chisti, 2007; Mata et al., 2010; Richmond, 2004; Schenk et al., 2008). The strongest limitations of the PBR are the high building and operation costs, difficulty of scaling up, bio-fouling, oxygen accumulation on the system, overheating and cell damage by shear stress (Mata et al., 2010; Richmond, 2004).
15 Figure 3.5 - Photobioreactor with horizontal tubes on a parallel distribution (Chisti, 2007).
Comparing raceway ponds and PBR, the price of operation costs of the raceway ponds are cheaper (one order of magnitude lower than the closed systems), but the biomass productivity and the oil yield per hectare is lower (Borowitzka & Moheimani, 2013; Chisti, 2007; Richmond, 2004; Wiley et al., 2011). Due to the differences on the two productions facilities they should not be viewed as competing technologies (Mata et al., 2010; Richmond, 2004).
After the cultivation of the microalgae comes one of the most expensive parts of the production: the harvesting of the culture. Harvesting can contribute 20 to 30% of the production costs. The usual processes are sedimentation, centrifugation, filtration and ultra-filtration. In some cases a flocculation step is needed to aggregate the microalgae to enhance the sedimentation if the cell size of the microalgae is small. For large sized microalgae, in a small-scale production, the best method is filtration and for microalgae with small size and fragile cells the most indicated processes are micro or ultra-filtration. Depending on the desired product quality, the harvesting method may change. For low value products sedimentation is the most used, while for high value products the recovery has to be more effective, and so the best harvesting process is centrifugation (Harun et al., 2010; Mata et al., 2010; Richmond, 2004).
16
3.5. Oil extraction
Oil extraction demands cell wall disruption. The most used processes to achieve this are expeller/oil press, liquid-liquid extraction (solvent extraction), supercritical fluid extraction (SFE) and disruptive ultrasound techniques (Harun et al., 2010; Mata et al., 2010; Pereira et al., 2013a).
Oil presses and expellers are appropriate to nuts and seeds, or dried microalgal biomass. This method has a yield of 75%, being the less effective method (Harun et al., 2010). Solvent extraction by organic solvents is one of the most effective methods, the solvent breaks the cell walls and because of the high solubility of the lipids on organic solvents they are extracted. There are many different organic solvents that can be used on this process (e.g. benzene, acetone, chloroform, cyclohexane), but the most used due to its high extraction capability and low cost price is hexane (Harun et al., 2010).
Supercritical fluid extraction uses high temperatures and pressures, is the most efficient method to extract the oils (up to 100%) and other desired products from the cells. This method can achieve high yields, high product concentration and is extremely time efficient (Harun et al., 2010; Pereira et al., 2013a).
Ultrasound methods are still in an initial stage of development but have already showed potential achieving a yield of 90% extraction of fatty acids and pigments. The mechanism involves the application of ultrasonic waves that create cavitation bubbles around the cells, whose collapse releases the oils (Harun et al., 2010).
3.6. Transesterification
Transesterification is the conversion of triglycerides into three fatty acid ester molecules and one of glycerol (figure 3.6). Usually methanol is the solvent used to conduct this process. Transesterification occurs in three steps, first the triglycerides are converted to diglycerides, afterwards to monoglycerides and to conclude the reaction to glycerol. This reaction is an equilibrium, for each mole of triglyceride three mol of methanol are required, and the result are three mol of methyl esters and one of glycerol. To ensure the reaction in the way of the fatty acid production, methanol is used in excess (6:1). Typically, yields exceed 98%. To speed up the transesterification, catalysts are used; the most common are acids (e.g. sulfuric, phosphoric, hydrochloric or organic sulfonic),
17 bases (e.g. sodium hydroxide, sodium ethoxide, potassium hydroxide and potassium ethoxide) and enzymes (e.g. lipases), although the latter cannot compete with the price of the first (Chisti, 2007; Mata et al., 2010; Naik et al., 2010; Pereira et al., 2013a).
Figure 3.6 - Transesterification of triglycerides (Mata et al., 2010).
3.7. Biorefinery
A biorefinery has the same principle of the oil-based refineries, in which crude oil can produce many different petrochemicals. The same concept can be applied to biomass, from which different bio-products and biofuels are produced, maximising the value of the intermediates and final products, and consequently decreasing the overall costs. The biorefinery concept centralizes many hybrid technologies from different fields, such as polymer chemistry, bioengineering, agriculture and food science (Chisti, 2007; Ohara, 2003).
18 This concept can accept different biological feedstocks and convert them to many different products including chemicals, energy, different generation fuels and materials (Clark et al., 2006; Fitzpatrick et al., 2010). Figure 3.7 shows the energy demands and outputs of a biorefinery.
One of the challenges for the implementation of a biorefinery concept is to deal with the wastewater effluents from bioethanol and biohydrogen processes; these streams are loaded with organic matter that can be converted to biogas and the residual solids can be used as fertilizers for agricultural soil (Kaparaju et al., 2009).
On a biorefinery concept the use of non-renewable energy resources and environmental impacts has to be minimized. Considering an environmental perspective it is required to analyse the carbon, nitrogen and water cycles, their interdependences and the environmental impacts carried by a life cycle assessment (LCA; Cherubini, 2010).
3.8. Life cycle assessment
LCA is a tool to quantify the environmental impacts and resources consumption during the entire product life cycle, from the raw material acquisition or production, to the waste management (disposal) or the recycling program (Finnveden et al., 2009; Rebitzer et al., 2004; ISO 14040). The first scientific reports regarding this topic emerged in the 1990’s, but were often criticized by the scientific community. Since then, a huge development has happened, there are guidelines and the process was homogenised (Finnveden et al., 2009). In the past years, LCA has become a powerful tool for companies, governments or non-government organizations for evaluating, improving, quantifying and comparing goods and services on their potential and environmental impacts (Guinée et al., 2011; Rebitzer et al., 2004; ISO 14040).
A LCA is divided in four parts (figure 3.8): goal and scope definition, life cycle inventory analysis (LCI), life cycle impact assessment (LCIA) and interpretation (Finnveden et al., 2009; Rebitzer et al., 2004; ISO 14040). The LCA does not contemplate the costs of the product life cycle. For that purpose, a Life Cycle Costing (LCC) is normally done. However, it is strongly recommended that both are done simultaneously (Guinée et al., 2011; Rebitzer & Hunkeler, 2003; ISO 14040).
19 Figure 3.8 - Life cycle assessment framework (ISO 14040).
3.9. Microalgae (Botryococcus braunii)
B. braunii was the species researched on this thesis, due to the high quantity of lipid fraction reported on previous studies (75%), and the capability to accumulate high quantities of hydrocarbons (Mata et al., 2010; Metzger & Largeau, 2005).
B. braunii is a unicellular photosynthetic green microalgae, belonging to the group of chlorophyceae (chlorophyta) that can be found in brackish and freshwater, and in all types of climates and environmental conditions. This strain was already reported in distinct locations, namely: USA, Portugal, Bolivia, France, Ivory Coast, Morocco, Philippines, Thailand and West Indies (Banerjee et al., 2002). Contrarily to most microalgal species, this strain has the capability to accumulate significant amounts of hydrocarbons (e.g. alkadienes, trienes, triterpenes and tetraterpenes). Normally, this microalgae forms colonies (botryoid organisation of individual pyriform-shaped cells), as shown in figure 3.9 (Borowitzka & Moheimani, 2013; Metzger & Largeau, 2005).
20 Most studies show that significant differences exist among strains of this microalgae species, mainly the type of hydrocarbons synthesized, due to the growth environment (e. g. laboratory or wild growth; Metzger & Largeau, 2005).
Figure 3.9 – a) Microscopy visualization of B. braunii colonies (scale bar = 25 µm, Algaebase, 2015); b) Microscopy visualization of B. braunii excreting oil from the colonies (scale bar =10 µm Algaebase, 2015).
a)
21
4. Materials and methods
4.1. Growth of microalgal biomass
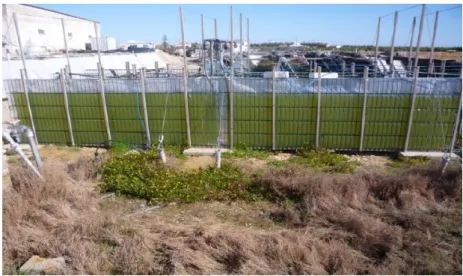
The microalgal biomass of B. braunii was supplied in the form of a dried powder by NECTON S.A., Portugal. Cultures were grown outdoors on green wall airlift photobioreactors (figure 4.1). The culture was harvested by centrifugation, and stored at -20ºC. The frozen paste was later freeze-dried in an industrial equipment and placed in airtight bags until use.
Figure 4.1 - Green wall airlift photobioreactor at NECTON S.A. facilities (Pereira, 2009).
4.2. Determination of total lipids
The amount of total lipids was determined according to the Bligh and Dyer method (Bligh & Dyer, 1959), with some adaptations. Dried microalgae (20 mg per replicate) was homogenised in 10 mL tubes with 0.8 mL of distilled water for 20 min, at room temperature. Afterwards, 2 mL of methanol and 1 mL of chloroform was added and the mixture was homogenized in ice for 60 seconds with a disperser (IKA Ultrathurrax T25). Later, 1 mL of chloroform was added and the samples were homogenized for 30 s, followed by the addition of 1 mL of distilled water and further homogenization for 30 s. After homogenizing the samples were centrifuged at 5000 g for 10 minutes, the
22 chloroform was extracted to new tubes, and 1 mL was pipetted to a previously weighted tube. Finally the tubes were dried at 60ºC, until the chloroform was completely evaporated and further weighted.
4.3. Biodiesel production
4.3.1. Lipid extraction
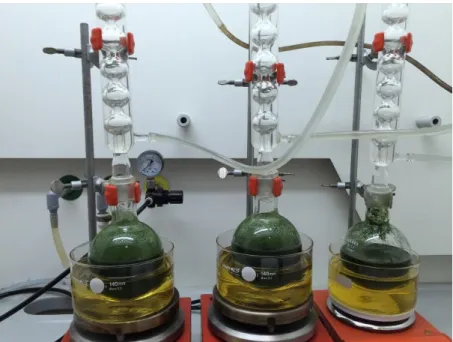
Lipids were extracted following the protocol described in Balasubramanian (2013) with few modifications (figure 4.2). Dried microalgae (50 g per replicate) was placed in 250 mL of solvent mixture of hexane, methanol and ethyl acetate (3:2:0.05; HPLC grade), and stirred at reflux temperature for 2 hours. After refluxing, the mixture was separated in falcon tubes and centrifuged for 5 min at 5000 g. After the first extraction the algae cake was further extracted with 250 mL of solvent mixture, under reflux conditions for 30 min (2nd extraction) and later for 15 min (3rd extraction). The three lipid fractions were pooled and filtered through a Whatman nº 4 filter paper. The solvent mixture was removed from the microalgal oil using a rotatory evaporator under reduced pressure.
23
4.3.2. Lipid transesterification and biodiesel purification
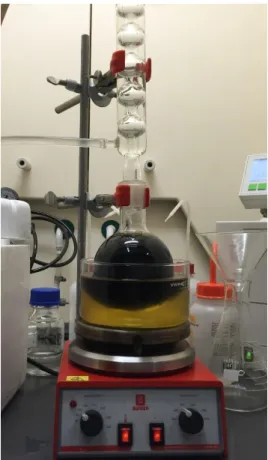
Biodiesel was synthesised (figure 4.3) according to the protocol described by Gangadhar (2016) with minor modifications. The extracted oil was mixed with a methanolic solution (2% sulphuric acid) and stirred at reflux temperature for 5 hours. To confirm the conversion efficacy, the mixture was allowed to reach room temperature, and thin-layer chromatography (TLC) was performed using 98:2 hexane and ethyl acetate as eluent mixture. After reaction completion the solvent was removed up to ¼ of the initial volume using a rotatory evaporator. Afterwards, hexane was added to extract the FAME and the mixture was centrifuged at 5000 g for 5 min. The hexane fraction was separated from the residues (e.g. methanol and glycerol) on a separating funnel with distilled water until the pH reached the value of 6. Afterwards a saturated NaCl solution was used to help break the emulsions generated in the process. To completely eliminate the water, anhydrous sodium sulphate was added, which was afterwards removed by filtration. The hexane phase was evaporated using a rotatory evaporator.
24 To remove the contaminants from the biodiesel mixture (e.g. pigments), bentonite was used according to the procedure described in Peña (2015). Briefly, for each gram of biodiesel, 10 mL of a solvent mixture (99:1 hexane and diethyl ether) and 2 g of bentonite were used. The mixture was stirred over 24 h at 40ºC, and centrifuged at 10000 g for 10 min. The hexane fraction was collected, filtered using a 0.45 µm filter, and evaporated using a rotatory evaporator to obtain the final biodiesel.
4.3.3. Determination of fatty acid methyl ester profile of the biodiesel
The fatty acid methyl ester (FAME) profiles of the biodiesel samples were determined using a Bruker GC-MS (Bruker Scion 456-GC - TQ) equipped with a ZB5-MS capillary column (25 m × 0.25 mm internal diameter, 0.25 μm film thickness, Agilent). The carrier gas was helium at 1 mL/min, while the injector and detector were maintained at 300°C in S/SL mode. The oven temperature was programmed for 60°C (1 min), 30°C min−1 to 120°C, 4 °C min−1 to 250°C, 20°C min−1 to 300°C, and hold for 4 min at this temperature. Identification and quantification of the FAME was performed by comparing the retention times of the FAME in the biodiesel samples with those of an external standard (Supelco 37 Component FAME Mix, Sigma-Aldrich) and further confirmed by comparison of the MS spectra. For quantification purposes, a separate calibration curve was generated for each of the FAME in the standard.
4.3.4. Assessment of biodiesel properties
Density was measured on a 5 mL pycnometer (Gay-Lussac, adjusted 5 cm3), and
kinematic viscosity was measured using a viscometer (Pobel, Micro Ubbelohde Ic, according to ISO 3105) at 40ºC. The cetane number (CN) was determined using the cetane number of each fatty acid methyl ester (CNc) and relative amount of each fatty
acid methyl ester in the mixture (Ac), the equation 3 was used (Knothe, 2014):
(3) 𝐶𝑁𝑚𝑖𝑥 = ∑ 𝐴𝑐×𝐶𝑁𝑐
The estimation of the cold filter plugging point (CFPP) and long chain saturated factor (LCSF) was calculated with the following equations 4 and 5 (Ramos et al., 2009): (4) 𝐿𝐶𝑆𝐹 = (0.1 ×𝐶16) + (0.5×𝐶18) + (1×𝐶20) + (1.5×𝐶22) + (2×𝐶24)
25 C(n) is the relative amount of individual fatty acid methyl ester, present on the mixture where (n) represents the number of carbons on the fatty acid chain.
The iodine value was calculated according to the factors and equations established in the EN14214 (2008).
The High heating value (HHV) was estimated according equation 6 (Fassinou, 2012): (6) 𝐻𝐻𝑉 =(∑ 𝑥𝑖𝐴𝑖)
∑ 𝑥𝑖
Where 𝑥𝑖 is the mass fraction of the FAME 𝑖 and 𝐴𝑖 is the HHV of the pure FAME 𝑖 estimated according to a group contribution method (Levine et al., 2014).
4.4. Determination of Ca, Mg, K, Na and P
The determination of these elements in biodiesel was performed in an Agilent 4100 Microwave Plasma – Atomic Emission Spectrometer (MP-AES), with an External Gas Control Module (EGCM), allowing air injection into the plasma to prevent carbon deposition in the torch. The plasma was stabilized using nitrogen. An inert OneNeb nebulizer was used to increase nebulization efficiency. Calibration standards were prepared at concentrations of 0.5, 1, 5 and 10 ppm by diluting a 500 ppm S21+K solution (Conostan) with Shellsol (Shell). All standards were matrix matched with Blank Oil 75 (Conostan). The samples were spiked with S21+K 0.5 ppm and the spikes measured to validate the method. The wavelengths for the quantification of each element are presented in table 3.
Table 4.1 – Wavelengths of the elements.
Element Wavelength (nm) Nebulizer pressure (kPa)
Mg 285.213 240
Ca 422.673 240
Na 588.995 240
K 766.491 240
26
4.5. Anaerobic digestion of raw and spent biomass
For the production of biogas two inocula were tested, from two different anaerobic digestion reactors, both from Águas do Algarve, SA wastewater treatment plants (WWTP Lagos and Silves). Moreover, two different temperatures (25ºC and 35ºC) and two different biomasses (raw and defatted) were tested.
Dried biomass (1 g per replicate) was placed with 40 mL of inoculum, 10 mL of distilled water and 0.5 g of sodium bicarbonate (NaHCO3) in clamp-top 100 mL vials. Capped
with a rubber septum and clamped with an aluminium crimp seal at the experimental temperature. To assure the anaerobic conditions and start the digestion the head space of each reactor was purged with nitrogen before clamped. Procedural blanks were prepared without the biomass sample. The experiment (figure 4.4) was done in triplicate.
Figure 4.4 - Biogas production experiment.
Due to the low amount of biogas produced with the initial experimental design tested, a new experimental setup was designed using 10 g of defatted biomass, 400 mL of Silves inoculum, 100 mL of distilled water and 5 g of NaHCO3. Two replicates for each
temperature were tested and an additional biomass feed of 10g was performed at day 14 of the experiment. The produced biogas was stored on tedlar bags for gases linked to the incubation vials via tubing (figure 4.5).
27 Figure 4.5 - Anaerobic digester linked to the tedlar bag.
4.5.1. Inoculum characteristics
The inocula were characterised measuring the following parameters: volatile suspended solids (VSS), total suspended solids (TSS), phosphorus (P), nitrogen (N), organic nitrogen, carbon (C), hydrogen (H), phosphate (PO43-), nitrate (NO3-), ammonium (NH4+)
and chemical oxygen demand (COD). These parameters were measured in the large scale replicates before and after anaerobic digestion.
Phosphates and ammonium were measured by spectrophotometry using a multi plate reader (Synergy 4, Biotek), at the absorbance 880 and 630 nm, respectively, using the method described in APHA (2005).For the phosphate determination the sample was filtered through a 1.6 µm filter under vacuum (Whatman GF/A), then the ascorbic acid, ammonium molybdate and potassium antimonyl tartrate trihydrate reacted and formed a blue colouration. For the ammonium determination the sample was filtered on the same way, and reacted with dichloroisocyanuric acid, phenol, trisodium citrate and sodium hydroxide formed the blue indophenol.
Nitrate was determined using a nitrate kit (HACK LANGE LCK 340). Briefly, the sample (10 mL) was placed on the cell and NitraVer 5 Nitrate Reagent Powder Pillow was added to the sample and shaked vigorously for 1 min. After that time, the tube was placed on a
28 stand and after the reaction time (5 min) the sample was measured in an UV spectrophotometer (HACH LANGE DR 2800).
The Chemical Oxygen Demand (COD) was determined in the mixture suspended on distilled water at a dilution of 1/20. Briefly, 2 mL of the sample was pipetted to a COD kit tube (HACH LANGE LCK 514), homogenised on a vortex, and placed on the heating block at 148ºC for 120 min. The tubes were allowed to cool for 10 min, homogenised again in the vortex, and after cooling down to room temperature the absorbance of the samples was measured in the UV spectrophotometer (HACH LANGE DR 2800).
The amount of C, H and N was performed in triplicate in samples of 1-2 mg. Samples were sealed in tin boats and weighed on a microbalance (Sartorius M5P). Prepared samples were either stored in a desiccator or immediately transferred to the automatic sampler Elemental Analyser model Vario ELIII. Nicotinamide served as reference. For total phosphorous determination, samples from the anaerobic digestion were ignited at 550 ± 50 ºC for 14 h in the muffle furnace. After they were humidified with water and 2 mL of hydrochloridric acid (HCl), afterward the samples were filtered with bidistilled water. Then, 5 mL of solution were added to a volumetric flask with 12.5 mL of 5% ammonium molybdate and ammonium vanadate (0.25%) for 15 min. The volume of the mixture was then make up to 50 mL and the absorbance (375 nm) of the mixture measured on a colorimeter (CADAS-100).
The amount of potassium in the samples after the anaerobic digestion was performed with the same filtered sample used on the determination of the total phosphorus, on a MP-AES at 766.491 nm.
Organic nitrogen was determined using the Kjeldahl method (APHA et al., 2005). The sample was boiled in H2SO4 afterwards the ammonium sulfate solution was mixed with
sodium hydroxide (NaOH) to convert the NH4+ to NH3. This was followed by the
distillation of NH3.To conclude the quantification of ammonia a titration was performed
with a standard mineral acid.
Total suspended solids (TSS) and volatile suspended solids (VSS) were done under ESS Method 340.2, the solutions were filtered through a 1.6 µm filter under vacuum (Whatman GF/A). Afterwards, the filter was washed 3 times with Milli-Q water, and
29 dried on an oven for 1 hour at 103-110ºC. When at room temperature the filter was weighted and the amount of TSS calculated using formula (7).
(7) 𝑇𝑆𝑆 (𝑚𝑔
𝐿 ) =
𝑓𝑖𝑙𝑡𝑒𝑟 𝑤𝑒𝑖𝑔ℎ𝑡 𝑎𝑓𝑡𝑒𝑟 𝑑𝑟𝑖𝑒𝑑 (𝑚𝑔)−𝑓𝑖𝑙𝑡𝑒𝑟 𝑡𝑎𝑟𝑒 (𝑚𝑔) 𝑣𝑜𝑙𝑢𝑚𝑒 𝑜𝑓 𝑡ℎ𝑒 𝑠𝑎𝑚𝑝𝑙𝑒 (𝐿)
For the determination of SSV the filter used on the TSS was placed in the muffle furnace and ignited at 550 ± 50 ºC for 30 min.
(8) 𝑉𝑆𝑆 (𝑚𝑔
𝐿 ) =
𝑇𝑆𝑆𝑓𝑖𝑙𝑡𝑒𝑟 𝑤𝑒𝑖𝑔ℎ𝑡 𝑎𝑓𝑡𝑒𝑟 𝑑𝑟𝑖𝑒𝑑 (𝑚𝑔)−𝑓𝑖𝑙𝑡𝑒𝑟 𝑤𝑒𝑖𝑔ℎ𝑡 𝑎𝑓𝑡𝑒𝑟 𝑐𝑟𝑢𝑐𝑖𝑏𝑙𝑒 (𝑚𝑔) 𝑣𝑜𝑙𝑢𝑚𝑒 𝑜𝑓 𝑡ℎ𝑒 𝑠𝑎𝑚𝑝𝑙𝑒 (𝐿)
4.6. Biogas production
Biogas production was measured daily. The pressure of the head space was measured using a manometer (Fisher Scientific FB57057; figure 4.6). After pressure measurement the biogas was released to the environment until the pressure on the headspace reached atmospheric pressure. The pressure difference measured was converted into biogas volume using equation (9).
(9) 𝑉𝑏𝑖𝑜𝑔𝑎𝑠 =
𝑃×𝑉𝐻𝑒𝑎𝑑×𝐶
𝑅×𝑇
where Vbiogas is the biogas produced during that day (L), P the difference of absolute
pressure between the day before and the present day (mbar), Vhead the volume of head
space of the digester (L), C the molar volume (22.41 L/mol), R the universal gas constant (83.14 L mbar/ k mol) and T the absolute temperature.
30 Figure 4.6 - Measurement of the pressure on the head space to estimate the biogas production.
Carbon dioxide (CO2, %), methane (CH4, %), oxygen (O2, %) and hydrogen sulphide
(H2S, ppm) concentrations in the biogas were analysed using a Geotech Biogas 5000 Gas
analyser (figure 4.7).
31
4.7. Statistical analyses
Significant differences between the biogas production in the different combinations of treatments (Inocula – Lagos and Silves; Temperature – 25°C and 35°C; Biomasses – Raw and Defatted) were assessed using the Wilcoxon non-parametric test since the data was not normally distributed. Differences were considered significant when p-values ≤ 0.05.