CDR-based location analytics
&
Gender prediction from subscribers’
list of installed mobile applications
Double Projects Internship Report
Dahmane Sheikh
Internship report presented as partial requirement for obtaining
the Master’s degree in Data Science & Advanced Analytics
i Instituto Superior de Estatística e Gestão de Informação
Universidade Nova de Lisboa
CDR-BASED LOCATION ANALYTICS
&
GENDER PREDICTION FROM SUBSCRIBERS’ LIST OF
INSTALLED MOBILE APPLICATIONS
by
Dahmane Sheikh
Internship report presented as partial requirement for obtaining the Master’s degree in Data Science & Advanced Analytics
Advisor: Mauro Castelli
ii Foremost, I would like to express my sincere gratitude to Carlos Santos, head of Big Data and Advanced Analytics at Vodafone Portugal for giving me the opportunity to be part of his team for an internship. A very special gratitude to my supervisor at Vodafone, Fernando Goulart da Silva, for his invaluable guidance and help throughout my entire journey. To the rest of the team for their friendship and companionship.
I would also like to thank my wife María Arranz for all the care, encouragement and understanding, she provided during my entire academic path. To my parents and closest friends for their support, no matter the distance and time.
To my academic supervisor and teacher, Prof. Mauro Castelli, for all the help in reviewing this present internship report.
iii Big Data is big news in most industries, and telecommunication is no exception. Over the last decades, telecom operators experienced numerous changes in their business models, driven by technological innovations. Although, telecom operators have long had access to substantial bits of data, the scenario has radically evolved with the advent of smartphones, mobile broadband, rapid development of internet, growth of mobile services and Big Data Analytics capabilities (BDA). In today’s data intensive world of communications, tremendous amount of diverse type of data are generated by telecom, bringing both challenges and opportunities to the table. This present internship report summarises my contribution part of the Big Data & Advanced Analytics team of Vodafone Portugal with two research projects; The first one consisted in studying human mobility from cellular network-based data, considering the so-called Call
Detail Records (CDR) as a core proxy to extract spatiotemporal density distribution at finer
geospatial granularity levels. The second consisted in conducting an observational study of the predictability of mobile subscribers’ demographic traits from their installed mobile applications. The latter has the use-case of predicting the gender of mobile subscribers. Both research projects draw attention to the particular ubiquity aspect of connected mobile devices, being widely available and used all over the world.
Keywords
Big data; Location analytics; Human mobility; Mobile phone location data; Call detail records; Demographics prediction; Gender; Mobile devices; Mobile applications; Machine learning.
iv A área de Big Data é uma grande novidade para a maioria das empresas, incluindo as companhias de telecomunicação. Durante as últimas décadas, e graças às inovações tecnológicas, os operadores de telecomunicações viveram muitas mudanças nos seus modelos de atividade comercial. Embora as empresas de telecomunicação já tinham acesso a uma quantidade considerável de dados (bits), o cenário mudou por completo com a chegada dos smartphones, a banda larga, o rápido desenvolvimento de internet, um grande crescimento dos serviços móveis e o Big Data Analytics Capabilities (BDCA). A frenética realidade atual do mundo das comunicações, cria uma grande e diversa quantidade de dados, gerada pelas empresas de telefonia, supondo ao mesmo tempo novos desafios e oportunidades. No seguinte relatório de estágio, resume-se a minha contribuição à equipa de Big Data e Advanced Analytics de Vodafone com dois projetos de investigação: O primeiro projeto consistiu em estudar a mobilidade dos humanos baseando-se nos dados extraídos da rede móvel, considerando o chamado Call Detail Records (CDR) como principal variável para poder obter informação mais detalhada sobre a densidade espácio-temporal em níveis de granularidade. O segundo projeto é um estudo observacional sobre a previsibilidade das características demográficas dos utentes tendo em conta as aplicações instaladas nos seus telemóveis. O caso prático deste último pretende predizer o género dos clientes da rede móvel. Estes dois projetos de investigação pretendem chamar a atenção para a posição onipresente que ocupam os dispositivos móveis ligados à rede na nossa sociedade, estando disponíveis e sendo utilizados no mundo inteiro.
v
List of Figures ... ix
List of Tables ... xi
List of Acronyms ... xii
Chapter 1 Internship description ... 1
1. Academic context ... 2
2. Internship context ... 2
3. Research projects ... 3
4. Internship report outline... 5
5. Place of mobile phone in the modern era ... 6
6. Role of Big Data in Telecom companies ... 7
Chapter 2 CDR-based location analytics ... 9
Abstract ... 10
1. Introduction ... 11
2. Literature Review ... 12
3. Essential Telecom GIS concepts ... 14
3.1. Call Detail Records ... 14
3.2. Cell sites and Cell towers ... 16
3.3. Additional subscribers data ... 17
3.4. International Mobile Subscriber Identity - IMSI ... 18
3.5. Shapefile spatial data format ... 19
3.6. Unit association between people and mobile devices ... 19
4. Research definition ... 20
4.1. Motivations ... 20
vi
4.4. KPIs – What statistics to be extracted? ... 24
5. Data Sources... 25
5.1. Call detail records dataset ... 25
5.2. Vodafone cell sites dataset ... 26
5.3. Lisbon parishes shapefile ... 28
5.4. Mobile Network operator dataset ... 29
6. Methodology, tools and approach ... 30
6.1. Approach ... 30
6.2. Tools ... 31
6.3. CDR dataset analysis ... 33
6.3.1. GDPR & Vodafone regulation... 33
6.3.2. CDR dataset pre-processing ... 34
6.4. Geospatial Upper scaling approach ... 35
6.4.1. Basic spatiotemporal capabilities of call detail records ... 36
6.4.2. Spatial assumption to perform the geospatial upper scaling ... 37
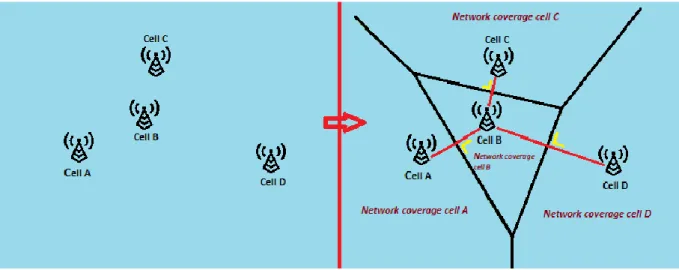
6.4.3. Cell sites network coverage attribution ... 38
6.4.4. From cell sites network coverage to Parishes ... 46
6.5. KPIs – Key Performance Indicators ... 48
6.5.1. Density distribution count per parish ... 49
6.5.2. Density distribution count hourly-wise per parish ... 51
6.5.3. Nationality parsing ... 51
6.5.4. Top X nationality ... 51
6.6. Towards population extrapolation ... 51
6.7. Code testing ... 52
7. Experimental results ... 54
vii Abstract ... 58 1. Introduction ... 59 2. Literature review ... 60 3. Research definition ... 63 3.1. Problem statement ... 63 3.2. Study area ... 64
3.3. Goals and objectives ... 65
3.4. Research architecture ... 67
4. Methodology, tools and approach ... 69
4.1. Big Data Platform – BDP ... 69
4.2. Tools ... 70 4.3. Approach ... 71 4.4. Data exploration ... 73 4.4.1. Primary considerations ... 73 4.4.2. Target quantification ... 74 4.5. Data pre-processing ... 75 4.6. Data collection ... 78 4.7. Data preparation ... 80
4.8. Data analysis and visualization ... 84
4.9. Data modelling ... 90
4.9.1. Binary classification ... 90
4.9.2. Classification algorithms ... 90
4.10. Models evaluation ... 95
4.10.1. Model training and Testing sampling... 95
4.10.2. Evaluation metrics ... 97
viii Bibliography ... 106
ix
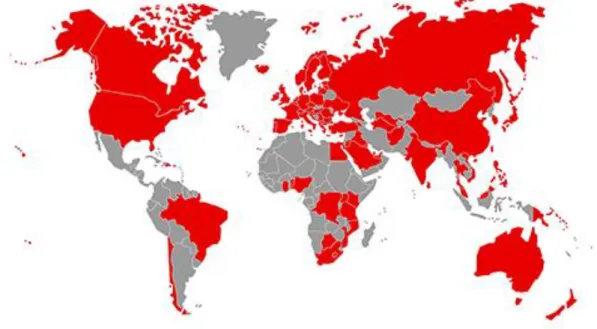
Figure 1: Vodafone global presence (shaded in red) ... 3
Figure 2: Cell sites collocated on a cell tower ... 16
Figure 3: IMSI hierarchy - Example ... 18
Figure 4: Location of Lisbon, Portugal, in Europe ... 21
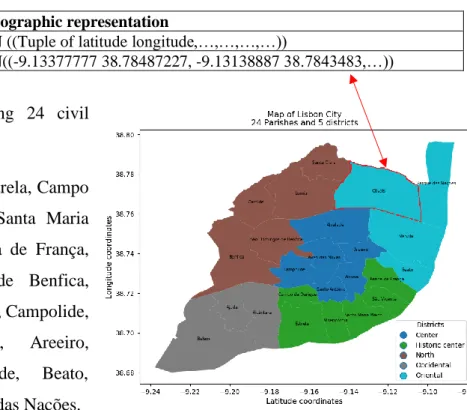
Figure 5: Map of Lisbon with its 24 parishes ... 21
Figure 6: Cell sites coordinates ... 27
Figure 7: Cell sites coordinates on top of the map of Lisbon ... 27
Figure 8: Map of Lisbon: Olivais parish with red bordered ... 28
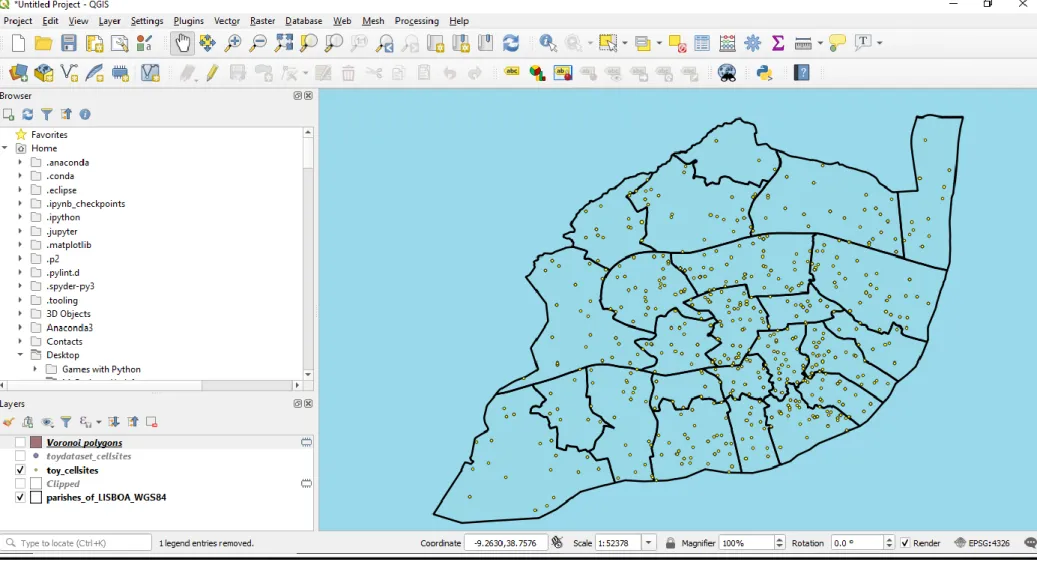
Figure 9: QGIS Software graphic user interface with visualization of cell sites (yellow points) onto the map of Lisbon... 32
Figure 10: Upper scaling approach of one cell site... 35
Figure 11: Cell site location, a mobile subscriber connected to access the cellular network.. 36
Figure 12: Map of Lisbon with representation of cell sites’ antennas signal ranges in blue .. 37
Figure 13: Voronoi diagram application into an Euclidean plane of 4 cell sites ... 39
Figure 14: Step 1 – Load cell sites as inputs on QGIS... 42
Figure 15: Step 2 – Create Voronoi Diagram based on selected cell sites (one per coordinate) ... 42
Figure 16: Downscaling of Lisbon city from parishes to cell sites network coverage ... 43
Figure 17: Assumed location of a subscriber based on its call detail record (reded polygon) 44 Figure 18: Map of Lisbon with three cases of cell sites’ network coverage (in red, brown and blue). ... 46
Figure 19: Example of KPI Density Distribution Count per parish... 50
Figure 20: 2-hour intervals density distribution across 24 parishes of Lisbon ... 54
Figure 21: Research Architecture for the comparison analysis ... 68
Figure 22: Research Architecture: Objective 1 & 2 ... 78
Figure 23: Outlook of the values of the 6 generated datasets ... 79
Figure 24: Format 1 – Apps name as predictors ... 81
Figure 25: Format 2 – Apps aggregated to their Google Play Category ... 81
Figure 26: Format 3 – Truncated Singular Value Decomposition example with 2 dimensions ... 82
x
Figure 28: Research Architecture: Objective 1, 2 and 3 ... 83
Figure 29: Count of mobile apps in the mobile subscriber’s device (in percentage): ... 86
Figure 30: Percentage of mobile apps regarding their recurrence in the users’ device ... 86
Figure 31: Frequency count of apps per Google Play Category ... 87
Figure 32: Frequency count of apps per Google Play Category and Gender ... 88
Figure 33: Percentage of mobile apps per Google play category and gender ... 88
Figure 34: Count of mobile apps per mobile subscriber’s gender for category: TOOL (Frequency) ... 89
Figure 35: Count of mobile apps per mobile subscriber’s gender for category: TOOL (Percentage) ... 89
Figure 36: Logit Model (example with cut-off at 0.5) ... 91
Figure 37: Visual Example of a Decision Tree ... 93
Figure 38: Random Forest ... 94
Figure 39: Hold-out method (Train/Test dataset split) ... 95
Figure 40: K-fold Cross-Validation ... 96
Figure 41: AUC – ROC Curve ... 99
Figure 42: Model’s performance considering the number of apps subscribers have in their device ... 104
xi
Table 1: Typical attributes of Call Detail Records ... 14
Table 2: Example of a Call Detail Record log ... 26
Table 3: Toy example of a cell site from the cell site dataset ... 26
Table 4: Data representation of parish Olivais from the shapefile ... 28
Table 5: Mobile Network operator dataset ... 29
Table 6: Toy example of a Call Detail Record log ... 33
Table 7: CDR log crossed with cell site dataset to localize the connected cell site ... 36
Table 8: Example of cell sites’ antennas with in red the signal ranges... 38
Table 9: Shapefile of cell sites dataset – Example of its content ... 41
Table 10: Example of Voronoi diagram output saved as a shapefile... 43
Table 11: Mapping between Voronoi cell sites and the other cell sites ... 44
Table 12: CDR log crossed with cell site dataset to approximate the location of a mobile subscriber ... 44
Table 13: Updated cell site dataset with polygonal shape of each cell sites ... 45
Table 14: Three cell sites with proportions overlapping the parish(es) ... 47
Table 15: Final Cell sites dataset with overlapping proportion over parish(es) ... 47
Table 16: Description of the Function: Density distribution count per parish ... 49
Table 17: Toy cell site dataset and call detail records for a practical example using the function Density distribution count in Ajuda ... 50
Table 18: Toy example of merging CDR with cell site dataset ... 50
Table 19: Description of the stages of the data workflow ... 65
Table 20: Target Quantification – Basic statistics ... 74
Table 21: APK along with apps title and category if belonging to Google Play Store ... 75
Table 22: Google Play Store: 49 categories for its applications ... 76
Table 23: Generated table ‘Google Play Android Apps’ ... 77
Table 24: BDP temporary table of mobile subscribers with APK and gender known ... 79
Table 25: Confusion Matrix ... 97
Table 26: Experimental results with mobile apps title as predictors ... 102
Table 27: Experimental results with Google Play categories as predictors ... 103
xii API Application Programming Interface
APK Android Package APPS Applications
AUC Area Under the ROC Curve BDA Big Data Analytics
BDP Big Data Platform CDR Call Detail Records
CSP Communication Service Provider
CV Cross-Validation
DT Decision Tree
ESRI Environmental Systems Research Institute
FP False positive
FN False negative
GDPR General Data Protection Regulation GIS Geographic Information System GPS Global Positioning System
GSM Global System for Mobile Communication HDFS Hadoop Distributed File System
HQL Hive Query Language
IG Information Gain
IMS Information Management School IMSI International Mobile Subscriber
xiii KPI Key Performance Indicator
MCC Mobile Country Code MNC Mobile Network Code MNO Mobile Network Operator
MSIN Mobile Subscriber Identity Number ML Machine Learning
MLE Maximum Likelihood Estimation MVNO Mobile Virtual Network Operator LAC Location Area Code
LR Logistic Regression L2P Location To Profile
RF Random Forest
ROC Curve Receiver Operating Characteristic Curve SIM Subscriber Identity Module
SQL Structured Query Languages
TP True positive
TSVD Truncated Singular Value Decomposition
TN True negative
TPR True positive rate
UMTS Universal Mobile Telecommunication System YARN Yet Another Resource Negotiator
1
Chapter 1
2
1. Academic context
This internship report is part of the second-year Master’s degree in Advanced Analytics & Data Science of the faculty IMS (Information Management School) of the University Nova of Lisbon in Portugal. As part of the Master’s requirements, students are to choose to complete either a thesis, a project or an internship with along its written report. As per, this report summarises my contribution part of the Big Data & Advanced Analytics team of Vodafone Portugal. My internship lasted 5 months, starting from early October 2018 till end of February 2019 and took place in the office based in the modern area of Lisbon, Parque das Nações.
2. Internship context
The promise of Big Data Analytics (BDA) has come as a data-centric solution for corporate to strive in this highly competitive and quantitative world. For the last decade, Big Data Analytics has proven its potential to remodel how companies manage and enhance high value businesses performance (Pugna, Dutescu, & Stănilă, 2019). Nowadays, Data is everywhere, mostly, with the advent of Internet of Things (IoT) and Web 2.0 technologies. In 2018, the world created 33 zettabytes of data, and is forecasted to create 20 times more data in 2030 (Armstrong, 2019). In fact, Big Data is big news in most industries, and telecommunication is no exception. Although, Big Data is still in early phase of deployment in telecom, it became a core topic for most telecom executives (Bughin, Reaping the benefits of big data in telecom, 2016). As a fact, telecom operators are capturing more and more data volume and are benefiting from a larger variety of sources than ever before.
Vodafone Portugal, originally born as Telecel in 1992, became a full subsidiary of the British multinational telecommunication conglomerate Vodafone Group since 2003. As one of the world’s largest mobile communication providers, Vodafone Group, has mobile operation in 24 countries, including Portugal, and has partner networks in over 43 more. As of 30 June 2019, Vodafone Group counts a total of approximately 640 million customers across the world, including 4 million in Portugal, which represents around one third of the Portuguese market share (Vodafone, 2019).Vodafone provides to both consumers and businesses a wide range of products such as handsets and communication services such as voice, messaging, internet data and fixed broadband through a series of diverse solutions. Besides that, Vodafone delivers cloud, security and carrier services to enterprise customers.
3 The Portuguese telecom market counts four main operators: Vodafone, NOS and MEO are Mobile Network Operators (MNO) as they own and run on their infrastructures while NOWO is a Mobile Virtual Network Operator (MVNO) as it doesn’t have its own infrastructure and thus rely on MNO’s one.
Figure 1: Vodafone global presence (shaded in red)
3. Research projects
The Big Data & Advanced Analytics team of Vodafone Portugal is composed of 5 to 6 senior data scientists and 1 senior manager. Their main challenge is to extract and leverage valuable insights from the tremendous amount of data generated and collected by Vodafone. Although, the team has a focus on their own big data projects, they also work closely with several departments to assist them in their analytical tasks (e.g. marketing campaigns, reducing churn rate) and with the data engineering team to improve the data pipeline processes as well as developing and maintaining cloud-based solutions. Vodafone Group counts many teams of data scientists based in several countries, in which the company is operating, such as in Portugal, Italy, India, Egypt, U.K and constantly works on improving the cohesion and knowledge-sharing across the different teams.
My 5-months internship can be described as an immersion into the data science area as being into the boots of a data scientist at Vodafone. Core goals of my internship were of learning, discovering and apprehending the daily life, challenges, accomplishments and struggles of a Data scientist at Vodafone Portugal. Throughout my stay in the team, I was supported and
4 guided closely by my supervisor and mentor, Fernando Silva, a senior data scientist whom assigned me projects, goals, objectives, guidelines and advice. In this report, I describe in detail the two projects I have been proposed to work on, that interested me. I invested more or less the same duration for both research projects, which was in between 2 to 3 months per project: from mid-October till end of December and from early January till end of February.
My first assigned research project consisted in studying human mobility from cellular network-based data considering the so-called Call Detail Records (CDR) as a core data source. A call detail record is generated every time a person sends/receives a voice call, a text message or even connects to the internet through its mobile operator. Primarily used for billing purposes and network capacity improvement, these records contain valuable spatiotemporal information, connected cell site and timestamp, respectively. The research use-case consisted in analysing anonymized call detail records that took place in Lisbon. In short, the achieved objectives were to develop from CDR, (1) KPIs that extract spatiotemporal density distribution insights, (2) a geospatial upper scaling approach to determine subscribers’ locations at specific spatial scale and (3) Code testing to ensure and monitor the functionality of the developed functions and KPIs.
My second assigned research project consisted in conducting an observational study of the predictability of mobile subscribers’ demographic traits from their installed mobile applications. To do so, the application focused on the gender of mobile subscribers. Few published papers demonstrate the capability to predict certain demographic traits such as gender or age based on the users’ installed mobile applications. This approach has gained sufficient interest to open this topic considering that Vodafone lacks accurate demographic traits for a subset of its mobile subscribers and motivated by scientific curiosity. In the era of data-driven solution, customer demographic traits such as gender or age play a crucial role for customer centric strategies (e.g. campaign development, market quantification). Therefore, this research project was most of all an exploratory work to evaluate Vodafone capabilities to predict the gender of its mobile subscribers based on their installed mobile applications. This project encompasses the following steps of the data science workflow: Problem understanding, data exploration, data pre-processing, data collection, data preparation, data analysis & visualization, data modelling and models evaluation.
5
4. Internship report outline
This written report includes at its core the two projects I have been working on, during my five months internship, part of the Big Data & Advanced Analytics team of Vodafone Portugal. The report follows a structure in three main chapters:
I. Internship description
II. Project 1: CDR-based location analytics
III. Project 2: Gender prediction from subscribers’ list of installed mobile applications. The first chapter includes the aforementioned three sections (Academic Context, Internship
Context and Research projects) as well as this same section (Internship report outline) and
finally the two following sections (Place of Mobile phone in the modern era and the role of
Big Data in telecom companies). This primary chapter has an introductory role. It defines the
background, context and directions of the whole report as well as giving a first overview of the study area.
The two following chapters are each describing one of the two projects. Both chapters follow a similar structure, which is inspired from the academic model of writing a Master thesis and basically contain the below sections:
➢ Abstract ➢ Introduction ➢ Literature Review ➢ Research definition
➢ Methodology, tools and approach ➢ Experimental Results
➢ Conclusions
The bibliography comes at the end of the report to not surcharge each chapter.
Regarding the specific examples and visualizations of this report, they are all based on synthetic data and not on real data collected by Vodafone.
6
5. Place of mobile phone in the modern era
The global economy has drastically evolved over the past century and a half and the telephone is known as one of the world’s most transformative inventions by mankind. It has revolutionized the way humans communicate across any kind of distances, passing from landlines with fixed locations to connected mobile devices. Nowadays, mobile phones are everywhere. As of today, more than 60% of the world population has a mobile phone connection (Statista, 2019), and since 2015, the number of mobile subscriptions has outnumbered the world population (The World Bank, 2018). In most developed countries, its penetration rate has almost reached 100%, and even in the remote places of developing countries, the use of connected devices is not unusual. Besides that, since 2017, more than half of worldwide website traffic is generated through mobile phones (Statista, 2019).
As one of the most ubiquitous technologies of the modern society, the mobile phone has literally become part of our daily life. From communication to entertainment, mobile devices switching towards “Smartphones” are more and more used as an unavoidable tool to stay connected to others and to instant information. With more than 3 million apps available across Google and Apple digital marketplace, such handy devices are used for a vast number of versatile tasks, making them unique personal assistants equipped with tons of sensors capable of doing a myriad of applications.
In today’s modern society, it is normal to carry your mobile phone everywhere all day and night. Each and every connected device, including the simplest cell phones generate data. Given their ubiquity, increasing functionalities and powerful sensors, mobile devices are ever-increasingly employed in diverseness ways to collect data. Mobile phone datasets have even grown into a stand-alone topic and have already found numerous contributions across a wide number of fields such as in social network, human mobility, urban planning, smart cities, disaster and emergency management. More precisely, a tremendous amount of mobile data is generated and collected by mobile operators and can unveil a lot about the users’ behaviour, activities habits and demographic traits. To name some sources, every text, phone call, internet search, app use or even usage of one’s device’s sensor conduce to the development of big data. It is predicted that by 2020, for every person in the world, more than 6 gigabytes of new information per hour will be created (Marr, 2015).
7 Since more than a decade, the place of mobile phone has opened the door to various empirical studies, as the essence of mobile phones have revealed to be a source of valuable data. Namely, with the use of CDR – Call Detail Records – collected by telecom operators. As already said, CDR contain information about every call, text message and internet connection carried by the operator, listing features such as caller, callee, date, time, duration, interaction type and the geo-location of the cell tower(s) handling the interaction with the cellular network along more features.
6. Role of Big Data in Telecom companies
With the rise in the use of mobile devices, Communication Service Providers (CSP) see massive amount of data at their disposal. With more users and connected devices than ever before, telecom companies constantly need to keep the pace with their environment, so that they can harness the Volume, Variety and Velocity of data coming into their organization. Mobile data has grown over 17-fold over the past 7 years. By 2022, smartphones are expected to surpass 90% of mobile traffic with an annual traffic reaching almost one zettabyte, a zettabyte equal a trillion gigabytes (Cisco, 2019). Becoming a data-driven telecom company requires major cultural shift. Main bottlenecks encountered in big data projects are due to constraints related to the data (in terms of quality, quantity and permissions), talents with lack of required domain knowledge and organization’s culture not sufficiently embracing big data (Bughin, Reaping the benefits of big data in telecom, 2016).
As Carlos Santos, Head of Big Data of Vodafone Portugal said to the Portuguese Journal ‘Jornal de Negócios’, the big challenge stem from the way to extract and take advantage of all this amount of information that is generated. Any big data projects must start with a “smart data plan”. The latter, following a top-down approach, begins with the business problem. From that point, one can start collecting useful data, cross all known techniques in the area of artificial intelligence, statistics and machine learning with the support of distributed computing infrastructures. The recipe needed, to explore and bring out the interpretable insights from these raw data. Finally, a team of data scientists with mix valences matters to be able to transform those insights into actionable business decisions. (Santos, 2017)
As previously mentioned, telecom companies are daily collecting large volumes of various type of data such as from call detail records, mobile phone usage, network equipment, billing and so on, providing lots of information about their customers and network.
8 Big Data enablers are the ways to handle efficiently the data pipelines, namely, the rapidity to process the data, secure it, store it and derive insights from it. After all, how much can telecommunication companies really benefit from big data? Hereafter are few of the key benefits telecom has proven to benefit Big Data Analytics:
❖ Enhanced targeted marketing: Proactively establish customer centric KPIs and develop more personalized and adequate offers (Make use of meaningful customer data); ❖ Customer prediction (Churn): As one of the biggest challenges in the telecom industry,
it aims at identifying customers who are most likely to leave;
❖ Improvement of Network services: ongoing improvement in the network capabilities; ❖ Data Driven improvement of security systems: To prevent fraud detection, ensure
payment processing, data compliance and protection.
❖ Location Analytics: Telecom operators collect a ton of spatiotemporal data which enable location analytics to be applied in a wide range of applications such as in urban planning by identifying how subscribers are moving across a given area (e.g. most visited location), identify locations which require 4G services improvement and so on... Besides that, it opens the door to data monetization opportunities by selling to third-parties location intelligence insights.
The industry is awash in information, but only a few companies manage it effectively. (Bughin, Telcos: The untapped promise of big data, 2016)
9
Chapter 2
10
Abstract
For most of human history, people had limited options for exchanging information with one another or accessing new information. In the past, people had to physically deliver messages, write letters and/or send them with the help of birds or more recently with the use of telegrams. In the last decades, we saw the technology dramatically revolutionizing the way people communicate locally and globally as well as enabling access to instant information. Today, real-time communication is made possible almost anywhere around the globe, and the internet and mobile devices are responsible for a big part. In the modern age, the telecom industry plays a undeniable role in the communication sector. With the advent of Big Data, telecom operators see at their disposal tremendous amount of data from call detail records, mobile phone usage, network, server logs, billing to social networks. Whenever someone makes or receives a call, a text message or turns on his mobile data, a call detail record (CDR) is automatically generated by the cellular carrier. CDR have the particularity of having spatiotemporal references about people’s interactions with the cellular network. Originally collected for billing and network improvement purposes, their usage have taken applications to a wide range of research fields to study different aspects of human mobility. In short, telecom operators see huge amount of data about how, when, with whom (anonymized) and where communications are made each day on a network. This primary research project summarises the applied process of leveraging call detail records to extract spatiotemporal density distribution at specific spatial scale. More concretely, the use-case application consisted in extracting from call detail records such spatiotemporal insights across the 24 parishes of the city of Lisbon, Portugal.
11
1. Introduction
The advent of Big Data technologies, the rise in Internet of Things (IoT) and the widespread adoption of ubiquitous computing by very large portions of the world population, have enabled large-scale human mobility researches (Zhao, et al., 2016). In fact, billions of personal connected devices such as, mobile phones, smartwatch, fitness bracelets or self-driving cars connect us to the cloud, providing rich information to measure people daily mobile routine (Cuttone, Lehmann, & González, 2018). The analysis of mobility data obtained from tracking moving objects, have replace the need of relying on non-scalable and expensive methods like surveys or direct observation to get a glimpse of people movements (Isaacman, et al., 2012). Subsequently, in the last decade, there have been a surge in the number of studies related to human mobility patterns, given their applications into a variety of societal topics, such as in urban planning, traffic forecasting, epidemiology, policy-making, disaster and emergency management. In the literature, a multitude of proxies extracted from mobile phone with spatiotemporal characteristics have been considered to study human mobility, such as Call Detail Records data from mobile operators, GPS and/or WiFi-based data from location-based social networks or third-party mobile apps data such as Twitter or Uber.
In this research project, I address the process of leveraging Call Detail Records data to study human mobility with the particular use-case of developing KPIs which identify the population density distribution across the 24 parishes of Lisbon city, Portugal. Originally collected by mobile operators for billing and network analysis purposes, Call Detail Records (CDR) contain timestamped and geo-referenced logs on all of their subscribers’ interactions with the cellular network, i.e. calls, text message or internet data connection. The main challenges with this data source are that CDR temporal resolution differs for each subscriber according to the mobile phone communication patterns and CDR spatial resolution doesn’t refer to the subscriber location but rather to the handling cell site(s) location. However, given the large availability of CDR for a considerable part of the population, in recent years, several anonymized CDR logs datasets have been widely investigated to perform large-scale human mobility studies.
This primary project describes in detail all the theoretical and practical steps taken throughout the research study with the core goal of using call detail records logs as a proxy to estimate the population density distribution across the 24 parishes of Lisbon, Portugal. Generating such spatiotemporal insights have numerous business applications both for Vodafone internal purposes as well as for external purposes as explained throughout this chapter.
12
2. Literature Review
The project presented in this second chapter ‘CDR-based location analytics’ is related to a considerable number of studies on the analysis of network-based data to study human mobility and more precisely, the extraction of spatiotemporal insights. The exploitation of cellular network data for studying human movements has been an active area of research in the last decade, given the ubiquitous aspect of mobile phones and their worldwide availability (Kujala, Aledavood, & Saramäki, 2016). Indeed, the study of human mobility has particularly attracted the scientific community given its applications across a wide range of fields. Call detail records data have been to the fore, when searched for a proxy to study human mobility. Collected by mobile operators, those records contain non-continuous traces of people when interacting with the cellular network and include enormous amount of information on how, when, where and with whom people communicate on a daily basis.
To name specifically some contributions considering call detail records, there are, post-earthquake geospatial study in Haiti ( (Bengtsson, Lu, Thorson, Garfield, & Von Schreeb, 2011), mapping malaria in Kenya (Wesolowski, et al., 2012), optimizing transport networks in Abidjan (Berlingerio, et al., 2013), CDR analysis for assisting policy intervention to control Ebola epidemic in Guinea (Shibasaki, 2017) and many more which study the process of translating CDR into spatiotemporal insights (Blondel, Decuyper, & Krings, 2015). These contributions include diverse empirical methods, framework and results for extracting spatiotemporal insights from mobility data.
Given the low spatial resolution of call detail records, most of them have in common the process of reconstructing the resolution to a more fine-grained spatial scale. Call detail records do not ‘observe’ people but rather connected devices, and at the handling cell sites spatial resolution when interacting with the cellular network. Besides that, another factor affecting the experimental approaches of those studies are related to the use of real or synthetic data. Indeed, using real data brings up privacy matters of subscribers and enforced data usage laws in the given country where the data is collected. The current European (EU) legislation for personal data and their usage is the General Data Protection Regulation (GDPR), which took effect and was enforced since the 25th May 2018. In its scope, GDPR encompasses pseudonymization of personal data among much more regulations as to safeguard individual privacy (Jones, Daniels, Heys, & Ford, 2019). Although, large-scale human mobility studies usually implies anonymizing and aggregating the call detail records of all mobile subscribers for a given area.
13 In 2016, (Zhao, et al.), investigated the possible caveats and limitations of using CDR for studying human mobility and, although, their conclusions are not black or white, they confirm that the underlying nature of CDR introduce a certain degree of bias given the uneven distribution of people’s communication activities in space over time. In other words, some people interact much more with the cellular network that some others. Their experiments demonstrate that CDR tend to underestimate some mobility indicators such as the total travel distance. CDR scarcity of information is a problematic approached as well by (Fiadino, Ponce-López, Antonio, Torrent-Moreno, & D'Alconzo, 2017), whom studied the situation comparing two datasets collected by Nation-wide operator in 2014 and 2016. Living in the ‘always connected era’, their conclusions are that the quality and volume of CDR data has drastically changed, providing higher temporal accuracy for users’ locations in 2016 compared to 2014. They believe that this path will even continue and grow in the future years, given the increase in mobile communication flat plans from mobile operators.
Considering that CDR underlying spatial characteristic refers to a low resolution, handling cell site instead of subscriber location, researchers demonstrate across their publications different approaches and methodological processes to reach a finer-grained resolution to perform their analysis. The Joint Research Centre Technical Report proposes a systematic methodological framework using mobile phone network-based data, call detail records (CDR) and visitor location register (VLR), using data of multiple mobile network operators (MNOs) for the task of estimating population density distribution at pan-European level (Ricciato, Widhalm, Craglia, & Pantisano, 2015). The ITU report demonstrates the usage of CDR for approaching human mobility to tackle Ebola outbreak in Guinea, by performing a human movement analysis at two scales; city-to-city movement in Guinea and then transboundary movement across neighbouring countries, Guinea, Sierra Leone and Liberia (Shibasaki, 2017). Usage of call detail records to study specifically urban mobility for urban-planning has as well been a hot-topic. There is a study, which takes as example Singapore city, to use call detail records to generate urban micro simulations of individual daily activities and travel for urban and transportation planning purposes (Jiang, Shan, Ferreira, Jr., & Gonzalez, 2017). Another paper, on which experiments were performed in the Greater Maputo metropolitan area in Mozambique, proposes a method to translate CDR into origin-destination trips. As such, computation methods creating visualization of trip generation maps, attraction maps and the Origin-Destination matrix to reconstruct the population distribution and understand their flow pattern (Batran, Mejia, Kanasugi, Sekimoto, & Shibasaki, 2018).
14
3. Essential Telecom GIS concepts
Before going further in this project, it is important to get a good grasp of a few concepts about mobile networks and mobile phone datasets. As such, this section describes fundamentally the following technical concepts: Call detail records, the distinction between cell sites and cell towers, these location-aware data coupled with additional demographic data, IMSI identifier, the shapefile spatial data format and the unit assumption between mobile devices and people.
3.1. Call Detail Records
In telecom, talking about mobile phone dataset to study human mobility, is synonym of using CDR logs. Call detail records (CDR) are metadata about how phone numbers use the cellular network. Whenever a mobile subscriber makes/receives a call, a text message or even simply turns on his mobile data, a call detail record about the interaction itself is generated and collected by the concerned cellular carrier. Call detail records contain both spatial and temporal information. Content excluded, a record typically includes data for the following attributes about the interaction, among many other details:
Table 1: Typical attributes of Call Detail Records
Attributes Description
Caller ID
(e.g. IMSI identifier, Described later in this same section)
ID of user whom triggered the event
i.e. mobile subscriber made a call, send a text message or turned on his internet data
Callee ID (e.g. IMSI identifier) ID of User whom received a call or text message.
Event ID Action that triggered the event.
i.e. call, text message, internet data connection
Direction (Inbound, outbound, none) Specifies if call detail record was incoming, outcoming or none for internet data connection.
Duration Time interval of the entire event.
Cost Monetary cost of the event.
Timestamp
(Temporal attribute)
Datetime when event was recorded.
Cell site ID or coordinates (Spatial attribute)
ID or coordinates of cell site which handled the event with the cellular network.
15 Primarily used for billing purpose and network capacity improvement, telecom operators see at their disposal a huge amount of data about how, when, with whom (anonymized) and where communications are made each day on a network. Through the ever-evolving big data capabilities, CDR huge amount of daily generated data have opened the door to a rich number of researches across different fields such as in social interaction, economic activity or more particularly human mobility, both on individual and population level using disaggregated or aggregated CDR data. Telecom mobile phone data for studying human mobility has been a highly popular topic for the last two decades, thanks to its large-scale data collection process outperforming the traditional non-scalable techniques (e.g. survey) and its ubiquitous capacity to capture the population patterns and movements.
Despite that CDR are biased by the mobile subscribers’ activity degree and that they only pin the location of the connected cell site(s) instead of the subscriber’s exact location at the time of the interaction, several techniques have surged to more accurately unveil human movements and location. Indeed, there is a fairly rich number of published papers about the use of those non-continuous location traces such as for urban planning (e.g. population density), traffic forecasting, commuting patterns or for social good studies such as for disaster and emergency management (e.g. Ebola epidemics in Guinea).
As a matter of fact, CDR by themselves are usually of minimal information for human mobility analysis, as they typically only contain ID or coordinates of the connected cell site. In order to perform a comprehensive analysis, technical information about all cell sites of the operator in the region of interest must be gathered as to properly identify and map out specific network coverage area of all cell sites.
For this reason, gathering for the region of interest (e.g. Lisbon) all cell sites information from the concerned mobile operator is as important as CDR, in order to pursue efficiently the human mobility analysis.
16
3.2. Cell sites and Cell towers
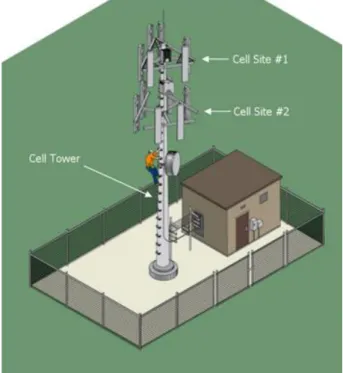
A cell site is a cellular-enabled mobile device which house electronic communications equipment such as transmitter/receiver antennas, GPS, base transceiver station and more. Usually located on top of elevated structures (buildings, hills…) or cell towers built by telecom or tower companies, to ensure a proper elevation of the antennas. It is common to see several cell sites sharing the same structure to enhance the network coverage. Cell sites are more particularly designed to (1) efficiently receive and transmit radio-frequency signals from/to connected devices like cell phones or radio and to (2) handle a multitude of devices, ranging from a dozen to more than a hundred simultaneously, by operating on different radio frequencies. The below figure shows a cell tower with several cell sites collocated on it. Those cell sites can belong to one operator or in some other cases, to several telecom operators.
Whenever someone use his mobile phone to make a call, send a text or even access internet via his mobile service provider, his device emits electromagnetic radio waves that is to be theoretically received by the nearest cell site or another close one to access the cellular network. Signals are then going back and forth through the network to reach and connect the other mobile phone through the callee’s nearest cell site or instead connects to the internet. It is around that time that the call detail record about the interaction is generated and collected by the telecom operator(s). For example, Vodafone collects data for the caller and NOS for the callee.
17 Providing a good network coverage to all mobile subscribers implies having numerous and well-located cell sites. In practice, most are placed in urban areas or in other densely populated geographical locations (cities, suburbs, main roads...), but with their proliferation around the earth, they can be found in lots of rural areas, especially of developed countries. Agreements between operators of different countries are commonly made to allow mobile subscribers to use the network abroad. For example, mobile subscribers with Vodafone Portugal connecting to the cell sites of the operator Orange in Belgium to access the cellular network (i.e. Roaming). Mobile phones are specifically designed to constantly scan nearest cell sites and usually connect to the one with best connectivity, which is shown in the form of signal strength on the mobile phone screen. It is always to the network to make the final call to which cell site a mobile phone connects, based on a set of technical measurements to improve the network connectivity. To name some, the distance between mobile phone and cell site, the connecting technology, landscape features such as buildings or hills, antennas’ signal strength or even that some cell sites are set with reduced antennas’ signal to not interfere with neighbouring cells. As such, a device may usually connect to the nearest cell site of its operator but not necessarily as depending of the overall connectivity among other parameters. Being on the move, mobile phones switch from one cell site to another in order to constantly send/receive information with the cellular network. As said above, although cell sites collocated on a same structure means they share identical coordinates, their antennas often differ in their features, namely, in terms of azimuth (direction), beam width (signal openness) or radius (operating signal distance).
✓ Azimuth – Antenna’s direction. It is specified in the units of degrees (i.e. North is 0°); ✓ Beam width - Antenna’s signal openness (i.e. omnidirectional openness is 360°); ✓ Radius – Maximum distance signal can reach (i.e. 1000 meters from antennas).
3.3. Additional subscribers data
Although, call detail records do not include demographic variables (i.e. age, gender) of mobile subscribers generating them, it is theoretically possible for the operator to merge their CDR with personal customer data. Thus, generating more diverse statistics, such as the gender or age distribution of its subscribers across specific locations and timespan (e.g. shopping mall). However, all data must be anonymized, encrypted before any analysis happen, such approach should be looked in much depth as to respect enforced data regulations and laws related to the use of customer data in the concerned country (e.g. General Data Protection Regulation, GDPR).
18
3.4. International Mobile Subscriber Identity - IMSI
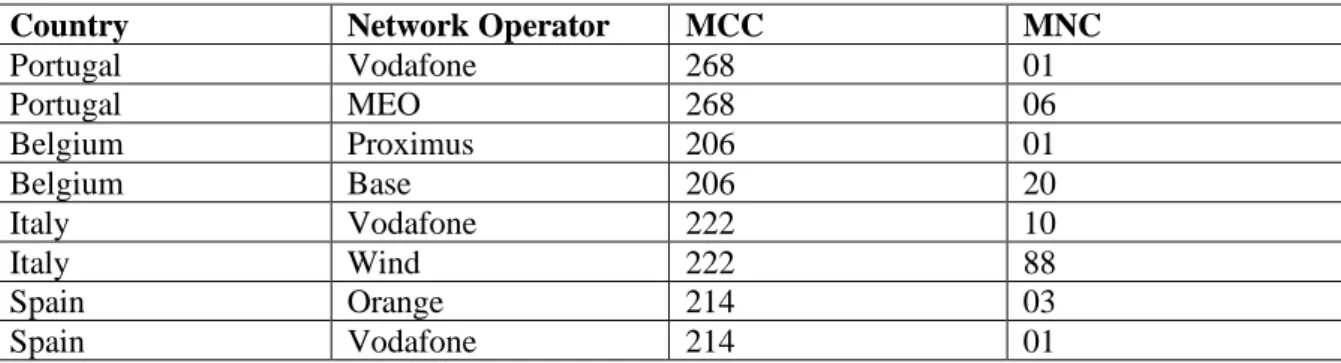
The International Mobile Subscriber Identity (IMSI) is a 15 maximum length unique digit code used to identify any mobile phone subscriber across the globe. It is stored in every SIM card (Subscriber Identity Module). To ensure uniqueness, this code follows a hierarchical structure in the following three components: MCC for Mobile Country Code, MNC for Mobile Network Code and MSIN for Mobile Subscriber Identity Number. Finally, IMSI is associated with all Global System for Mobile Communications (GSM) and Universal Mobile Telecommunication System (UMTS).
❖ Mobile Country Code (MCC) – The MCC has always the primary three digits to identify the country;
❖ Mobile Network Code (MNC) – The MNC follows from one to three digits to identify the network operator;
❖ Mobile Subscriber Identity Number (MSIN) – The MSIN at last has from nine to ten digits to identify the mobile subscriber. (This part is usually encrypted/ anonymized before any analysis happen). Hereafter is a toy example to understand the IMSI:
Figure 3: IMSI hierarchy - Example
In most cases, IMSI is included in all generated call detail records as the identification number to identify every mobile subscribers. Although, the MSIN is usually anonymized to ensure the non-recognition of subscribers. The MCC and MNC are kept as they are, to enable further analysis to identify the subscribers’ country of origin and network operator, respectively. In this project research, IMSI was predominantly used for aggregating CDR per mobile subscriber and for aggregating or filtering CDR per country (e.g. MCC = 268 for Portuguese mobile subscribers or != 268 for all non-Portuguese mobile subscribers/tourists).
19
3.5. Shapefile spatial data format
Shapefile is a popular geospatial vector data format used in Geographic Information System (GIS) and is mostly known for storing location, shape and attributes of geographic features. This format can spatially describe vector features: points, lines and polygons. Those vectors can create the shapes of spatial objects, and together create a representation of the geographic data. For example, points for trees, lines for roads and polygons for lakes. More concretely, points for Vodafone cell sites and polygons for Lisbon parishes or for attributing a network coverage to Vodafone cell sites. The shapefile format is made up of at least four files that are recognized by their extensions: .shp contains the feature geometry, .shx the spatial index linked to each feature, .dbf contains each feature attributes and .prj which has information about projection and coordinate system.
In this project research, the shapefile format was required at several stages of the research project, namely, to spatially represent the 24 parishes of Lisbon and for the so-called Voronoi mapping technique which administrated polygonal network coverage shapes to Vodafone cell sites. (It is explained in much depth later in the report).
3.6. Unit association between people and mobile devices
Strictly speaking, the cellular network does not ‘observe’ people, but rather mobile phones. Although, the easy assumption between mobile phones and people being 1:1 is made, it is not always the case. This assumption is a source of error which can potentially create ‘noise’ in the analysis when leveraging call detail records to estimate the population density in a given area. Nowadays, some people have multiple phones (e.g. one personal and another one for business), and some others do not have any mobile phone. Besides that, it happens that some mobile phones keep fixed location and do not belong to any person (e.g. machine to machine communications).In this initiated research, the assumption made is that each mobile phone belong to one person, and that each person has exactly one mobile phone. This research focuses more in the whole process of leveraging call detail records to generate spatiotemporal insights. This aspect is a limitation that must be approached in much depth in future works.
20
4. Research definition
4.1. Motivations
The core research motivations stemmed from the interest in approaching the current telecom capabilities to geo-localise mobile subscribers as well as in exploiting cellular network-based data to extract human mobility patterns. That is to say that those motivations are mainly coupled with the following societal, technological and academic enablers:
✓ Ubiquitous place of mobile phone in the modern society;
✓ Telecom operators collecting daily spatiotemporal logs of subscribers’ interactions with the cellular network (Call Detail Records being the core data source);
✓ Big Data telecom capabilities to collect, store and process huge amount of daily data; ✓ Telecom operators aware of the richness in their collected customer location data; ✓ Literature on the exploitation of telecom spatiotemporal data to study human mobility. The central components of this location analytics project turned around Call Detail Records (CDR) that contains timestamp and geo-referenced logs of mobile subscribers’ interactions (calls, text messages and internet connection) and the Vodafone cell sites scattered across Lisbon city.
4.2. Application, goal and objectives
Arise from the above motivations, my supervisor oriented me with a concise research baseline encompassing a use-case application with along a goal and objectives that were to be further defined throughout the study.
The use-case application consisted in analysing a week of anonymized call detail records collected by Vodafone that took place in the municipality of Lisbon, Portugal. With the research purpose of learning and applying the process of translating call detail records into spatiotemporal insights.
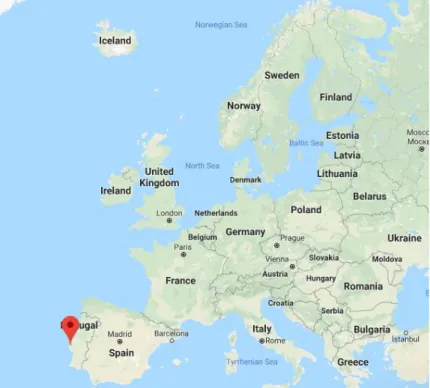
To give some geospatial context, Lisbon is the capital and largest city of Portugal and is composed of 24 civil parishes, as shown in the two illustrations on the next page.
21 Figure 4: Location of Lisbon, Portugal, in Europe
22 The research goal consisted in extracting spatiotemporal density insights in Lisbon and more specifically across the 24 civil parishes of Lisbon. Throughout the study, several objectives derived from the goal as to measure the progress toward the goal and to clarify important steps of the analysis:
✓ Define a Geospatial upper scaling approach:
This objective referred to the low spatial resolution of call detail records. Indeed, every time a subscriber interacts with the cellular network (i.e. call, text message or internet connection), the spatial information collected by the concerned operator only refers to the connected cell site, instead of the actual subscriber location. As per, this objective encompassed a two-step process, which firstly identifies the subscriber location as being within the connected cell site network coverage and secondly, enlarge that spatial resolution to the parish scale. It is described in much depth later in the subsection 6.4. Geospatial upper scaling.
✓ Develop KPIs that translate CDR into spatiotemporal density distribution insights:
This second objective consisted in developing KPIs through functions that translate call detail records into spatiotemporal density distribution of mobile subscribers across the 24 parishes of Lisbon. It includes as well other functions to filter or parse specific call detail records, namely, to filter CDR based on the assumed nationality of mobile subscribers (e.g. Total of n Spanish were in Lisbon on 31st October 2019, and total of n Belgian were in Lisbon on 7th November). The developed statistics only refers to mobile subscribers connecting to Vodafone cell sites. Although, the research project didn’t reach that point, it was thought to extrapolate these statistics to more ‘real/plausible’ counts by considering the telecom operators market share statistics. For example, in Portugal, Vodafone has a market share of around 30% of mobile subscribers and by identifying country and network operator of all subscribers whom connected to Vodafone cell sites, it is possible to extrapolate that count to an estimate of the population count.
✓ Code testing the functions to ensure their functionality as expected:
This third objective consisted in ensuring that the developed functions worked as expected. Performed in parallel with the development of the functions, this process consisted in manual testing and automated testing with the Python library called Pytest.
23
4.3. Business applications
Location analytics has proven to be a key success factor for telecom operators to ensure their competitiveness in the sector. Since 2017, 70% of telecom companies believe that Location Intelligence plays an undeniable role in their business ongoing growth revenue strategies (Columbus, 2017). With numerous business applications to both internal and external purposes, telecom operators see new lucrative opportunities by generating meaningful location analytics. Telecom operators have tremendous data about how, when, with whom (anonymized) and where communications are made each day on their network.
To name some examples, internally, leveraging location data helps supporting marketing decisions (e.g. spatial variable to optimize marketing campaigns), network and infrastructure optimization (e.g. expand network capacity), market segmentation (e.g. cluster areas based on customers revenue), and so on. External purposes are usually categorized under the Data
monetization hood, and refers to the process of providing spatiotemporal insights of people to
third-parties (private and public organizations). As a fact, more and more organizations understand the value to take advantage of, in understanding the spatial distribution of people. By anonymizing and aggregating customer location data and respecting enforced regulations related to the usage of such data (e.g. GDPR), telecom operators are able to freely monetize their data for location intelligence. The primary research project shows the process of leveraging spatiotemporal density distribution of people across the 24 parishes of Lisbon. Such spatiotemporal insights can have a wide array of useful applications to organizations. For example, businesses willing to know better their market in terms of spatial distribution, socio-demographic traits and travel patterns. To the public sector, location intelligence can assist or help developing smart cities strategies, tourist mining (e.g. where do tourists come from? How long do they stay? Where do they stay? How many are they? Where are their point of interest?), in measuring the number of people for a given event (e.g. football match at the stadium), or even in evaluating how people are moving in urban areas (e.g. by bus, by train, during weekday, weekend). This primary project goes in this direction; In the process of leveraging telecom data to be able to extract spatiotemporal density distribution at a specific spatial scale.
24
4.4. KPIs – What statistics to be extracted?
The first step of the study, way before approaching the data, was about the KPIs that were to be developed to extract spatiotemporal insights from CDR along with available data sources. Before having clarified the goal of extracting specifically spatiotemporal density distribution, several directions were opted, based on the literature review, to retrieve human mobility statistics from mobile phone data. This initial step gave me a better sense of the data and its capabilities to extract spatiotemporal insights.
Considering the spatiotemporal capabilities of CDR, the time constraint to work on this project (around 2 months) and the recommendation of my supervisor, we decided to focus my learning in studying the process of extracting spatiotemporal density distribution across the 24 civil parishes of Lisbon. Key Performance Indicators (KPIs) that translate CDR input into spatiotemporal statistics that answer, more generally the following type of questions:
✓ Where? (Location-wise - e.g. per parish, city center, Lisbon airport, football stadium) ✓ When? (Temporal-wise - e.g. Day-wise, hour-wise)
✓ Whom? (anonymized and aggregated)? (e.g. nationality-wise, tourist-wise)
✓ Why? ( Assumption related to the context, e.g. watch a football match at the stadium) More specifically, the KPIs were thought to be (pythonic) functions parametrically designed to answer the following type of questions:
✓ Where are people during a time period?
o E.g. at 8pm, a total of n tourists arrived at the Lisbon airport
o E.g. At 6pm, a total of n people are at the stadium to watch a football match ✓ How is the population distributed geographically across time?
o E.g. Count of people across the 24 parishes of Lisbon across days or hours ✓ Where are the residential and working areas?
o E.g. residential areas considering interactions late in the night and working areas considering interactions during weekday during daytime
✓ Where are the points of interest per time period? (e.g. Shopping mall) ✓ What was the impact of special event? (e.g. Football match at the Stadium) ✓ Where do tourists arrive and leave? (e.g. train station, Lisbon airport) ✓ Where do tourists sleep, go and stay most time?
25
5. Data Sources
This section describes in detail the four specific data sources, provided by my supervisor, that were necessary to perform the human mobility analysis and the development of the KPIs and functions. Below are listed the data sources, followed by a description of each of them:
✓ A week of anonymized call detail records (CDR) logs in a csv file format;
✓ List of Vodafone’s cell sites along with their configuration detail in a csv file format; ✓ List of country and operator names along with their MCC and MNC in a csv file format; ✓ List of 24 Lisbon parishes with their respective geometric shapes as a shapefile format; Important notice related to the data description in this report:
Although Call Detail Records and Vodafone cell sites are described as they were in the studied datasets, synthetic toy data are used for all specific examples and visualizations.
5.1. Call detail records dataset
The studied dataset contained the anonymized mobile phone activity records (CDR) carried by Vodafone that took place in the city of Lisbon during a time span of 7 days. The CDR logs concerned the following two type of mobile subscribers that connected to Vodafone cell sites: (1) Mobile Subscribers with a Portuguese Vodafone SIM card and (2) Mobile subscribers with a non-Portuguese SIM card but roaming in Portugal and accessing the cellular network through Vodafone cell sites (collaboration between different telecom operators aka roaming).
The dataset size was of approximately 6.5 gigabytes, with around +60 million logs/interactions and 11 features to describe every interaction. Although, out of the 11 features, only 8 were of interest in the human mobility analysis and are listed and described below: Start datetime, End datetime, Caller IMSI, Event_ID, Site name, Site ID, City and Cell ID.
Start and end datetime determine when the interaction started and ended with this temporal hierarchy: YearMonthDayHourMinutesSeconds. IMSI being the subscriber ID, it has three components: MCC for the country, MNC for the operator, and MSIN was pseudonymized to anonymize the mobile subscribers. Event_ID relates to the six following types of interaction:
• Inbound call (ID 1); • Outbound call (ID 2); • Location update (ID 3);
• Internet data connection (ID 4); • Inbound text message (ID 5); • Outbound text message (ID 6).
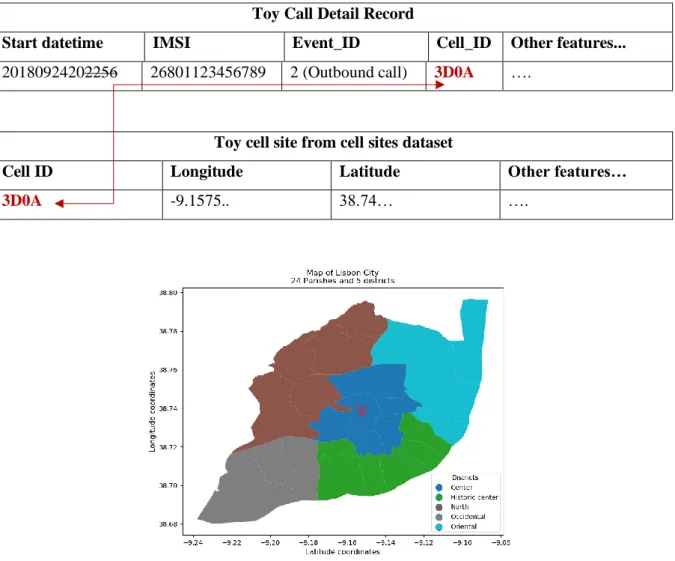
26 Location update is an interaction type that is made at each specific interval hour to update the location of every mobile subscribers. Site ID refers to the named location area (e.g. Ajuda), while City in our case remains static as being Lisbon. Finally, the Cell ID refers to connected cell site. When a call detail record is generated, the location of the connected cell site can be determined by crossing, the cell ID, with the one of the cell site dataset. (It is the following data source explained). Below is a toy example of a CDR log as it appeared in the source file:
Table 2: Example of a Call Detail Record log
Start Datetime End Datetime IMSI Event ID Site Name Site ID City Cell ID
20180924202256 20180924202340 26801123456789 1 Ajuda 3GA Lisbon 3DF1
As shown in the example, CDR by themselves do not contain sufficient information to perform any spatiotemporal analysis, as records lack the spatial aspect by only referring the connected cell site by their ID. As such, information about all cell sites of Lisbon have been gathered in another dataset to properly identify and further map out the network coverage of each cell sites.
5.2. Vodafone cell sites dataset
Along with the CDR, the Vodafone cell sites dataset was essential to perform the human mobility analysis, as together they gather for each subscriber’s interaction, the datetime and location of connected cell site. This studied dataset listed thousands of active cell sites scattered across the city of Lisbon, that are described by a set of 9 features. Hereafter is a description of each feature, a toy example of a cell site as it appeared in the dataset and finally the visualization of those cell sites (toy data for visualization).
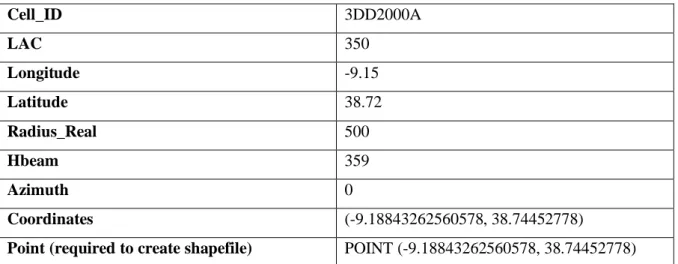
• Cell ID; • MCC; • MNC; • LAC; • Longitude; • Latitude; • Radius_Real; • Azimuth; • Hbeam. Table 3: Toy example of a cell site from the cell site dataset
Cell ID MCC MCN LAC LON LAT Radius_real Hbeam Azimuth
3DD2000A 268 1 350 -9.15 38.72 500 359 0
Cell ID is the reference used to identify each cell site and as a cross-reference with the CDR to be able to determine the location of connected cell sites. MCC and MNC are both components used to identify the country and network operator of the cell sites. Although, as all cell sites belong to Vodafone and are located in Lisbon, those two values were fixed and thus
27 discarded as of no further use. LAC, also called Location Area Code refers to the code given to set of cell sites that are grouped together based on their location. Latitude and Longitude are geographic coordinates to pinpoint cell sites’ exact location. Radius_real refers to cell site antenna’s network distance coverage (e.g. 2 kilometres from Antenna), Azimuth corresponds to the faced direction (e.g. North as 0° or South as 180°) and finally, Hbeam refers to the signal openness which usually vary between 60° to 359° being omnidirectional. Below are two visualizations using toy data, to represent the cell sites by their longitude and latitude. The first visualization is of all cell sites, while the second visualization is of all cell sites onto the map of Lisbon.
Figure 6: Cell sites coordinates