Investigations of Nitrogen Removal Pathways in a Biological Packed Bed Reactor Using Elementary Mass Balances
Antonio Albuquerque1, Jacek Makinia2, Krishna Pagilla3
1Civil Engineering and Architectural Department and C-MADE, University of Beira Interior, PORTUGAL
2Faculty of Civil and Environmental Engineering, Gdansk University of Technology, POLAND 3Civil, Architectural and Environmental Engineering Department, Illinois Institute of
Technology, USA
ABSTRACT
Nitrogen (N) cycle involves a complex set of potential biochemical pathways with reactions catalyzed by different microorganisms. Elementary mass balances for COD, DO, NH4-N and alkalinity were conducted and stoichiometric relationships were investigated to explain possible pathways of the nitrogen removal mechanisms in a lab-scale submerged down flow biological packed bed (BPB) reactor. Four sets of experiments were performed by modifying the organic loading and C/N ratio in comparison with steady-state conditions. Approximately 90% of COD and NH4-N removal occurred in two upper sections occupying 1/5 of the reactor height. The elementary mass balances could not explain all the experimental results with respect to nitrogen removal and oxygen consumption by known mechanisms. The mass balance calculations, excluding the possibility of nitrification, were in general in accordance with the observations indicating no or minimal NO3-N production. The theoretical stoichiometric requirements for nitrification reaction were satisfied in 6 experiments and in another 8 experiments nitrification may have occurred, but stoichiometry was not satisfied. Using C/N ratio as the variable, only at C/N ratio = 10, the predictions confirmed the possibility of nitrification in the same 3 (out of 4) assays as observed in practice. The results of this study reveal that the nitrogen transformations occurring in the studied reactor are complex and cannot be explained by simple mechanisms of microbial assimilation and nitrification.
KEYWORDS
Nitrogen removal, biological packed bed reactor, mass balances, stoichiometry INTRODUCTION
Nitrogen compounds are among the most important pollutants as their discharge to inland and coastal waters may adversely affect water resources in several ways including contribution to eutrophication, depletion of oxygen, toxicity to aquatic environment and public health concerns. Therefore, stringent regulations concerning nitrogen removal from wastewater have been enforced in the European Union (Urban Wastewater Directive 91/271/EEC) and USA (total N = 3 g N/m3 in some regions, e.g. Chesapeake Bay). In order to satisfy these requirements, conventional secondary treatment systems need to be retrofitted or the treatment scheme should be expanded with tertiary polishing treatment.
Application of biological filtration to remove residual nitrogen and oxygen demand in the tertiary step can be a promising alternative to retrofitting (Jeong et al., 2006). The capital cost of adding tertiary treatment is lower in comparison with construction of a new advanced treatment system.
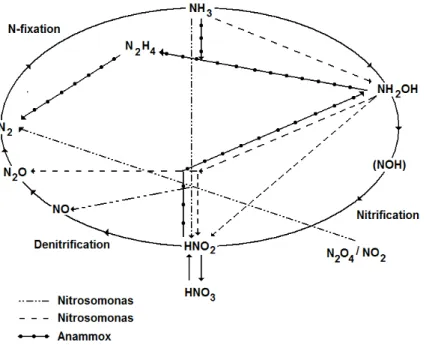
Construction of biological filters does not interfere with operation of existing reactors. Moreover, maintenance is easier as there is no need for sludge recycling and a final clarifier (Hidaka and Tsuno, 2004). Grady et al. (1999) emphasized other numerous advantages of biological filtration, such as a high concentration of active biomass, good control of excess biomass, good efficiency of pollutant (carbon, nitrogen, phosphorous and pathogen) removal combined with a high filtering capacity (without separate settling facilities). Even though biofilters using organic media are known to produce efficient treatment for different types of wastewater, but the nitrogen removal mechanisms implied during biofiltration still remain not well understood (Garzon-Zuniga et al., 2005). In the study of Yu et al. (2007), the nitrogen loss and DO paradox were observed in full-scale biofilters for drinking water treatment. The observed nitrate production and DO consumption were substantially lower compared to the theoretical stoichiometric amounts required for nitrification. The authors suggested that alternate pathways other than nitrification were involved in the nitrogen transformations. For example, assimilation and denitrification were initially mentioned as two possible ways of ammonia and nitrate utilization without consuming dissolved oxygen (DO). The combined nitrification-denitrification processes have been considered to be the most common method for nitrogen removal from wastewater (Paredes et al., 2007). Traditionally, it has been assumed that each of these two processes is attributed to different functional bacterial groups. In fact, the nitrogen cycle pattern may involve a complex set of potential biochemical pathways, as shown in Figure 1, where reactions are catalyzed by different microorganisms.
Figure 1 - Nitrogen cycle including newly discovered processes (adapted from van Loosdrecht and Salem, 2005)
Even though there are still many unknown nitrogen transformations, the discovery of microorganisms capable of oxidizing ammonia under anaerobic conditions (ANAMMOX) has greatly improved the understanding of the revised nitrogen cycle (Ahn, 2006). Moreover, it has also led to the development of novel processes that are based on partial nitrification of ammonia to nitrite combined with anaerobic ammonium oxidation. These processes include the single reactor system for high ammonia removal over nitrite (SHARON) process (sometimes followed by ANAMMOX),
oxygen limited autotrophic nitrification-denitrification (OLAND), completely autotrophic nitrogen removal over nitrite (CANON) and aerobic/anoxic deammonification. These processes were reviewed by Schmidt et al. (2003), Khin and Annachhatre (2004), Ahn (2006) and Paredes et al. (2007).
Other nitrogen removal processes, such as heterotrophic denitrification under aerobic conditions, heterotrophic nitrification and autotrophic denitrification were also reported (Ahn, 2006). Littleton et al. (2003) evaluated the importance of novel processes including autotrophic denitrification and heterotrophic nitrification-aerobic denitrification for nitrogen removal in three biological nutrient removal activated sludge systems. The authors concluded that novel microorganisms were not substantial contributors to nitrogen removal at the plants studied. However, the systems with high biomass retention, such as a variety of biofilm reactors more appropriate for cultivating slowly growing lithoautotrophic organisms, including ANAMMOX bacteria (Ahn, 2006) are very likely. Experimental evidence suggests that the novel processes may play an important role in those systems. For example, substantial nitrogen losses, ranging from 10 to 90%, were found in lab-scale rotating biological contactors (RBC) treating ammonium rich wastewater at low C/N ratios (Helmer and Kunst, 1998; Siegrist et al., 1998; Helmer et al. 1999, Pynaert et al., 2002). In a pilot-scale moving bed biological reactor (MBBR), the observed nitrogen losses were exceeding 90% (Helmer et al. 2001).
A convenient way of defining and understanding what occurs within treatment reactors is the mass balance analysis (Tchobanoglous et al., 2003). In biofilm reactors, global mass balances can be written at the macroscopic level based on the continuity equations over the whole system (Wanner et al., 2006). This approach was used in this study to analyze the long-term operating data for a lab-scale submerged down flow biological packed bed (BPB) reactor. Elementary mass balances for COD, DO, NH4-N and alkalinity were conducted to explain possible pathways of the nitrogen removal mechanisms in the studied BPB reactor.
METHODOLOGY Experimental Set-up
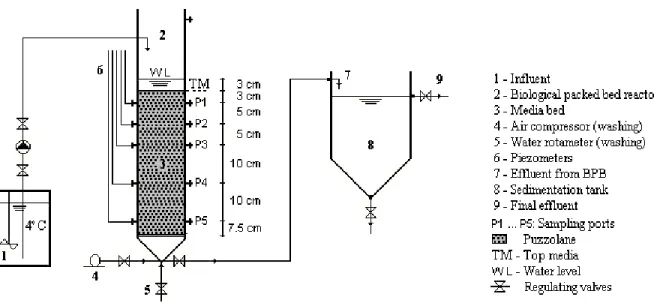
The experimental set-up used in this study consisted of three major elements: refrigerated storage tank with an agitator for a feeding solution, bench-scale biological packed bed (BPB) reactor and a sedimentation tank. The BPB reactor was constructed of tubular acrylic glass of 7 cm internal diameter and 40.5 cm total packing height (Figure 2) in a downward flow configuration. A homogeneous puzzolane material with the porosity of 0.52 was used as support media for biofilm growth. The effective diameter and specific surface area of this material were 4 mm and 1 740 m2/m3, respectively. The media bed was submerged 3 cm below the water level. Five sampling ports (P1 to P5) were provided along the height of the BPB reactor to collect effluent samples for analytical measurements. Another five ports in the same locations were connected to piezometers to evaluate variations in the hydrostatic pressure between the ports. The reactor was also equipped with an external aeration device (TetraTec AP150 pump) with the maximum capacity of 150 L/h, connected between ports P3 and P4, but the air supply system was not used during the period of this study.
Figure 2 - Schematic illustration of the experimental set-up including the submerged BPB reactor)
Feeding Solution
The feeding solution used for colonisation and experiments included a mineral medium (buffer¸ magnesium sulphate, calcium chloride and iron chloride solutions), prepared as proposed by Dang et al. (1989), an oligoelements solution (according to the French standard NF EN 29439, 1993), organic carbon source (sodium acetate), and ammonia nitrogen (ammonia chloride). The concentrated mineral medium had the following composition: buffer solution (8.50 g KH2PO4 + 21.75 g K2HPO4 + 33.40 g Na2HPO4.7H2O + 1.70 g NH4Cl per L), magnesium sulphate solution (22.50 g MgSO4.7H2O per L), calcium chloride solution (36.43 g CaCl2.2H2O per L), iron chloride solution (0.25 g FeCl3.6H2O per 1 L) and oligoelements solution (0.04 g MnSO4.4H2O + 0.06 g H3BO3 + 0.04 g ZnSO2.7H2O + 0.032 g (NH4)6.Mo7O24.4H2O + 0.10 g C10H12FeN2NaO8.3H2O + 0.0555 g EDTA (C10H14N2Na2O8.3H2O) + 0.0445 g FeCl3.6H per L). The concentrated sodium acetate solution (113.4 g C2H3O2Na.3H2O per 1 L) had a COD concentration of 50 kg COD/m3 and a TOC concentration of 20 kg C/m3. The concentrated ammonia chloride solution (76.41 g NH4Cl per 1 L) had a NH4-N concentration of 20 kg N/m3.
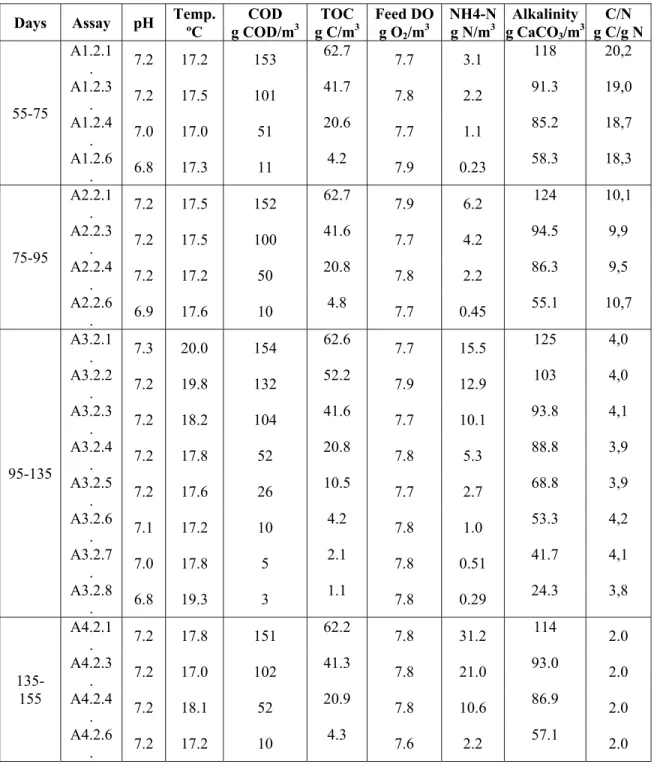
Under the normal operating conditions (excluding the experimental assays), the BPB reactor was fed with the synthetic wastewater with a COD concentration of 100 g COD/m3 (equivalent to 40 g C/m3) and the C/N ratio = 4. The synthetic wastewater was prepared by diluting the concentrated solutions in the following proportions: 2 mL/L of the buffer solution, 0.2 mL/L of the magnesium sulphate solution, 0.2 mL/L of the calcium chloride solution, 0.2 mL/L of the iron chloride solution, 0.2 mL/L of the oligoelements solution, 2 mL/L of sodium acetate solution, and 0.5 mL/L of ammonia chloride solution. For the experiments the feeding solution composition was changed in order to obtain four different C/N ratios in the influent (2, 4, 10 and 20) as shown in Table 1. The appropriate concentrations of COD and NH4-N were obtained by diluting the concentrated solutions of sodium acetate and ammonia chloride according to the volumes presented in Albuquerque (2003). The feeding solution was kept in the storage tank (ISCO FTD 220) at a constant temperature of approximately 4 ºC and pumped to the BPB reactor through a peristaltic pump (ISMATEC MCP CA4).
Table 1 - Operating conditions during the experimental assays
Days Assay pH Temp. COD TOC ºC g COD/m3 g C/m3 Feed g O DO NH4-N Alkalinity C/N 2/m3 g N/m3 g CaCO3/m3 g C/g N 55-75 A1.2.1 . 7.2 17.2 153 62.7 7.7 3.1 118 20,2 A1.2.3 . 7.2 17.5 101 41.7 7.8 2.2 91.3 19,0 A1.2.4 . 7.0 17.0 51 20.6 7.7 1.1 85.2 18,7 A1.2.6 . 6.8 17.3 11 4.2 7.9 0.23 58.3 18,3 75-95 A2.2.1 . 7.2 17.5 152 62.7 7.9 6.2 124 10,1 A2.2.3 . 7.2 17.5 100 41.6 7.7 4.2 94.5 9,9 A2.2.4 . 7.2 17.2 50 20.8 7.8 2.2 86.3 9,5 A2.2.6 . 6.9 17.6 10 4.8 7.7 0.45 55.1 10,7 95-135 A3.2.1 . 7.3 20.0 154 62.6 7.7 15.5 125 4,0 A3.2.2 . 7.2 19.8 132 52.2 7.9 12.9 103 4,0 A3.2.3 . 7.2 18.2 104 41.6 7.7 10.1 93.8 4,1 A3.2.4 . 7.2 17.8 52 20.8 7.8 5.3 88.8 3,9 A3.2.5 . 7.2 17.6 26 10.5 7.7 2.7 68.8 3,9 A3.2.6 . 7.1 17.2 10 4.2 7.8 1.0 53.3 4,2 A3.2.7 . 7.0 17.8 5 2.1 7.8 0.51 41.7 4,1 A3.2.8 . 6.8 19.3 3 1.1 7.8 0.29 24.3 3,8 135-155 A4.2.1 . 7.2 17.8 151 62.2 7.8 31.2 114 2.0 A4.2.3 . 7.2 17.0 102 41.3 7.8 21.0 93.0 2.0 A4.2.4 . 7.2 18.1 52 20.9 7.8 10.6 86.9 2.0 A4.2.6 . 7.2 17.2 10 4.3 7.6 2.2 57.1 2.0
Operation of the Experimental Set-up
The reactor was operated without aeration for the long term (155 days). The operation involved three phases: colonization (phase I), achieving steady state conditions (phase II), and performing experimental assays (phase III).
In phase I, the reactor was inoculated with biomass from an activated sludge system treating municipal wastewater. The colonization of the bed took approximately 15 days in a closed circuit (1 L/h) and discontinuous feeding. Approximately 38.9 mL and 9.7 mL of acetate and ammonia
solutions, respectively, and a proportional volume of the mineral solutions were added to the reactor every 24 h in order to ensure the concentrations of 100 g COD/m3 and 10 g NH
4-N/m3 (C/N = 4). The measurements of DO, pH, temperature, TOC, COD and NH4-N were performed at the end of each cycle before feeding (every second day) in the influent, P2 and the effluent.
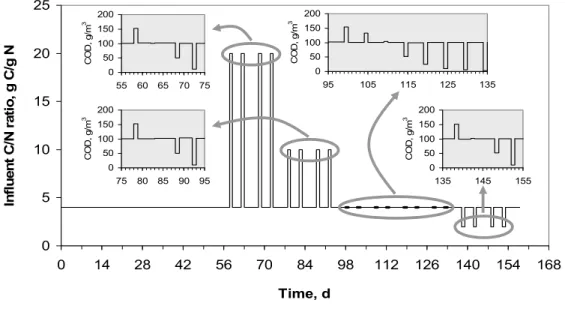
In the second phase, the reactor was operated continuously during 35 days to attain steady state conditions and determine a backwash cycle. The reactor was fed with the feeding solution (100 g COD/m3 and 10 g NH4-N/m3) at the flow rate of 1 L/h (approximately 0.26 m3/m2/h). The measurements of DO, pH, temperature, TOC, COD and NH4-N were performed every 2 days in the influent, P2 and effluent. The hydrostatic pressure was recorded daily from each piezometer. Four series of experiments (altogether 20 assays) were performed during 105 days of phase III by modifying the organic loading and C/N ratio in comparison with the steady-state conditions (Figure 3). Between the experiments, for approximately 4 days (the period required to attain steady-state conditions as shown in Albuquerque, 2003), the reactor feed was the same as that at steady state conditions (i.e. 100 g COD/m3 and 10 g NH
4-N/m3 at the flow rate of 1 L/h). On the 5th day, the operating conditions were modified for each individual experiment as presented in Table 1.
Figure 3 - Schematic illustration of the experimental set-up including the submerged BPB reactor)
The reactor was backwashed every 10 days after performing two assays. A return to the steady-state conditions was observed after 8 hours of the continuous operation. During the steady-state conditions, the measurements of DO, pH, temperature, TOC, COD and NH4-N were performed every 2 days in the influent, P2 and effluent. During each experimental assay, the measurements of DO, pH, temperature, TOC, COD, NH4-N, NO2-N, NO3-N and alkalinity were performed three times, i.e. 12, 16 and 20 h after changing the operating conditions, in the influent, all the sampling ports and the effluent. In addition, during this phase (week 10, 15, 20 and 26), four grains of the media were collected in each of the five sampling ports in order to evaluate the biofilm thickness variations across the bed. The temperature in the BPB reactor was kept constant at approximately 20 ºC during the entire experimental phase.
0 5 10 15 20 25 0 14 28 42 56 70 84 98 112 126 140 154 168 Time, d In fl uent C/ N r at io, g C/ g N 0 50 100 150 200 55 60 65 70 75 CO D , g /m 3 0 50 100 150 200 75 80 85 90 95 CO D , g /m 3 0 50 100 150 200 135 145 155 CO D, g /m 3 0 50 100 150 200 95 105 115 125 135 CO D , g /m 3
Analytical Methods
The measurements of DO, pH and temperature were carried out with the D201 flow through vessel using probes SenTix 41 and CellOx 325 connected to the Multi 340i meter (WTW, Germany). Concentrations of organic carbon were measured as both Chemical Oxygen Demand (COD), by closed reflux digestion and titrimetric method (APHA-AWWA-WEF, 1999), and total organic carbon (TOC) using the TOC-5000 analyzer (Shimadzu, Japan). Concentrations of nitrogen compounds (NH4-N, NO2-N, NO3-N) were determined by spectrophotometry. The first two forms, i.e. NH4-N, NO2-N, were measured according to the Standard Methods (APHA-AWWA-WEF, 1999), whereas NO3-N concentrations were measured using the LCK 339 cuvette test (0.23 - 13.5 g NO3-N/m3) and the Cadas 50 spectrophotometer (HACH LANGE, Germany). Total and volatile suspended solids (TSS and VSS) concentrations were determined using 0.45 μm pore size filters gravimetric method (APHA-AWWA-WEF, 1999). Alkalinity measurements were performed with the titration method (APHA-AWWA-WEF, 1999). The biofilm thickness was evaluated using an electronic microscope (Hitachi S 2700, Japan) after the sample (substratum/biofilm) dehydratation with acetone.
Analysis of Elementary Mass Balances
The experimental data collected during the long-term operation of the BPB reactor were used to calculate and analyze the elementary mass balances for COD, DO, NH4-N and alkalinity. The analysis was conducted according to a 5-step procedure outlined by Tchobanoglous et al. (2003), which includes the definition of a flow diagram, control volume boundaries, pertinent data and assumptions, process rate expressions and basis for the numerical solutions.
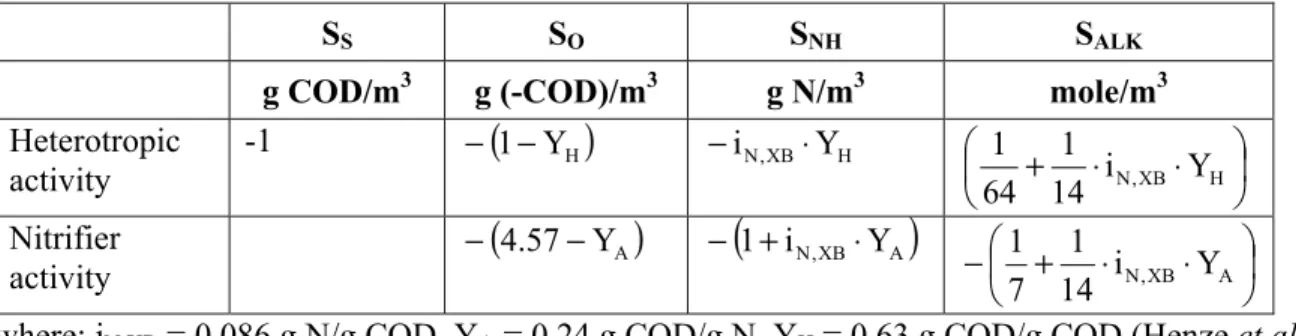
A stoichiometric matrix used for calculations in this study is presented in Table 2. The matrix contains two processes (heterotrophic growth and nitrifier growth) and four components (SS, SO, SNH, SALK). The expressions for stoichiometric coefficients were set in accordance with the Activated Sludge Model no. 1 (ASM1) with a revision for readily biodegradable substrate (acetate) included in the Activated Sludge Model 2d (ASM2d) (Henze et al., 2000). For simplicity, the decay processes of heterotrophs and nitrifiers were not considered in the mass balance analysis.
Table 2 - Stoichiometric matrix of the processes related to the heterotrophic and nitrifier activity
SS SO SNH SALK
g COD/m3 g (-COD)/m3 g N/m3 mole/m3 Heterotropic activity -1 −
(
1−YH)
−iN,XB⋅YH ⎜⎛⎝ + ⋅iN,XB⋅YH⎞⎠⎟ 14 1 64 1 Nitrifier activity −(
4.57−YA)
−(
1+iN,XB⋅YA)
−⎜⎝⎛ + ⋅iN,XB⋅YA⎞⎠⎟ 14 1 7 1where: iN,XB = 0.086 g N/g COD, YA = 0.24 g COD/g N, YH = 0.63 g COD/g COD (Henze et al., 2000)
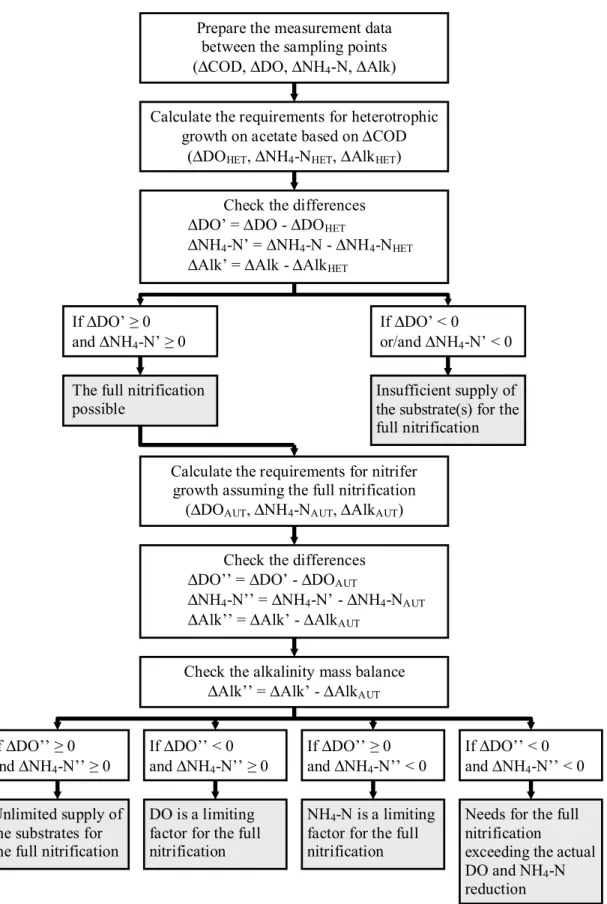
The obtained calculation results were interpreted according to a flowchart presented in Figure 4. In the first step, the theoretical requirements for heterotrophic growth on acetate were calculated based on the observed amount of COD consumed (ΔCOD). When these requirements were satisfied, i.e. ΔDO’≥0 and ΔNH4-N’≥0, the theoretical requirements for nitrifier growth were calculated assuming
the complete nitrification (one-step oxidation of NH4-N to NO3-N). Finally, the limiting factor for nitrifier growth was determined based on the differences (ΔDO’’ and ΔNH4-N’’) of the requirements and available amounts of the substrates. It should be noted that the decision of whether nitrification was possible or not in the theoretical calculations was based in some cases on the second digit after the decimal point. In practice, such low values are below the accuracy limit of measurement devices. Therefore, it was assumed in this study that nitrification could still be possible at a theoretical deficit of up to -0.1 g N/m3 for NH4-N or -0.1 g COD/m3 for DO.
Prepare the measurement data between the sampling points (ΔCOD, ΔDO, ΔNH4-N, ΔAlk)
Calculate the requirements for heterotrophic growth on acetate based on ΔCOD
(ΔDOHET, ΔNH4-NHET, ΔAlkHET)
Check the differences ΔDO’ = ΔDO - ΔDOHET
ΔNH4-N’ = ΔNH4-N - ΔNH4-NHET ΔAlk’ = ΔAlk - ΔAlkHET
Calculate the requirements for nitrifer growth assuming the full nitrification
(ΔDOAUT, ΔNH4-NAUT, ΔAlkAUT)
Check the differences ΔDO’’ = ΔDO’ - ΔDOAUT
ΔNH4-N’’ = ΔNH4-N’ - ΔNH4-NAUT ΔAlk’’ = ΔAlk’ - ΔAlkAUT
If ΔDO’’ < 0 and ΔNH4-N’’ ≥ 0 If ΔDO’’ ≥ 0 and ΔNH4-N’’ < 0 If ΔDO’’ ≥ 0 and ΔNH4-N’’ ≥ 0 If ΔDO’’ < 0 and ΔNH4-N’’ < 0 Check the alkalinity mass balance
ΔAlk’’ = ΔAlk’ - ΔAlkAUT
DO is a limiting factor for the full nitrification
NH4-N is a limiting factor for the full nitrification Unlimited supply of
the substrates for the full nitrification
Needs for the full nitrification
exceeding the actual DO and NH4-N reduction If ΔDO’ ≥ 0 and ΔNH4-N’ ≥ 0 If ΔDO’ < 0 or/and ΔNH4-N’ < 0
The full nitrification
possible Insufficient supply of the substrate(s) for the full nitrification
Figure 4 - Flowchart of a step-wise procedure for calculating the mass balances of substrate, DO, NH4-N and alkalinity
RESULTS
Performance of the BPB Reactor Under Steady State Conditions
The steady-state conditions, in terms of the efficiency of COD and NH4-N removal, were attained in phase II after approximately 8 days of the continuous operation (Figure 5). The average COD concentrations (considering 14 samples and a 95% confidence interval) were 102 (±0), 86 (± 2) and 84 (±1) g COD/m3, respectively, in the influent, P2 and the effluent. The average NH4-N concentrations in the same points were 10.3 (±0.2), 7.7 (±0.1) and 7.4 (±0.1) g N/m3. As it can be seen, the operation of the BPB reactor was characterized by low relative removal efficiencies in terms of bothCOD (17.9%) and NH4-N (28.4%), and approximately 90% of the removal occurred in the upper section of the BPB reactor (TM-P2). The average DO concentrations were stable and equal to 7.5 (±0.1), 0.4 (± 0.1) and 0.3 (±0.05) g O2/m3, respectively, in the influent, P2 and the effluent. The concentrations of TSS and VSS in P2 and in the effluent were 54 (±4) and 38 (±4) g TSS/m3 and 28 (±3) and 16 (±2) g VSS/m3, respectively, which corresponds a ratio VSS/TSS of 0.52 and 0.42, respectively, in these two points.
After 10 days of the operation at steady-state conditions, the head losses in the first two sections (TM-P1 and P1-P2) increased quickly and diminished removal of COD and ammonia occurred due to clogging of the bed (data presented in Albuquerque (2003)). Based on this finding, backwashing was scheduled every 10 days during the continuous operation. After 6 h of backwashing, the COD removal efficiency reached 90% of that observed at steady state, and COD removal was fully recovered after another 2 hours. No negative effects due to backwashing on the removal of COD and ammonia were observed after that period(Albuquerque, 2003).
Figure 5 - COD and NH4-N concentrations in the selected points (influent, P2 and effluent) 0 40 80 120 160 200 0 14 28 42 56 70 84 98 112 126 140 154 168 Time, d C O D, g CO D/ m 3 Influent P 2 Effluent
Phase II Phase III
Phase I a b 0 8 16 24 32 40 0 14 28 42 56 70 84 98 112 126 140 154 168 Time, d NH 4 -N , g N /m 3 Influent P 2 Effluent
Phase II Phase III
Performance of the BPB Reactor During the Experimental Assays
In phase III, the experimental assays performed at the different influent concentrations or C/N ratios compared to the steady-state conditions (Figure 5). The effluent COD and ammonia concentrations changed with varying influent conditions. It was found, however, that the steady-state conditions returned in approximately 15 hours after each assay. Without considering the assays, the average COD concentrations in phase III were 101 g COD/m3 (influent), 85 g COD/m3 (P2) and 83 g COD/m3 (effluent). The corresponding average NH
4-N concentrations were: 10.2 (±0.08) g N/m3 (influent), 7.65 (±0.07) g N/m3 (P2) and 7.41 (±0.05) g N/m3 (effluent). The average removal efficiencies were 16% and 25% for COD and NH4-N. The average DO concentrations were 7.70 (±0.05), 0.50 (± 0.05) and 0.40 (±0.04) g O2/m3 for same three measuring points. All these results remain very close to the observed concentrations in phase II under steady state conditions (see above).
Regardless of the applied C/N ratio, there was no significant removal of NH4-N and COD in the assays with lowest influent COD concentrations from 3 to 11 g COD/m3 and lowest influent NH4-N concentrations from 0.2 to 2.2 g N/m3 (assays A1.2.6., A2.2.6., A3.2.6., A3.2.7., A3.2.8. and A4.2.6.). The DO concentrations were higher than the ones observed under steady-state conditions or in the other assays, ranging from 3.2 to 4.5 O2/m3 (P1), 2.5 to 4.2 O2/m3 (P2) and 2.1 to 4.0 O2/m3 (P3 to effluent).
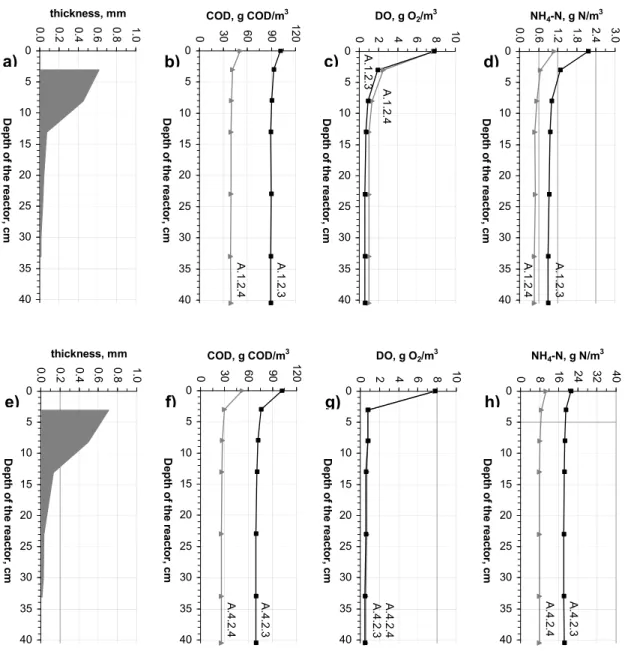
More detailed results of the remaining 14 experimental assays revealed that the removal of COD and NH4-N was only observed in the upper part (i.e. in section 1 and section 2). This is illustrated in Figure 6 showing the vertical profiles of biofilm thickness, COD, DO and NH4-N for four selected assays. As it can be seen, the development of biofilm was explicitly associated with the availability of DO. The measured biofilm thickness in P1 and P2, during steady-state conditions was 0.72 ± 0.10 mm (P1) and 0.51 ± 0.05 mm (P2), whereas the DO concentrations in these points, for experiments with COD concentrations over 10 g COD/m3, ranged from 0.8 to 1.9 g O2/m3 (P1) and from 0.6 to 1.1 g O2/m3 (P2). In the remaining points, the biofilm was relatively thin (<0.10 mm) and the DO concentrations ranged from 0.4 to 1 g O2/m3 (P3 to effluent).
In section 1 of the reactor (TM-P1), the amounts of NH4-N and COD removed in the 14 experimental assays were strongly correlated (r2 = 0.86) at the ratio of 0.094 g NH
4-N/g COD. This value is very close to the ASM1 default value of the conversion factor indicating the content of nitrogen per COD biomass, iN,XB = 0.086 g N/g COD (Henze et al., 2000). In section 2 of the reactor (P1-P2), the calculated value of the ratio was 0.169 g NH4-N/g COD (r2 = 0.78) indicating that the amount of NH4-N removed exceeded the nitrogen requirements for biomass assimilation. It should be noted, however, that no NH4-N removal was observed in both sections in the experiments with the influent COD concentration below 10 g COD/m3. In these cases, the amounts of COD removed in section 1 and section 2 did not exceed 2.5 and 0.5 g COD/m3, respectively.
Both oxidized forms of nitrogen (NO2-N and NO3-N) were only detected in the upper part of the biofilm, but not in the all experimental assays. Very low concentrations of NO2-N (0.10-0.30 g N/m3) were measured in P2 in only 7 assays, but none was found in P1. NO3-N appeared in 15 assays and the concentration was up to 2.05 and to 2.15 g N/m3, in section 1 (TM-P1) and section 2 (P1-P2), respectively. Despite the different C/N ratios utilized in the assays, a strong linear relationship (r2 = 0.86) was found in section 1 (TM-P1) between the amount of NH
4-N utilized and NO3-N produced (= 0.79 g NO3-N/g NH4-N) while considering all the 20 experiments. For the assays with the ratio C/N = 2, 4 and 10, the correlations were higher than the average value, and the
calculated r2 coefficients were 0.96, 0.93 and 0.97, respectively. In section 2, the concentrations of NO3-N increased only slightly or even dropped in comparison with section 1. Occasionally (7 assays), low NO3-N concentrations (up to 0.53 g N/m3) were also detected in P3.
Figure 6 - Vertical profiles of COD, DO and NH4-N concentrations and biofilm thickness
during the selected experimental assays (a-d - assays 1.2.3-1.2.4, e-h – assays 4.2.3-4.2.4) Mass Balance Calculations
Using the stoichiometric matrix (Table 2) and measured consumptions of substrate (SS), DO (SO) and NH4-N (SNH) in sections 1 and 2, the elementary mass balances of those components were calculated according to the flow chart presented in Figure 4. In addition, the mass balances for alkalinity were also considered. The results of these calculations are listed in Table 3 (section 1) and Table 4 (section 2). 0 30 60 90 120 0 5 10 15 20 25 30 35 40 D ep th o f th e r eacto r, cm COD, g COD/m3 A .1. 2. 3 A .1. 2. 4 0 2 4 6 8 10 0 5 10 15 20 25 30 35 40 D ep th o f th e r eacto r, cm DO, g O2/m3 A .1. 2. 3 A. 1.2 .4 0. 0 0.6 1.2 1.8 2.4 3.0 0 5 10 15 20 25 30 35 40 D ep th o f th e r eacto r, cm NH4-N, g N/m3 A .1. 2. 3 A .1. 2. 4 0. 0 0.2 0.4 0.6 0.8 1.0 0 5 10 15 20 25 30 35 40 D ep th o f th e r eacto r, cm thickness, mm a) b) c) d) e) 0. 0 0.2 0.4 0.6 0.8 1.0 0 5 10 15 20 25 30 35 40 D ep th o f th e r eacto r, cm thickness, mm 0 30 60 90 120 0 5 10 15 20 25 30 35 40 D ep th o f th e r eacto r, cm COD, g COD/m3 A .4. 2. 3 A .4. 2. 4 0 2 4 6 8 10 0 5 10 15 20 25 30 35 40 D ep th o f th e r eacto r, cm DO, g O2/m3 A .4. 2. 3 A .4. 2. 4 0 8 16 24 32 40 0 5 10 15 20 25 30 35 40 D ep th o f th e r eacto r, cm NH4-N, g N/m3 A .4. 2. 3 A .4. 2. 4 f) g) h)
Assay
C/N ratio
(experimental data) (heterotrophic) Deficit/surplus
Nitrification occurrence*
Limiting factor
(autotrophic) Total deficit/surplus
SS SO SNH SALK SO SNH SALK SO SNH SALK SO SNH SALK SO SNH SALK
g COD/m 3 g (-COD)/m 3 g N/m 3 g CaCO 3 /m 3 g (-COD)/m 3 g N/m 3 g CaCO 3 /m 3 g (-COD)/m 3 g N/m 3 g CaCO 3 /m 3 g (-COD)/m 3 g N/m 3 g CaCO 3 /m 3 g (-COD)/m 3 g N/m 3 g CaCO 3 /m 3 1.2.6. 1.3 3.8 0.00 -1.1 0.48 0.07 -2.53 3.32 -0.07 1.43 P 3.32 -0.07 1.43 1.2.4. 9.5 5.2 0.42 -11.0 3.52 0.51 -18.52 1.68 -0.09 7.52 P 1.68 -0.09 7.52 1.2.3. 20 7.9 5.9 0.88 -11.0 2.92 0.43 -15.40 2.98 0.45 4.40 Y NH4-N 1.95 0.45 6.49 1.03 0 -2.09 1.2.1. 16.0 5.9 0.73 -11.1 5.92 0.87 -31.19 -0.02 -0.14 20.09 P -0.02 -0.14 20.09 2.2.6. 1.0 4.5 0.00 -1.0 0.37 0.05 -1.95 4.13 -0.05 0.95 P 4.13 -0.05 0.95 2.2.4. 11.2 6.6 0.62 -8.9 4.14 0.61 -21.83 2.46 0.01 12.93 Y NH4-N 0.04 0.01 0.14 2.42 0 12.79 2.2.3. 10 15.6 5.9 1.32 -10.1 5.77 0.85 -30.41 0.13 0.47 20.31 Y DO 0.13 0.03 0.43 0 0.44 19.88 2.2.1. 16.7 6.3 1.40 -14.3 6.18 0.90 -32.56 0.12 0.50 18.26 Y DO 0.12 0.03 0.43 0 0.47 17.83 3.2.8. 0.0 3.3 0.00 0.0 0.00 0.00 0.00 3.30 0.00 0.00 P 3.3 0 0 3.2.7. 0.1 3.6 0.00 -0.3 0.04 0.01 -0.19 3.56 -0.01 -0.11 P 3.56 -0.01 -0.11 3.2.6. 2.1 3.8 0.00 -2.1 0.78 0.11 -4.09 3.02 -0.11 1.99 N 3.02 -0.11 1.99 3.2.5. 10.2 6.6 0.31 -5.7 3.77 0.55 -19.88 2.83 -0.24 14.18 N 2.83 -0.24 14.18 3.2.4. 11.5 6.8 1.06 -9.2 4.26 0.62 -22.42 2.54 0.44 13.22 Y NH4-N 1.91 0.44 6.35 0.63 0 6.87 3.2.3. 4 15.7 6.3 1.95 -10.9 5.81 0.85 -30.61 0.49 1.10 19.71 Y DO 0.49 0.11 1.59 0 0.99 18.12 3.2.2. 17.4 6.4 2.15 -11.3 6.44 0.94 -33.92 -0.04 1.21 22.62 P -0.04 1.21 22.62 3.2.1. 18.7 6.7 2.04 -17.2 6.92 1.01 -36.46 -0.22 1.03 19.26 N -0.22 1.03 19.26 4.2.6. 2.7 5.1 0.11 -2.3 1.00 0.15 -5.26 4.10 -0.04 2.96 P 4.1 -0.04 2.96 4.2.4. 22.5 7.0 1.97 -9.7 8.33 1.22 -43.86 -1.33 0.75 34.16 N -1.33 0.75 34.16 4.2.3. 2 26.3 7.0 2.16 -12.6 9.73 1.42 -51.27 -2.73 0.74 38.67 N -2.73 0.74 38.67 4.2.1. 28.1 7.0 2.44 -15.8 10.40 1.52 -54.78 -3.40 0.92 38.98 N -3.4 0.92 38.98
* Y – yes, N – no, P - posible
129
Nutrient Removal 2009
Assay
C/N ratio
(experimental data) (heterotrophic) Deficit/surplus
Nitrification occurrence*
Limiting factor
(autotrophic) Total deficit/surplus
SS SO SNH SALK SO SNH SALK SO SNH SALK SO SNH SALK SO SNH SALK
g COD/m 3 g (-COD)/m 3 g N/m 3 g CaCO 3 /m 3 g (-COD)/m 3 g N/m 3 g CaCO 3 /m 3 g (-COD)/m 3 g N/m 3 g CaCO 3 /m 3 g (-COD)/m 3 g N/m 3 g CaCO 3 /m 3 g (-COD)/m 3 g N/m 3 g CaCO 3 /m 3 1.2.6. 0.4 0.2 0.00 -0.5 0.15 0.02 -0.78 0.05 -0.02 0.28 P 0.05 -0.02 0.28 1.2.4. 1.3 1.2 0.12 -3.9 0.48 0.07 -2.53 0.72 0.05 -1.37 N 0.72 0.05 -1.37 1.2.3. 20 2.7 1.3 0.24 -7.5 1.00 0.15 -5.26 0.30 0.09 -2.24 N 0.3 0.09 -2.24 1.2.1. 2.1 1.2 0.21 -9.5 0.78 0.11 -4.09 0.42 0.10 -5.41 N 0.42 0.1 -5.41 2.2.6. 0.3 0.5 0.00 -0.7 0.11 0.02 -0.58 0.39 -0.02 -0.12 P 0.39 -0.02 -0.12 2.2.4. 2.7 0.1 0.26 -7.8 1.00 0.15 -5.26 -0.90 0.11 -2.54 N -0.9 0.11 -2.54 2.2.3. 10 2.9 1.0 0.49 -10.0 1.07 0.16 -5.65 -0.07 0.33 -4.35 P -0.07 0.33 -4.35 2.2.1. 4.1 1.0 0.68 -9.6 1.52 0.22 -7.99 -0.52 0.46 -1.61 N -0.52 0.46 -1.61 3.2.8. 0.2 0.3 0.00 -1.3 0.07 0.01 -0.39 0.23 -0.01 -0.91 P 0.23 -0.01 -0.91 3.2.7. 0.0 0.5 0.00 0.0 0.00 0.00 0.00 0.50 0.00 0.00 P 0.5 0 0 3.2.6. 0.3 1.5 0.00 -0.6 0.11 0.02 -0.58 1.39 -0.02 -0.02 P 1.39 -0.02 -0.02 3.2.5. 1.8 0.3 0.18 -5.2 0.67 0.10 -3.51 -0.37 0.08 -1.69 N -0.37 0.08 -1.69 3.2.4. 1.8 0.2 0.38 -7.4 0.67 0.10 -3.51 -0.47 0.28 -3.89 N -0.47 0.28 -3.89 3.2.3. 4 2.8 0.6 0.57 -10.8 1.04 0.15 -5.46 -0.44 0.42 -5.34 N -0.44 0.42 -5.34 3.2.2. 2.6 0.7 0.60 -9.3 0.96 0.14 -5.07 -0.26 0.46 -4.23 N -0.26 0.46 -4.23 3.2.1. 4.3 0.3 0.57 -8.0 1.59 0.23 -8.38 -1.29 0.34 0.38 N -1.29 0.34 0.38 4.2.6. 0.3 0.0 0.00 -0.5 0.11 0.02 -0.58 -0.11 -0.02 0.08 N -0.11 -0.02 0.08 4.2.4. 2.8 0.0 0.51 -7.6 1.04 0.15 -5.46 -1.04 0.36 -2.14 N -1.04 0.36 -2.14 4.2.3. 2 3.8 0.0 0.45 -9.2 1.41 0.21 -7.41 -1.41 0.24 -1.79 N -1.41 0.24 -1.79 4.2.1. 3.1 0.2 0.81 -9.1 1.15 0.17 -6.04 -0.95 0.64 -3.06 N -0.95 0.64 -3.06
* Y – yes, N – no, P - possible
130
Nutrient Removal 2009
The elementary mass balances could not explain all the experimental results. In section 2, most of the mass balance calculations, excluding the possibility of nitrification, were in general in accordance with the observations indicating no or minimal NO3-N production (see above). In section 1, the theoretical requirements for nitrification were only satisfied in 6 assays (plus 8 “possible” cases) compared to the measurement results revealing NO3-N production in 15 assays. Only at the ratio C/N = 10, the predictions confirmed the possibility of nitrification in the same 3 (out of 4) assays as observed in practice. It should be noted that the inconsistency between the theoretical calculations and measurements occurred at the highest ratio C/N = 20 and low C/N ratios (= 2 and 4) with high consumptions of the substrate, i.e. 22-28 g COD/m3 for C/N = 2 and 17-19 g COD/m3 for C/N = 4. Simultaneously, alkalinity was utilized at the ratio of 0.54 g CaCO3/g COD (r2 = 0.77) which is in accordance with the effect of acetate utilization but in contrast with the need for nitrification. The limitation of DO appeared to be a critical factor in section 1 and the production of NO3-N may indicate a successful competition of nitrifiers for DO, which in contrast to the traditional hypothesis that nitrifiers are outcompeted by heterotrophs for DO. Moreover, the lack of nitrification predicted at the ratio C/N = 20 remains in accordance with the simulation results of Wanner et al. (2006). The authors examined four different biofilm models of interaction between aerobic heterotrophs and nitrifiers, and concluded that net synthesis of heterotrophic biomass consumes most of the NH4-N, eliminating nitrification and nitrifiers in the considered situation.
DISCUSSION
The results of this study reveal that the nitrogen transformations occurring in the aerobic BPB reactor are complex and cannot be explained by simple mechanisms of microbial assimilation and nitrification. The aim of this section is to give insight into alternate metabolic pathways leading to nitrogen removal in biofilm systems, but without providing the ultimate judgment with regard to the studied BPB. In literature, several new pathways have been reported (e.g. Schmidt et al., 2003; Khin and Annachhatre, 2004; Ahn, 2006; Paredes et al., 2007). Table 5 summarizes the characteristics of possible processes occurring in such systems and their effects on the mass balance calculations. Paredes et al. (2007) pointed out that attached biomass growth occurs in “mosaic macro- and microgradient systems”. Khin and Annachhatre (2004) demonstrated that metabolic pathways for the conventional nitrification-denitrification and ANNAMOX are complex and may consist of 8 and 5 steps (reactions), respectively.
In biofilm systems, low DO concentrations usually lead to a stable, up to 100% NO2-N accumulation (Paredes et al., 2007). Furthermore, the authors hypothesized based on a literature review that NO2 -N oxidizers are more exposed to oxygen limiting conditions than -NH4-N oxidizers. This may be due to a higher oxygen saturation constant and/or specific spatial distribution of microorganisms, i.e. NH4-N oxidizers are located outside the biofilm, whereas NO2-N oxidizers are found in the deeper layer of the biofilm. This is in contradiction to a general opinion that the faster growing heterotrophs tend to dominate the outer part of a biofilm, while nitrifiers occur along with inerts closer to the substratum (Wanner et al., 2006).
Khin and Annachhatre (2004) pointed out that under DO limited conditions (< 0.5% air saturation) a co-culture of aerobic and anaerobic NH4-N oxidizing (ANAMMOX) bacteria can be established, and this system is responsible for the process termed CANON, OLAND or aerobic deammonification (Table 6). The interaction of aerobic and anaerobic NH4-N oxidizing bacteria under DO limited conditions results in almost complete conversion of NH4-N to N2 gas, whereas only small amounts of NO3-N are produced. It should be noted that the ANAMMOX bacteria are very sensitive to DO and the concentrations higher than 0.06 g O2/m3 were found to inhibit the ANAMMOX activity completely
but reversibly (Paredes et al., 2007). This is another unfavorable factor for the growth of these bacteria, in addition to a very low maximum growth rate constant, μAN = 0.072 d-1 at 30°C (Jetten et al., 1998). Yu et al. (2007) observed in full-scale drinking water biofilters that the actual NO3-N production and DO consumption were substantially lower compared to the theoretical stoichiometric requirements (“the nitrogen loss and DO paradox”). The authors hypothesized that this inconsistency may be attributed to alternate, non-nitrifying pathways. In contrast to the initial assumptions, assimilation and conventional denitrification were excluded as possible mechanisms based on the lack of correlation between the nitrogen loss and utilization of phosphate (as a microbial nutrient) and COD removal, respectively. The ‘‘aerobic deammonification’’ was identified as the most probable mechanisms that could well explain the nitrogen loss and DO paradox. According to this mechanism, approximately 57% of the removed NH4-N was associated with the complete nitrification, whereas approximately 21% of the removed NH4-N was incompletely oxidized to NO2 -N. The latter served then as an electron acceptor in the ANAMMOX process with the remaining NH4-N removed (approximately 21%) acting as the electron donor. However, the authors did not consider aerobic denitrification (Table 6) and assumed that “most of the removed COD was not oxidized by nitrate, but aerobically degraded”.
In theory, also a combination of anaerobic NH4-N oxidation and denitrification can easily be obtained in biofilm systems at low oxygen concentrations (Paredes et al., 2007). In contrast to conventional denitrification processes, where the organic carbon could become a limiting factor because the electron donor for denitrification is more rapidly oxidized than NH4-N. This problem does not exist in systems (CANON, OLAND and aerobic deammonification) with NH4-N as the electron donor. The authors also pointed out that the ANAMMOX bacteria are also very sensitive to the presence of some organic carbon sources, such as alcohols, especially methanol. On the other hand, volatile fatty acids (VFA) including propionate and potentially acetate were demonstrated to be converted by the ANAMMOX bacteria. Propionate was oxidized by the ANAMOX bacteria with nitrate and/or nitrite as the electron acceptor in parallel to anaerobic oxidation of NH4-N. In an ANAMMOX enriched culture cultivated with propionate for long term, the amount of ANAMMOX cells and denitrifiers did not change significantly over time. Therefore, the authors concluded that the ANAMMOX bacteria could compete successfully with the heterotrophic denitrifiers for the VFA.
Ahn (2006) discussed two other mechanisms, including aerobic denitrification and autotrophic denitrification (Table 6), that contributed to nitrogen loss in the studied systems. In the first case, Pseudomonas bacteria isolated from the activated sludge of a sequencing batch reactor treating piggery wastewater were capable of rapidly reducing NO3-N to N2 gas without NO2-N accumulation under aerobic conditions. In the second case, Nitrosomonas-like microorganisms were found to nitrify and denitrify (using H+ as the electron donor and NO2-N as the electron acceptor) simultaneously even under fully oxic or anoxic conditions with N2 gas as the main final product. Other possible pathways for ammonia loss from the BPB that do not lead to nitrate or N2 could be due to short-circuiting of nitrification and denitrification pathways into gas phase NO and N2O through nitrite reduction (see the reactions below) (Colliver and Stephenson, 2000). Although, the mechanisms of these pathways are still under investigation and should be carefully considered in future research of BPB reactors under DO limiting conditions.
O H NO e H 2 NO2− + + + − ⎯⎯→ + 2 O H 1 O N 1 e H NO+ + + − ⎯⎯→ +
Process substrates N Requirements DO Organic carbon Alkalinity products N
Full (one-step) nitrification NH4-N 4.57 mg O2/ mg NH4-N
3.43 mg O2/ mg NH4-N (nitritation) None. Consumed: 7.1 mg CaCO3/ mg NH4 -N 7.1 mg CaCO3/ mg NH4 -N (nitritation) NO3-N
Partial nitrification (SHARON) NH4-N 3.43 mg O2/mg NH4-N None. Consumed:
3.6 mg CaCO3/mg NH4 -N NH4-N NO2-N Conventional denitrification NO3-N NO2-N
None. For acetic acid:
2.08-3.7 mg COD/mg NO3-N 1.56-2 mg COD/mg NO2-N Produced: 3.6 mg CaCO3/mg NO3 -N N2
Aerobic nitrifier denitrification in the presence of NOX (NOX processes)
NH4-N
NO2-N
2.3 mg O2/ mg NH4-N Only for the
denitrification step Consumed: 3.6 mg CaCO3/mg NH4 -N NO2-N N2 Anammox NH4-N NO2-N
None. None. Produced:
3.3 mg CaCO3/mg NH4
-N
NO3-N
N2
CANON (combination of partial nitrification and Anammox) NH4-N 2.3 mg O2/mg NH4-N None. Consumed: 3.68 mg CaCO3/mg NH4-N NO3-N N2
OLAND/aerobic deammonification (combination of partial nitrification and aerobic denitrification)
NH4-N 1.71 mg O2/mg NH4-N (OLAND) 2.3 mg O2/mg NH4-N (aerobic deammoninfication) None. Consumed: 3.6 mg CaCO3/mg NH4 -N (OLA-ND) None (aerobic denitrification) NO2-N N2 133 Nutrient Removal 2009
CONCLUSIONS
The long-term operation of the BPB reactor was characterized by stable but low relative removal efficiencies in terms of bothCOD (<20%) and NH4-N (<30%). Approximately 90% of the removal occurred in the upper part (section 1 and section 2) of the studied reactor and the development of a thick biofilm in these sections was explicitly associated with the availability of DO.
A special step-wise procedure was developed to calculate the elementary mass balances for substrate, DO, NH4-N and alkalinity, and analyze the relationships between these variables in the expected nitrogen transformations under aerobic conditions (i.e. biomass assimilation and nitrification). However, the elementary mass balances could not explain all the ambiguous experimental results, especially in the latter phase of the experimental assays, and other pathways of nitrogen removal had to be involved.
In terms of revising the conventional nitrogen cycle and discovering the novel removal processes, many uncertainties have arisen about the nitrogen removal pathways occurring in biofilm systems, such as the studied BPB reactor. Therefore, further research should be planned using an interdisciplinary approach and combining expansion of the experimental procedures with the measurements of gaseous compounds (NO, N2O, N2), development of mechanistic models of the newly discovered processes as well as identification of microbial groups through molecular analyses and fluorescent in situ hybridization (FISH).
REFERENCES
Ahn Y. (2006) Sustainable Nitrogen Elimination Biotechnologies: A Review. Process Biochemistry, 41, 1709–1721
Albuquerque, A. (2003) Contribution to the Study of Residual Carbon Removal in Downflow Biological Packed Beds. PhD thesis, University of Beira Interior, Covilha, Portugal, 469 pp. (in Portuguese)
APHA-AWWA-WEF (1999) Standard Methods for the Examination of Water and Wastewater. 20th edition, American Public Health Association, Washington, DC, USA, 1325 pp.
Colliver, B.B., and Stephenson, T. (2000) Production of nitrogen oxide and dinitrogen oxide by autotrophic nitrifiers, Biotechnol. Adv. 18 (3), pp. 219–232.
Dang, J.; Harvey, D.; Lobbary, A. and Grady Jr, C. (1989) Evaluation of Biodegradation Kinetic with Respirometric Data. Res. J. Water Poll. Cont. Fed., 61(11/12), 1711-1721.
Garzon-Zuniga, M., Lessard, P., Aubry, G. and Buelna G. (2005) Nitrogen Elimination Mechanisms in an Organic Media Aerated Biofilter Treating Pig Manure. Environ. Technol., 26, 361-371.
Grady, C.P.L. Jr., Daigger G.T. and Lim H.C. (1999) Biological Wastewater Treatment. Second Edition, Revised and Expanded. Marcel Dekker, New York (USA).
Helmer, C. and Kunst, S. (1998) Simultaneous Nitrification/Denitrification in an Aerobic Biofilm System. Wat. Sci. Tech., 37(4-5), 183-187.
Helmer, C., Kunst, S., Juretschko, S., Schmid, M.C., Schleifer, K.H. and Wagner, M. (1999) Nitrogen Loss in a Nitrifying Biofilm System. Wat. Sci. Tech., 39(7), 13-21.
Helmer. C., Tromm, C., Hippen, A., Rosenwinkel, K.-H, Seyfried, C.F. and Kunst, S. (2001) Single Stage Biological Nitrogen Removal by Nitritation and Anaerobic Ammonium Oxidation in Biofilm Systems. Wat. Sci. Tech., 43 (1), 311-320.
Henze, M., Gujer W., Mino T. and van Loosdrecht M. (eds.) (2000) Activated Sludge Models ASM1, ASM2d and ASM3. Scientific and Technical Report No. 9. IWA Publishing, London (UK).
Hidaka, T. and Tsuno, H (2004) Development of a Biological Filtration Model Applied for Advanced Treatment of Sewage. Wat. Res., 38, 335–346.
Jeong, J., Hidaka, T., Tsuno, H. and Oda, T. (2006) Development of Biological Filter as Tertiary Treatment for Effective Nitrogen Removal: Biological Filter for Tertiary Treatment. Wat. Res., 40, 1127-1136.
Jetten, M.S.M., Strous, M., Van De Pas-Schoonen, K.T., Schalk, J., Van Dongen, U.G.J.M., Van De Graaf, A.A., Logemann, S., Muyzer, G., Van Loosdrecht, M.C.M. and Kuenen, J.G. (1998) The anaerobic oxidation of ammonium. FEMS Microbiol. Rev., 22, 421-437.
Khin, T. and Annachhatre, A. (2004) Novel Microbial Nitrogen Removal Processes. Biotechnology Advances, 22, 519–532.
Littleton, H.X., Daigger, G.T., Strom, P.F. and Cowan, R.A. (2003) Simultaneous Biological Nutrient Removal: Evaluation of Autotrophic Denitrification, Heterotrophic Nitrification, and Biological Phosphorus Removal in Full-scale Systems. Wat. Env. Res., 75, 138-150. Mulder A., van de Graaf A., Robertson L., Kuenen J. (1995) Anaerobic Ammonium Oxidation
Discovered in a Denitrifying Fluidized Bed Reactor, FEMS Microbiol. Ecol., 16 (3), 177–184. NF EN 29439 (1993) Qualité de l’eau. - Evaluation, en Milieu Aqueux, de la Biodégradabilité Aérobie «Ultime» des Composés Organiques. Homologuée le 20 avril 1993. Indice de classement: T90-306.
Paredes D., Kuschk P., Mbwette T., Stange F., Müller R. and Köser H. (2007) New Aspects of Microbial Nitrogen Transformations in the Context of Wastewater Treatment – A Review. Eng. Life Sci., 7 (1), 13–25.
Pynaert, K., Sprengers, R., Laenen, J. and Verstraete, W. (2002) Oxygen-limited Nitrification and Denitrification in a Lab-scale Rotating Biological Contactor. Environ. Technol., 23, 353-362. Schmidt, I., Sliekers, O., Schmid, M., Bock, E., Fuerst, J., Kuenen, J.G., Jetten, M.S.M. and Strous, M. (2003) New Concepts of Microbial Treatment Processes for the Nitrogen Removal in Wastewater. FEMS Microbiol. Rev., 27, 481-492.
Siegrist, H., Reithaar, S., Koch, G. and Lais, P. (1998) Nitrogen Loss in a Nitrifying Rotating Contactor Treating Ammonium-rich Wastewater Without Organic Carbon. Wat. Sci. Tech., 38(8-9), 241-248.
Tchobanoglous, G., Burton, F.L., Stensel, H.D. (2003) Wastewater Engineering. Treatment and Reuse. 4th Edition, McGraw-Hill, New York.
van Loosdrecht, M.C.M. and Salem, S. (2005) Biological Treatment of Sludge Digester Liquids. Proceedings of the IWA Conference on Nutrient Management in Wastewater Treatment Processes and Recycle Streams, Cracow (Poland), 18-21 September 2005, 13-22.
Wanner, O., Eberl, H., Morgenroth, E., Noguera, D., Picioreanu, C., Rittmann, B. and van Loosdrecht, M (2006). Mathematical Modeling of Biofilms. Scientific and Technical Report No. 18. IWA Publishing, London (UK).
Yu, X., Qi, Z., Zhang, X., Yu, P., Liu, B., Zhang, L. and Fu, L. (2007) Nitrogen Loss and Oxygen Paradox in Full-scale Biofiltration for Drinking Water Treatment. Wat. Res., 41, 1455 – 1464.