How to neutralize the adverse developmental effects of the Dutch Disease?
Jaime Ros Universidad Nacional Autónoma de México
August 2011
Paper prepared for the Workshop on New Developmentalism and a Structuralist Development Macroeconomics, organized by the Centro Celso Furtado, August 15-16, 2011 - EESP - Fundação Getúlio Vargas - São Paulo – Brazil
This paper addresses the subject of the adverse developmental effects of the Dutch disease: the theory, the experience of Latin America over the last decade, and the economic policy management issues on what to do about it.
1. The adverse developmental effects of the Dutch disease: the theory
Concern with the Dutch disease arises primarily from the real exchange rate effects of a natural resource boom (or of a surge in capital inflows) and the negative implications for long-term growth of the resulting contraction of industrial output, investment and employment. These implications are negative to the extent that economic development is associated with the growth of modern tradable goods sectors operating under increasing returns to scale. The expansion of these activities generates endogenous productivity growth, within these sectors and elsewhere in the economy, due to the presence of internal economies of scale as well as positive external effects such as learning by doing externalities. In what follows I discuss the mechanisms (not confined to real exchange rate appreciation) through which a natural resource boom can lead to deindustrialization and also the special conditions under which such a boom could have favorable developmental effects.
Real appreciation and indirect deindustrialization
Consider the effects of a natural resource boom due to either a natural resource discovery or an increase in the relative price of natural resource intensive products. Suppose also that the higher rents arising from the natural resource boom are partly spent on non-tradable goods and services (Corden’s spending effect) leading to a higher relative price of non-tradables and thus to real currency appreciation. The higher wages and prices of non-tradable inputs that manufacturing faces now cause a profitability squeeze in this sector that slows down capital accumulation and can lead to a new long run equilibrium with a smaller manufacturing sector and larger natural resource and services sectors. The result is indirect deindustrialization (in the terminology of Corden, 1984, and Corden and Neary, 1982) because, unlike direct deindustrialization to be discussed below, it results from real currency appreciation caused by the spending effect and depends on its strength. In the presence of increasing returns to scale in manufacturing, the new long run equilibrium can also feature a lower real wage due to the adverse productivity effects of the contraction of manufacturing (see Ros, 2000, for a formal analysis).
It is important to point out that the natural resource boom need not be permanent in order to cause adverse developmental effects. A real exchange rate appreciation resulting from a temporary resource boom can shift the pattern of specialization of an economy in an irreversible way and lock in the economy permanently as an exporter of primary goods. This is perhaps the main problem with natural resource booms. The fact that a transitory real exchange rate overvaluation that leads to a substantial decline in the investment and productivity of the non resource intensive tradable goods sector (as productivity contracts endogenously with
investment in the presence of increasing returns to scale), turns the sector unprofitable at the long run equilibrium real exchange rate, thus causing a long term, permanent contraction of the tradable activities other than the resource intensive sector1.
Capital mobility and direct deindustrialization
In either of the scenarios (higher primary product prices or new discoveries of natural resources), profitability in the natural resource sector rises at the initial level of the capital stock and above the level of profitability in the other tradable goods sectors (manufacturing, in particular). Capital moves then from manufacturing to the resource intensive sector tending to equalize again the profit rates. The new equilibrium features a smaller capital stock in manufacturing and a lower real wage in labor market equilibrium, if manufacturing is more labor intensive than the resource intensive sector. The fall in real wages takes place even in the absence of increasing returns to scale in manufacturing (and thus in the absence of a decline in manufacturing productivity). The real wage contraction is caused by the fall in labor demand following the reallocation of capital away from the labor-intensive sector (manufacturing). With the given labor supply, the equilibrium wage falls then in order to clear the labor market. As Corden (1984) calls it this is a direct deindustrialization effect because it is independent of what happens to the relative price of tradables in terms of non tradables (i.e. independent of real currency appreciation).
The staple thesis and the favorable developmental effects of resource booms
It is also important to point out that a natural resource boom can also have positive developmental effects, including crowding in effects on industrialization. This is the staple thesis view, originating in the work of Canadian economic historians, which emphasizes the role of linkages generated by different primary export activities and the nature of returns to scale in the sectors that benefit directly from the expansion of primary exports. Suppose, for example, that the non tradable goods sectors which benefit from the increase in the natural resource rents and its spending operate under increasing returns to scale — transport infrastructure, say, stimulated by the expansion of the agricultural frontier — and that at the same time, the labor supply is elastic, due to the presence of surplus labor in the economy or to workers migration, so that the spending effects of the natural resource boom have little effects on wages. Under these conditions, the relative price of non-tradable inputs (transport costs in the example mentioned) used by manufacturing will tend to fall, rather than increase, with the expansion of the primary export sector. The natural resource boom leads then to real exchange rate depreciation as the relative price of non-tradables, in terms of manufactures, falls as a result of productivity increases (coming from the presence of increasing returns to scale in the production of non tradable inputs) that are larger than the rise of real wages (held down by the
1
This requires, strictly speaking, the existence of multiple equilibria. See, on the subject, Krugman (1987), Ros and Skott (1998), Ros (2000) and Rapetti (2011).
elastic labor supply). The consequence is an increase in the profitability and the rate of accumulation of the manufacturing sector that has positive long term developmental effects. The spending out of rents has now an anti-Dutch disease effect! Note that what is going on is the fact that the growth of the natural resources sector generates pecuniary externalities for the manufacturing industry through the expansion of the infrastructure sector and the depreciation of the real exchange rate. The key conditions for the existence of these pecuniary externalities are the presence of an elastic labor supply and of increasing returns to scale in the production of non tradable inputs (see, on the subject, Ros, 2000).
2. The recent economic performance of Latin America and the Dutch disease The raw materials export boom of the past decade
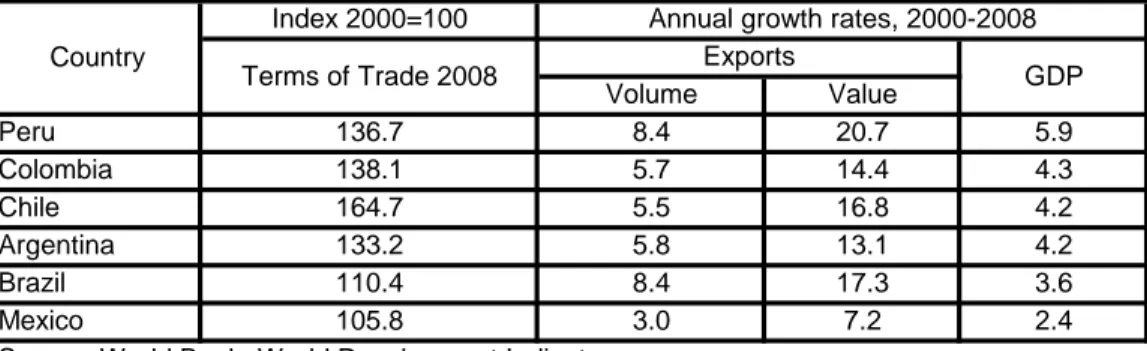
The years 2000s, especially after 2003 and before the “Great Recession” of 2009, witnessed a resumption of growth in most of Latin America, led by a process of rapidly expanding exports and a medium term improvement in the terms of trade of primary goods. Table 1 shows the change in the terms of trade and the rates of growth of exports and GDP for the period 2000-2008 for a group of five South American economies, exporters of primary goods and natural resource intensive manufactures, and Mexico. Peru, a mineral exporter, leads the table with an astonishing 20% annual growth in export value and a GDP growth rate of nearly 6% while the rest of the South American economies show also high export growth, respectable GDP growth rates and a favorable evolution of the terms of trade, especially in the case of Chile which recorded a sharp terms of trade improvement.
Table 1. Terms of trade, exports and GDP growth in several Latin American countries Index 2000=100 Volume Value Peru 136.7 8.4 20.7 5.9 Colombia 138.1 5.7 14.4 4.3 Chile 164.7 5.5 16.8 4.2 Argentina 133.2 5.8 13.1 4.2 Brazil 110.4 8.4 17.3 3.6 Mexico 105.8 3.0 7.2 2.4
Source: World Bank, World Development Indicators
Annual growth rates, 2000-2008 Country
Terms of Trade 2008 Exports GDP
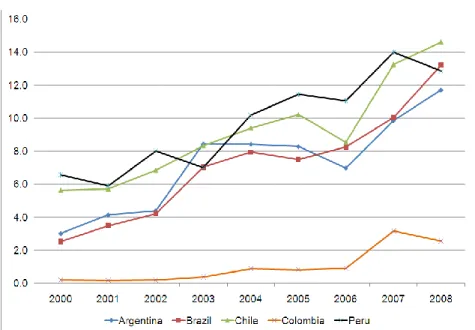
These processes are part of an acceleration of growth in the periphery of the world economy specializing in the production and export of primary goods that is closely associated to the emergence of China, a gigantic and extremely dynamic economy, as a new industrial center and formidable purchaser of agricultural products, minerals, copper, and other raw materials in the world economy. Indeed, as shown in figure 1, China’s share in the total exports of the main South American exporters of primary goods has been rising sharply since 2000 suggesting an important role for China’s growth in the expansion of South America’s exports. China overtook the United States as Brazil’s major trade partner in 2009, it is the second largest trade partner of
Argentina, Colombia and Peru and the largest purchaser of Argentina’s agricultural products, and it is Chile’s major trading partner in Asia. Meanwhile, and not surprisingly, Mexico, which is the only manufacturing exporter in table 1 and for that reason a competitor rather than a supplier for China, records, among the countries included in the table, the lowest rates of export and GDP growth as well as the smallest improvement in the terms of trade (an improvement that is due exclusively to the still significant share of oil, about 15%, in Mexico’s total exports).
Figure 1. South American exports to China as percentage of each country’s total exports, 2000-2008
Source: United Nations Commodity Trade Statistics Database and World Bank, World Development Indicators
Appreciating real exchange rates and falling industrial profitability
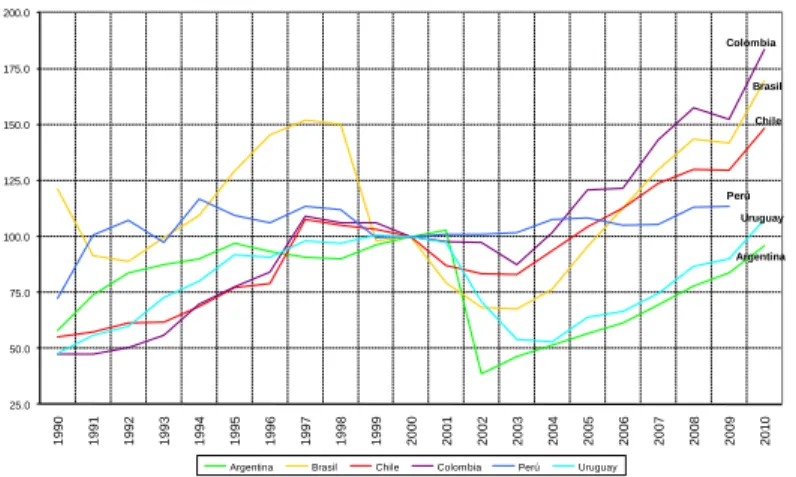
While the dynamism of the Chinese economy and of the world demand for raw materials have had so far favorable short term effects on the economic growth of South American countries, the medium and longer term developmental consequences of the raw materials export boom depend on its effects on real exchange rates and the profitability of the non resource intensive tradable goods sectors, that is on whether a Dutch disease is developing in the region. As shown in figure 2, the raw materials export boom has been accompanied by a substantial appreciation of real exchange rates in Latin America sometime after the beginning of the past decade, only briefly interrupted by the temporary depreciations that took place in 2008 an early 2009 as a consequence of the international financial crisis, the “flight to quality”, and the increase in risk spreads in emerging markets.
Figure 2. Real exchange rates in several South American countries. Argentina Brasil Chile Colombia Perú Uruguay 25.0 50.0 75.0 100.0 125.0 150.0 175.0 200.0 225.0 250.0 275.0 1990 1991 1992 1993 1994 1995 1996 1997 1998 1999 2000 2001 2002 2003 2004 2005 2006 2007 2008 2009 2010
Argentina Brasil Chile Colombia Perú Uruguay
Source: Frenkel and Rapetti (2011). Bilateral rates vis a vis the United States (100 = 2000). Figure 3 assesses the extent of appreciation by comparing the level of the real exchange rate in 2010 with its average level for the period 2002-2008 and the minimum level (i.e., the most appreciated level) in the 1990s. With the exception of Argentina, real exchange rates in 2010 were similar or lower than the minimum levels of the 1990s and well below (including Argentina) the average levels of 2002-2008. The expansion of the natural resource intensive sectors is clearly not having an anti-Dutch disease effect! This is why the primary exports boom has led to a decline the profitability of the industrial sector. As shown in figure 4, in the great majority of South American countries, unit labor costs in dollars tended to increase after 2002-03 in a substantial and sustained way suggesting that, at least for the labor intensive tradable goods sectors, there is an important problem of competitiveness and profitability2.
Figure 3. Real exchange rates in South American countries. Minimum level of the 1990s, average of 2002-2008 and 2010 1995 1996 1997 1997 1995 1995 0.0 25.0 50.0 75.0 100.0 125.0 150.0 175.0 200.0 225.0
Argentina Brasil Chile Colombia Perú Uruguay Mínimo Promedio 2002-2008 2010
2
Source: Frenkel and Rapetti (2011). Bilateral rates vis a vis the United States (100 = 2000). Figure 4. Unit labor costs in US dollars in several South American countries (2000 = 100)
Argentina Brasil Chile Colombia Perú Uruguay 25.0 50.0 75.0 100.0 125.0 150.0 175.0 200.0 1990 1991 1992 1993 1994 1995 1996 1997 1998 1999 2000 2001 2002 2003 2004 2005 2006 2007 2008 2009 2010
Argentina Brasil Chile Colombia Perú Uruguay
Source: Frenkel and Rapetti (2011)
Figure 5 shows for the same South American countries the results of a decomposition exercise which measures the influence of the increase in the real wage, the real appreciation of the exchange rate, and the change in relative productivity on the increase in unit labor costs. What emerges clearly from the exercise is that the real appreciation of the exchange rate has had in all countries a major role in the increase in unit labor costs and, thus, in the decline in industrial profitability.
Figure 5. Increase in unit labor costs in US dollars and its determinants in several South American countries (percentages)
2009 -30.0 -20.0 -10.0 0.0 10.0 20.0 30.0 40.0 50.0 60.0 70.0 80.0 90.0 100.0 110.0 120.0 130.0 140.0 150.0 160.0
Argentina Brasil Chile Colombia Perú Uruguay
3. What can economic policy do?
How to counteract the adverse developmental effects of the Dutch disease? Since these effects arise mostly, although by no means exclusively, from the real exchange appreciation that accompanies the expansion of primary exports and its crowding out effects on non resource based tradable sectors, exchange rate policy has a crucial role to play in neutralizing the Dutch disease. If this is so, the inflation targeting regimes currently fashionable in Latin America are not well prepared for the task of addressing those adverse developmental consequences3. In fact, under this regime there seems to be a built in bias towards the appreciation of the exchange rate. Figure 6 shows the evolution of real exchange rates in Latin America in 3 groups of countries according to monetary policy regime (inflation targeting cum floating exchange rates, dollarized regimes, and others). As shown in the figure, the trend towards real appreciation in the period 2002-2008 was much more marked in countries with inflation targeting regimes was in the other two groups of countries.
Figure 6. Real exchange rates in Latin American countries according to monetary policy regime, 2002-2008
Real Effective Exchange Rate
Index: 100=Jan2002 - bís-a-bís the US dollar
90 95 100 105 110 115 120 125 2002 2003 2004 2005 2006 2007 2008 IT Dollarized Others Source: Ize (2008)
This built in bias towards appreciation may be due to various reasons. First, under inflation targeting (especially in its “strict form”) monetary policy focuses on achieving low inflation using the interest rate as the main policy instrument while ignoring other policy objectives such as
3
Inflation targeting regimes now prevail in major Latin American countries.All six countries in table 1 except Argentina have such regimes in place. Chile and Colombia were the pioneers having adopted inflation targets since 1990 and 1991 respectively. Peru introduced a floating exchange rate regime in 1994 and in 2002 the central bank replaced quantitative targets for monetary aggregates with inflation targets using the interest rate as the main instrument of monetary policy. After the 1994-95 crisis, Mexico let the peso float and in 1999 moved to an inflation targeting regime eventually adopting a target interest rate as policy instrument. Brazil also joined this group of countries in 1999 after the exchange rate crisis of the beginning of that year.
employment and growth. Given the relatively large impact of the nominal exchange rate on the price level (relative to that of the interest rate operating on interest sensitive components of aggregate demand, as argued below), it becomes in these conditions very tempting for central banks to subordinate the exchange rate to their inflation objectives or to respond in a non symmetrical way to appreciations and depreciations4. Second, due to the shallowness of credit markets in developing countries the sensitivity of aggregate demand to interest movements is low and therefore central banks may need to raise interest rates excessively to achieve the inflation target. High interest rates attract capital inflows (a form of Dutch disease) which tend to appreciate the domestic currency.
Freeing monetary policy from the straight jacket of inflation targeting is thus a precondition for targeting the exchange rate. This may require the use of sterilized interventions in the foreign exchange market and the adoption of capital account regulations. However, these policies face limitations – as sterilization may run into significant quasi-fiscal costs and capital inflows may find ways to circumvent regulations – and, as Rapetti (2011) correctly notes, financial integration implies that when exchange rate policy is trying to pursue a real exchange rate target, monetary policy is no longer completely autonomous. In addition, while exchange rate management can affect closely the absolute price of tradable goods it faces more difficulties when it comes to affect the relative price of tradables vis a vis non-tradables and labor. If instead of generating a real depreciation, nominal devaluations led to rises in domestic prices, the devaluation-inflation spiral resulting from engaging in further devaluations can have deleterious effects on capital accumulation and growth.
All this means that the job of counteracting the Dutch disease requires not only giving monetary policy a greater room for maneuver in order to target the exchange rate but also policy coordination through the help in particular of fiscal policy and wage management policies (see Frenkel and Rapetti, 2011, and Rapetti, 2011). Indeed, fiscal policy may have to play a more preponderant role in managing domestic aggregate demand and in restraining, in particular, inflationary pressures in the non-tradable goods sectors (see, on the subject, Eichengreen, 2007; Frenkel, 2008; and Rapetti, 2011). Since part of the real appreciation associated to the Dutch disease arises from the spending out of natural resource rents on non tradable goods and services, counteracting this may require an increase in the fiscal surplus in order to moderate the pace of non-tradable demand growth. The required increase in the fiscal surplus can be generated through tariffs or taxes on the primary exports which at the origin of the Dutch disease (see, on the subject, Bresser-Pereira, 2008 and 2011).
Wage management policies that coordinate the pace of real wage increases with the rate of productivity growth in the tradable goods sector can also help in restraining inflationary
4
The so called “fear of floating” may also contribute to this non symmetrical response and to a pro-cyclical management of interest rates. For a critical discussion of the suitability of inflation targeting for developing countries, see Epstein and Yeldan (2009) and Rapetti (2011). On the non symmetrical response of monetary policy to exchange rate shocks in the Mexican case, see Galindo and Ros (2008).
pressures in non-tradable goods prices and in containing the growth of unit labor costs, thus preventing the fall in profitability and capital accumulation in non resource intensive tradable goods sectors. As argued in Ros (2011), while a higher real exchange rate implies that in the short run real wages are lower than otherwise, it will nevertheless lead to higher real consumption wages in long run equilibrium as a result of the endogenous productivity growth effects of capital accumulation in the tradable goods sectors and of the absorption of employment from non tradable goods sectors. The mechanisms connecting an initially higher real exchange rate and a higher value of the real wage in the steady state are the presence of increasing returns to scale in the tradable goods sector and of diminishing returns to labor in the non tradable goods activities.
References
Bresser-Pereira, L. C. (2008), Dutch disease and its neutralization: a Ricardian approach, Brazilian Journal of Political Economy 28 (1): 47–71.
Bresser-Pereira, L. C. (2011), From old to new developmentalism, in J. A. Ocampo and J. Ros (eds), Oxford Handbook of Latin American Economics, Oxford University Press
Corden, W. M. (1984), Booming sector and Dutch disease economics: Survey and consolidation. Oxford Economic Papers 36: 359-80
Corden, W. M. and J. P. Neary (1982), Booming sector and deindustrialization in a small open economy. Economic Journal 92: 825-48
Eichengreen, B. (2007), The Real Exchange Rate and Economic Growth, Commission on Growth and Development, Working Paper No 4
Epstein, G. and E. Yeldan (2009), Beyond Inflation Targeting: Assessing the Impacts and Policy Alternatives: Edward Elgar Publishing
Frenkel, R. (2008), The Competitive Real Exchange-Rate Regime, Inflation and Monetary Policy, Cepal Review, Vol. 96, pp. 191–201
Frenkel, R. y M. Rapetti (2011), La principal amenaza de América Latina en la próxima década: ¿fragilidad externa o primarización?
Galindo, L. M. and J. Ros (2008), Alternatives to inflation targeting in Mexico, International Review of Applied Economics, vol. 22, issue 2
Ize, A. (2008), “From Tail Winds to Head Winds: Dilemmas and Trade-offs for Monetary Policy in Latin America and the Caribbean,” ppt presentation, Lima, Peru, June 16, 2008
Krugman, P. (1987), The Narrow Moving Band, the Dutch Disease, and the Competitive Consequences of Mrs. Thatcher, Journal of Development Economics, Vol. 27, No. 1-2, pp. 41–55.
Rapetti, M. (2011), Policy coordination in a competitive real exchange rate strategy for development, mimeo
Ros, J. (2000), Development Theory and the Economics of Growth, University of Michigan Press Ros, J. (2011), The real exchange rate, the real wage and growth in a small open economy, mimeo
Ros, J. and P. Skott (1998), Dynamic effects of trade liberalization and currency overvaluation under conditions of increasing returns, The Manchester School, Vol. 66, No. 4, pp. 466–489.