20
21
Miguel Lebre de Freitas / Ricardo Paes MamedeUA, NIPE / ISCTE-IUL, Observatório do QREN, Dinâmica-CET
resumo résumé / abstract
Structural transformation of Portuguese exports and the role of
foreign-owned firms:
A descriptive analysis for the period 1995-2005
*
In this paper we use a recent measure of the “income level of a country’s exports” proposed by Hausmann et al. (2007) to characterize the structure of the Portuguese export basket, its recent evolution and the role of foreign-owned firms in this process. We find that between 1995 and 2005 the improvement in the “income content” of the Portuguese export basket relative to the world average was achieved through an above-average “structural transformation effect” that more than offset a bellow-average effect of having a significant share of products exposed to an increasing competition from emerging economies. We find that the weight of exports with “high” and “very high” income content increased considerably in this period, with these two classes explaining more than one half of the total export growth. Analysing the presence of foreign-owned firms in different industries, we find a higher than average share of foreign affiliated firms in products with “High” and “Very High” income content. These and other pieces of evidence suggest that foreign-owned firms have played a relevant role both in the growth of Portuguese exports and in the increase of their income content.
Classificação JEL:C14, F14. Neste artigo, utilizamos uma medida de
“conteúdo de rendimento das
exportações de um país” recentemente proposta por Hausmann e outros (2007) para caracterizar a estrutura das exportações portuguesas, a sua evolução recente e o papel das empresas de capital maioritariamente estrangeiro nessa evolução. Os resultados sugerem que, entre 1995 e 2005, o “conteúdo de rendimento” das exportações portuguesas cresceu acima da média mundial, para o que terá contribuído um “efeito de ajustamento estrutural” superior à média, que mais do que terá compensado um desempenho abaixo da média decorrente do facto de uma parte significativa das exportações portuguesas ocorrer em sectores sujeitos a uma concorrência crescente por parte das economias emergentes. Também verificamos que o peso das exportações de “elevado” e “muito elevado” conteúdo de rendimento aumentou
consideravelmente no período, com essas duas classes a explicar mais de metade do crescimento das exportações portuguesas. Analisando a presença de empresas de capital estrangeiro nos diferentes sectores, encontramos um peso acima da média nos produtos de “elevado” e “muito elevado” conteúdo de rendimento. Estes e outros resultados sugerem que as empresas de capital estrangeiro têm desempenhado um papel relevante, quer no crescimento das exportações portuguesas, quer no aumento do seu conteúdo de rendimento.
* A previous version of this paper was presented at the second Workshop on Portugal and the Challenge of Globalization, held at the Ministry of Economy and
Innovation, Lisbon, November 3, 2008. The authors acknowledge Paulo Inácio, Walter Marques and Luis Florindo for helpful assistance with the data and João Amador and David Haugh for helpful comments.
In the current debate on the Portuguese economy, there is a view that the country’s
specialization pattern, traditionally dominated by low-skilled labour intensive products, is a major obstacle to convergence. According to this view, with the emergence of new trading partners in the international arena, the future performance of the Portuguese economy will depend critically on its ability to shift its specialization pattern towards goods with higher productivity content. In this paper, we investigate the extent to which the Portuguese economy has indeed become increasingly specialized in more sophisticated goods and whether such a shift is more evident in sectors with a high presence of foreign-owned firms.
The view that a country’s economic performance depends on the specialization pattern has a long tradition in economic thinking, backing from Adam Smith and David Ricardo1. Empirically,
however, this idea has been difficult to test, because a measure of a country specialization pattern that reflects the quality of the goods being exported is not easy to define. In a recent contribution, Hausmann et al. (2007) propose a quantitative index that ranks traded goods in terms of their “implied income”. This index (PRODY) is estimated as a weighted average of the per capita GDPs of the countries exporting a product, where the weights reflect the revealed comparative advantage of each country in that product. The authors then compute a measure of sophistication of a country export basket (EXPY) by calculating the export-weighted average PRODY for that country. The authors report a strong correlation between EXPY and per capita GDPs and also find that EXPY is a strong and robust predictor of subsequent economic growth, controlling for standard covariates.
In this paper, we compute a new vector of PRODY indexes, using 1995 and 2005 COMTRADE data for 1235 products and 81 countries. We then use these indexes to characterise the Portuguese export basket and to assess how well it has moved towards products with higher income content. We document that in the period from 1995 to 2005 there has been indeed an upscale move of the Portuguese specialization pattern. Though using a different methodology, our evidence accords with the recent findings of Caldeira Cabral (2008) and Amador et al. (2007) who analysed the changing pattern of the Portuguese exports, using the OECD classification of R&D intensities.
We then investigate the extent to which foreign-owned firms have played a role in this change. Portuguese governments have made significant efforts to support FDI inflows, either through financial incentives (EU funds and tax benefits) or by providing complementary infrastructure. Despite the high year-on-year volatility, FDI net flows to Portugal have a clear upward trend, from 0,43% of GDP in the 1970s to 1,03% in the 1980s, 1,085% in the 1990s and 3,65% in the period 2000-2006 (UNCTAD, 2007). An obvious question is, thus, whether such an effort has helped or impaired the process of structural transformation.
The relationship between FDI and economic performance is a topic of controversy in the economic literature. Policymakers and academics often argue that FDI can be a source of benefits to host countries, through knowledge spillovers or by creating linkages from multinationals to domestic firms2. Accordingly, governments all over the world spend large
amounts of resources to attract subsidiaries of multinational firms to their jurisdiction. 1. Introduction
1 Recent contributions emphasizing the type and the characteristics of the industries wherein a country specializes include Krugman (1987), Lucas (1988), Young (1991), Matsuyama (1992), Rodriguez-Clare (1996) and Rodrik (1996).
2 Fosfuri et al. (2001) discuss the spillover effects related to the flow of skilled workers trained by multinationals to other firms in the host country. Rodriguez-Clare (1996a) and Markusen and Venables (1999) examine the linkage effects between multinationals and domestic firms. Many authors remain, however, sceptical about the relationship between FDI and economic performance (e.g., Rodrik, 2007, pp.119-120).
Empirically, however, the evidence on FDI-related externalities is not free of controversy (see Keller, 2004 for a survey)3.
This paper abstracts from spillovers and other external effects of foreign-owned firms. Simply, we examine whether there has been a tendency for foreign-owned firms to operate in fast growing non-traditional and high income content export sectors, thus having a direct impact in the process of structural transformation in Portugal. Our paper adds to the literature in that it examines the relationship between foreign-owned firms and the structure of Portuguese exports by income content, crossing information on export values at the product (SITC-4 rev 2) level and on the proportion of capital with foreign affiliation at the firm level. We assess whether
foreign-owned firms have contributed to improve the specialization pattern of the Portuguese economy using the PRODY index as a measure of income content.
The paper proceeds as follows. In Section 2, we provide some comparative analysis, using PRODY indexes and indexes of Revealed Comparative Advantage (RCA)4at the product level
from 1995 to 2005. In Section 3 we decompose the changes in the average income content of each country’s exports into a “PRODY effect” and a “structural transformation effect”. In Section 4 we investigate how the composition of the Portuguese export basket has evolved in terms of classes of PRODY. In Section 5 we evaluate the extent to which the sectors that most contributed to the Portuguese export growth have a large presence of foreign-owned firms and whether the presence of foreign-owned firms is more significant in products with higher income content. Section 6 concludes.
In this paper, we use the Hausmann et al. (2007) PRODY index to assess the sophistication level of products. Formally, the index is defined, for each product, as the weighted average of per capita incomes of countries exporting that product, where the weights are proportional to the country’s index of Revealed Comparative Advantage in that product (details in Appendix 1). Products with high PRODY values are, by construction, those typically exported by high income countries. The implied assumption is that the presence of higher wages is stronger where comparative advantages are determined by factors other than labour cost, such as know how, technology, public infrastructures, research centres and so on.
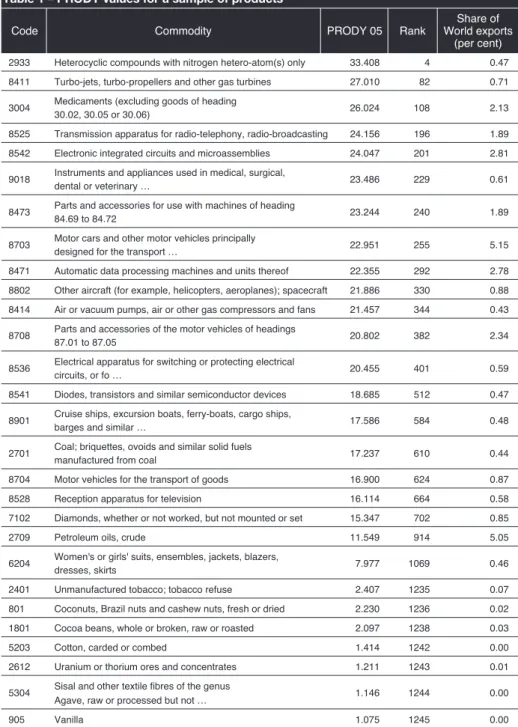
Our calculations use international trade data at the product level (SITC-4 rev 2), from the UN-COMTRADE database, as extracted in September 2007 and per capita GDP levels (in PPP) by the International Monetary Fund, World Economic Outlook Database, April 2008. Both variables refer to 1995 and 2005. Countries for which there was no consistent data for those two years were excluded. This leaves us with 81 countries and data for 1235 products. Table 1 displays the estimated PRODY values for some products, the corresponding PRODY rank and the share in World exports, in 2005. As expected, agricultural commodities and raw materials appear at the bottom of the table.
22
23
3 In the specific case of Portugal, there is anecdotic evidence of training spillovers and quality improvement effects on domestic suppliers (OECD, 2008, pp. 86-87). However, Flores et al. (2007) found no robust evidence of intra-sectoral spillover effects, as measured by the effect of FDI on domestic firms’ labour productivity. Guimarães et al. (2000), analysing the role of agglomeration effects in location decisions of establishments participated by foreign capital between 1982 and 1992, found a positive influence of industry-specific localization economies but no significant influence of foreign-specific agglomeration effects. This is suggestive of spillovers, but not necessarily related to the affiliation of capital.
4 Also known as Balassa index (Balassa, 1958). The index of revealed comparative advantage (RCA) for a given product in a given country is computed as the share of that product in the country’ exports, divided by the share of the same product in world exports (see Appendix 1 for details).
2933 Heterocyclic compounds with nitrogen hetero-atom(s) only 33.408 4 0.47
8411 Turbo-jets, turbo-propellers and other gas turbines 27.010 82 0.71
3004 Medicaments (excluding goods of heading 30.02, 30.05 or 30.06) 26.024 108 2.13 8525 Transmission apparatus for radio-telephony, radio-broadcasting 24.156 196 1.89
8542 Electronic integrated circuits and microassemblies 24.047 201 2.81
9018 Instruments and appliances used in medical, surgical,dental or veterinary … 23.486 229 0.61 8473 Parts and accessories for use with machines of heading84.69 to 84.72 23.244 240 1.89 8703 Motor cars and other motor vehicles principally designed for the transport … 22.951 255 5.15
8471 Automatic data processing machines and units thereof 22.355 292 2.78
8802 Other aircraft (for example, helicopters, aeroplanes); spacecraft 21.886 330 0.88 8414 Air or vacuum pumps, air or other gas compressors and fans 21.457 344 0.43 8708 Parts and accessories of the motor vehicles of headings87.01 to 87.05 20.802 382 2.34 8536 Electrical apparatus for switching or protecting electrical circuits, or fo … 20.455 401 0.59
8541 Diodes, transistors and similar semiconductor devices 18.685 512 0.47
8901 Cruise ships, excursion boats, ferry-boats, cargo ships,barges and similar … 17.586 584 0.48 2701 Coal; briquettes, ovoids and similar solid fuels manufactured from coal 17.237 610 0.44
8704 Motor vehicles for the transport of goods 16.900 624 0.87
8528 Reception apparatus for television 16.114 664 0.58
7102 Diamonds, whether or not worked, but not mounted or set 15.347 702 0.85
2709 Petroleum oils, crude 11.549 914 5.05
6204 Women's or girls' suits, ensembles, jackets, blazers,dresses, skirts 7.977 1069 0.46
2401 Unmanufactured tobacco; tobacco refuse 2.407 1235 0.07
801 Coconuts, Brazil nuts and cashew nuts, fresh or dried 2.230 1236 0.02
1801 Cocoa beans, whole or broken, raw or roasted 2.097 1238 0.03
5203 Cotton, carded or combed 1.414 1242 0.00
2612 Uranium or thorium ores and concentrates 1.211 1243 0.01
5304 Sisal and other textile fibres of the genus 1.146 1244 0.00
Agave, raw or processed but not …
905 Vanilla 1.075 1245 0.00
Table 1 – PRODY values for a sample of products
Share of
Code Commodity PRODY 05 Rank World exports
(per cent)
For illustrative purposes, Figure 1 assesses the linear relationship between our estimated PRODY and RCA indexes for 12 countries, as of 2005 (China, France, Germany, Greece, Hungary, India, Italy, Korea, Portugal, Spain, Turkey and USA)5. Despite the high dispersion of
the data, plotting a linear regression line helps assessing the sign of the correlation between the two indexes. When significant, a negative correlation indicates a general tendency for a country to be specialized in goods with low income content. A positive correlation, in turn, indicates a general tendency for a country to be increasingly specialized in goods with higher income content.
According to the figure, by 2005 India was the country in this sub-sample with a more negative correlation between RCAs and PRODY values, followed by Turkey, Greece, and China. The Portuguese specialization pattern was more favourable than in these countries, but less than those of Hungary and Spain. On the other hand, Korea, Italy, France, USA and Germany exhibited positive correlations between RCA and PRODY values, suggesting a tendency to be more specialized in “rich country goods”.
Moving from a negative correlation towards a positive correlation involves the country becoming increasingly specialized in products with higher income content. This is what is meant by structural transformation.
24
25
5 The Balassa RCA index is in Logs. Null coefficients of RCA became missing values.
Figure 1 – PRODY and Revealed Comparative Advantage in 2005 (China, France, Germany, Greece, Hungary, India, Italy, Korea, Portugal, Spain, Turkey, USA)
35.000 30.000 25.000 20.000 15.000 10.000 5.000 0 -8 -6 -4 -2 0 2 4 PR O DY 2 00 5 RCA 2005 (logs) India Turkeu Greece China Portugal Hungary Spain Korea Italy France Germany USA
The data in Figure 1 is silent in respect to absolute sizes (the RCA index actually measures sizes, but relative to the world average). To account for a country total export mass, Hausmann et al. (2007) proposed the EXPY index. This is the average PRODY in a country export basket, where the weights are the share of each product in a country exports (details in Appendix 1). Figure 2 mimics Figure 3 in Hausmann et al. (2007), relating EXPY values with GDP per capita for the countries in our sample. The figure confirms the positive relation between the two variables, with GDP per capita growing exponentially with EXPY. This supports the idea that rich countries export products that tend to be exported by rich countries, while poor countries export products that tend to be exported by other poor countries. Hausmann et al. (2007) also found that EXPY is a strong and robust predictor of subsequent economic growth, controlling for standard covariates6. These findings suggest that the type of goods in which a country
specializes has important implications for subsequent economic performance.
PRODY indexes change over time, reflecting the changes in the world structure of trade and the changes in per capita GDP levels. Hence, EXPY indexes in two different points in time can either Figure 2 – EXPY and GDP per capita at PPP (2005, $US)
45.000 40.000 35.000 30.000 25.000 20.000 15.000 10.000 5.000 0 0 5.000 10.000 15.000 20.000 25.000 G O P pe r c ap ita P PP ($ US ) Expy ($US) China Portugal India Ireland USA
Sources: Own estimates, based on COMTRADE and IMF data.
3. PRODY effect versus structural adjustment effect
6 In their central case, the estimation results imply that a 10 percent increase in EXPY boosts growth by half a percentage point (p. 15 and Table 8, in the original). Because these results are not significantly affected by the presence of other variables, such as physical capital, human capital and institutional quality, the authors concluded that EXPY exerts an independent force on economic growth.
be computed at current PRODY or at base-year PRODY levels. Changes in EXPY at current PRODYs will, therefore, reflect changes in the country’s structure of exports and changes in the implied value of exports.
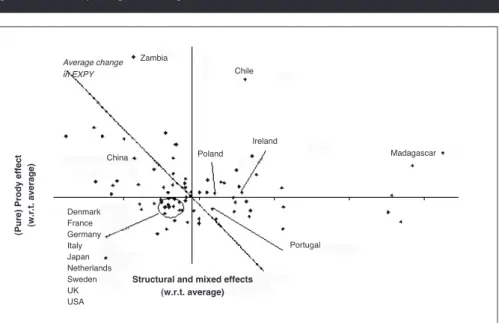
Figure 3 describes how the changes in EXPY at current PRODYs break down into a “pure PRODY effect” (i.e., the change in EXPY that would have been observed if the PRODY values of the different products had changed the way they did, while the export structure remained unchanged) and other effects (this includes a “pure structural transformation effect” – i.e., the value of EXPY which would have been observed had the PRODY values remained unchanged while the structure of exports evolve the way it did – and a mixed effect). The technical details and the figures for 81 countries are in Appendix 2.
The horizontal and vertical axes in Figure 3 represent the sample average “pure PRODY effect” and the sample average “pure structural and mixed effects” (respectively) underlying the changes in EXPY values between 1995 and 2005. The dashed diagonal in the figure represents the average growth in EXPY across countries (weighted by GDP per capita in PPP in 2005). Dots to the right of this line represent countries whose EXPY value has increased above the average; dots to the left of the diagonal correspond to countries whose exports have experienced a decrease in income content in relative terms.
The figure reveals that the Portuguese EXPY level has increased slightly above the average, while the reverse happen to most OECD countries (other exceptions include Australia, Canada, Ireland and Poland). Portugal is located in the lower-right quarter of the graph, meaning that the change in the income content of its exports is accounted for by an above-average structural
26
27
Figure 3 – Decomposing the changes in EXPY at current PRODYs between 1995 and 2005
(P ur e) P ro dy e ffe ct (w .r. t. av er ag e)
Structural and mixed effects (w.r.t. average) China Portugal Chile Ireland Poland
Sources: Own estimates, based on COMTRADE and IMF data.
Madagascar Zambia Denmark France Germany Italy Japan Netherlands Sweden UK USA Average change in EXPY
transformation (plus mixed) effect, which was big enough to offset a bellow-average PRODY effect. A bellow average PRODY effect means that, had the Portuguese export basket remained stuck, its average income content would have grown less than the average. The reason is that a significant fraction of the Portuguese exports basket corresponds to traditional products, where competition by emerging economies has been increasing. The above-average structural transformation effect more than offset this effect, allowing the EXPY level in Portugal to grow slightly above the average7.
The Portuguese pattern contrasts with what was observed in other OECD countries: most developed countries have registered below average PRODY and structural and mixed effects8.
In contrast, Chile and Madagascar, for example, have improved significantly their EXPY values, due to both positive structural adjustment and income effects.
Having established the relative importance of the structural transformation effect in the case of Portugal, we now focus on this component, abstracting from changes in EXPY caused by changes in PRODY values. Hence, the analysis proceeds at constant PRODYs9. In this
section and in the following, we use a database from the Portuguese National Institute of Statistics (INE) not hiding confidential positions. It is, therefore more accurate than the COMTRADE database10. The corresponding estimates of EXPY and export shares by classes
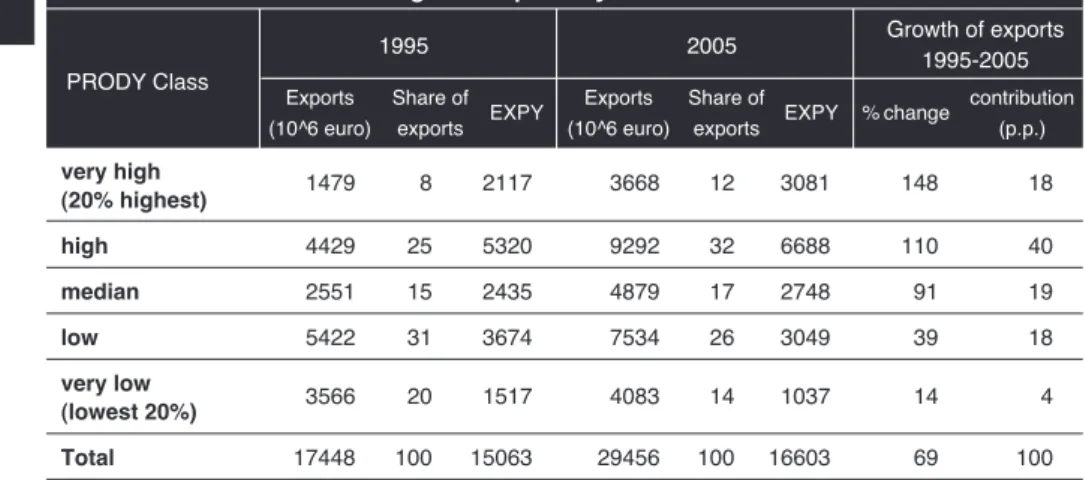
of PRODY are displayed in Table 2. The table reveals that the average sophistication level of the Portuguese export basket (EXPY) has increased over time, from 15.063 USD in 1995 to 16.603 USD in 2005.
To get a sense on how this change came about, export volumes at constant PRODY values are split into 5 classes of PRODY. The 5 classes considered range from the 20% products with higher PRODY values to the 20% products with lower PRODY values (figures for 81 countries based on COMTRADE data are displayed in Appendix 3).
4. Income content, export shares and export growth in Portugal
7 This evidence contrasts with Amador et al. (2007), who report a high persistent specialization pattern in Portugal, as compared to Spain and Ireland. However, their analysis does not take into account income contents. Weighting the exports shares with PRODY indexes, our analysis suggests that the structural adjustment effect was more significant in Portugal than in the cases of Ireland and Spain (see Appendix 2). Lebre de Freitas and Salvado (2008) discuss, on a comparative basis, how valuable the current productive experience is in preparing the country for upscale moves.
8 The analysis for Italy confirms Di Maio and Tamagni (2007). The authors found that the low performance of that country in the last two decades was mainly explained by the fact that Italy remained stuck in a number of products which PRODY values have declined, due to the entry of emerging economies in these markets. In the figure, Italy is on the lower-left corner, meaning lack of structural adjustment and specialization in products of declining value.
9 Restricting attention to 2005 PRODY values, we are no longer constrained with the need to have a consistent sample of countries for the years 1995 and 2005. Therefore, from this point forward the PRODY values are computed using a larger sample of countries (93 instead of 81). This allows the PRODY index to reflect more accurately the world structure of international trade.
10 A major drawback of COMTRADE is the presence of a sizeable category of miscellaneous products, “9999-Commodities not specified according to kind”, which accounted for 2,9% of the world trade in 2005. This category cannot be ignored while computing RCA indexes, but there is no point in computing its PRODY value. Because this category differs significantly over time and across countries, its presence complicates international and inter-temporal comparisons. In the case of Portugal, a major change in the statistical treatment of confidentiality has occurred in 2005, causing a large number of products previously classified elsewhere to be moved to the class 9999. As a result, the share of exports in this category jumped from nearly zero to 8.7%.
The table shows that there has been a steady increase in the share of products with “High” and “Very High” income content (from a total weight of 33% in 1995 to 44% in 2005), at the cost of the classes “Low” and “Very Low” (from 51% to 40%). This suggests that the increase in the average sophistication of the Portuguese export basket was achieved through a re-allocation of resources from products with low and very low implied productivity to products with higher implied productivity.
Table 2 also displays the contributions of the different classes of PRODY to the growth rate of Portuguese exports between 1995 and 2005. According to these data, the growth rate of exports (at current prices) between 1995 and 2005 was of 69%. The classes growing above the average were those with “Very High” (148%), “High” (110%) and “Average” (91%) income content. In terms of contributions, the first two classes, which represented about 1/3 of the exports in the beginning of the period, accounted for 58% of total export growth. This confirms a trend towards a specialization pattern more based on “rich country goods”.
In this section, we assess the extent to which foreign-owned firms had a role in the process of structural transformation of the Portuguese Economy, in the period from 1995 to 2005. For this purpose, we estimate the share of foreign-owned firms in the Portuguese exports, by product category, using data collected by the Portuguese Ministry of Labour and Social Solidarity on the composition of firms’ capital by nationality of owners. By “foreign-owned firms”, we mean those firms in which the proportion of capital owned by non-nationals is equal or greater than 50% (details in Appendix 4)12.
We first assess the extent to which foreign-owned firms have contributed to the growth of Portuguese exports. In Table 3, product categories are split into 5 groups of similar dimensions, according to their contribution to the growth of Portuguese exports in the period from 1995 to
28
29
very high (20% highest) 1479 8 2117 3668 12 3081 148 18 high 4429 25 5320 9292 32 6688 110 40 median 2551 15 2435 4879 17 2748 91 19 low 5422 31 3674 7534 26 3049 39 18 very low (lowest 20%) 3566 20 1517 4083 14 1037 14 4 Total 17448 100 15063 29456 100 16603 69 100Table 2 – The structure of Portuguese Exports by classe of PRODY11
1995 2005 Growth of exports1995-2005
PRODY Class Exports Share of
EXPY Exports Share of EXPY % change contribution
(10^6 euro) exports (10^6 euro) exports (p.p.)
11 In this and in the following tables, EXPY is calculated with 2005 PRODY values, and export shares are calculated at current prices.
12 Due to data limitations, in this section we restrict the analysis to 1.094 product categories (representing 96% of the Portuguese exports in 2005).
5. Foreign-owned firms, export growth and structural transformation in Portugal Sources: Own calculations, based on INE and COMTRADE data.
2005. Here, we see that the top 20% products in terms of contribution to export growth concentrate 83% of the estimated exports by foreign-owned firms in 2005. Table 3 also reveals that 12% of the estimated foreign-owned firms exports are related to products which exports have declined between 1995 and 2005. Coincidently, this is the only group of products in which the share of foreign-owned firms in total exports has diminished (from 32% in 1995 to 25% in 2005). This is suggestive of a strong impact of foreign firms on the variation of Portuguese exports, both positively and negatively13 14.
We next cross information on foreign-ownership and on the change of Portuguese specialization pattern, the later evaluated by organizing the export products according to their revealed comparative advantage (RCA) in 1995 and in 2005. In Table 4 we consider four types of products: the “classics” (i.e., products in which Portugal had a revealed comparative advantage both 1995 and in 2005); the “rarities” (products in which Portugal did not have a RCA in none of the years); the “emerging” (products in which Portugal gained a RCA between 1995 and 2005); and finally the “decaying” (products in which Portugal had a RCA in 1995 but not in 2005)15.
13 Actually, the direction of causality cannot be disentangled on the basis of the available data: multinational companies also tend to be attracted by fast exporting sectors. In a formal investigation, Magalhães and Africano (2007) find a significant correlation between the stock of (inward) FDI inflows and exports, suggesting at least a causality running from FDI to export growth.
14 It should be noted that these results are influenced by the bigger scale of foreign controlled firms with respect to the nationally controlled ones. To have an idea of the disproportion, in 2005 the average turnover of foreign-controlled firms in Portugal was about 24 times bigger than the average turnover of the remaining firms (source: Quadros de Pessoal database, GEP/MTSS). This figure considers all firms, independently of their involvement in international trade. If we were to consider only exporting firms, the contrast in the scales of foreign-dominated and other firms would surely be lower. Still, if we only consider firms with 50 employees or more, the average turnover of foreign-controlled firms in Portugal in 2005 was about 3.4 times higher than the average turnover of the remaining firms.
15 We partially borrow these expressions from Boccardo et al. (2007).
very high (20% highest) 218 49 72 106 35 40 53 83 high 219 5 5 6 23 27 4 4 median 219 1 1 1 22 28 1 1 low 219 0 0 0 18 34 0 0 very low (lowest 20%) 219 42 17 -20 32 25 43 12 All products 1094 97 96 93 33 36 100 100
Table 3 – Share of foreign-owned firms in Portuguese exports by contribution to export growth
Contribution to number of share of contribution share of foreign firms share of exports by export growth product exports (%) to export in total exports (%) foreign firms (%) between 1995 classes
1995 2005 growth (%) 1995 2005 1995 2005
and 2005
Sources: Own calculations, based on INE and GEP/MTSS, Quadros de Pessoal.
Notes: The table does not include data on 140 product classes, for wich there is not data available on the presence of foreign-owned firms; the share of foreign-owned firms in each group is calculated as the weighted average of the foreign-owned firms shares in the exports in each product, with the weights given by the share of each product in the exports of the group.
According to Table 4, the “emerging” was the group that contributed the most to the increase in exports (45%), reflecting the role of non-traditional products to the expansion of Portuguese exports. As far as the role of foreign-owned firms is concerned, we observe that the “emerging” group is also the one in which the share of foreign-owned firms in total exports was larger, both in 1995 (64%) and in 2005 (52%). The last column in the right hand side of Table 4 examines the distribution of
30
31
classics 175 67 54 35 26 26 54 41 rarities 682 12 15 19 33 46 12 20 emerging 110 10 24 45 64 52 21 36 decaying 51 8 2 -5 52 46 13 3 All products 1094 97 96 93 33 36 100 100Table 4 – Share of foreign-owned firms in Portuguese exports by RCA change
number of share of contribution share of foreign firms share of exports by Types product exports (%) to export in total exports (%) foreign firms (%) of products classes
1995 2005 growth (%) 1995 2005 1995 2005
Sources: Own calculations, based on INE and GEP/MTSS, Quadros de Pessoal.
Notes: The table does not include data on 140 product classes, for wich there is not data available on the presence of foreign-owned firms; the share of foreign-owned firms in each group is calculated as the weighted average of the foreign-owned firms shares in the exports in each product, with the weights given by the share of each product in the exports of the group; firms are considered “foreign” if the percentage of capital held by non-nationals is greater or equal to 50%.
very high (20% highest) 217 8 10 13 34 43 9 13 high 235 25 31 40 50 56 40 50 median 216 14 16 19 33 33 14 16 low 215 30 25 17 25 17 23 12 very low (lowest 20%) 211 20 13 4 23 24 14 9 All products 1094 97 96 93 33 36 100 100
Table 5 – The role of foreign-owned firms in Portuguese exports by classes of PRODY16
number of share of contribution share of foreign firms share of exports by Prody Class product exports (%) to export in total exports (%) foreign firms (%)
in 2005 classes
1995 2005 growth (%) 1995 2005 1995 2005
Sources: Own calculations, based on INE, COMTRADE and GEP/MTSS, Quadros de Pessoal.
Notes: The table does not include data on 140 product classes, for wich there is not data available on the presence of foreign-owned firms; the share of foreign-owned firms in each group is calculated as the weighted average of the foreign-owned firms shares in the exports in each product, with the weights given by the share of each product in the exports of the group; firms are considered “foreign” if the percentage of capital held by non-nationals is greater or equal to 50%.
16 In this and in the following tables, the share of foreign-owned firms in each group is calculated as the weighted average of the foreign-owned firms shares in the exports in each product, with the weights given by the share of each product in the exports of the group (for further details see appendix 4).
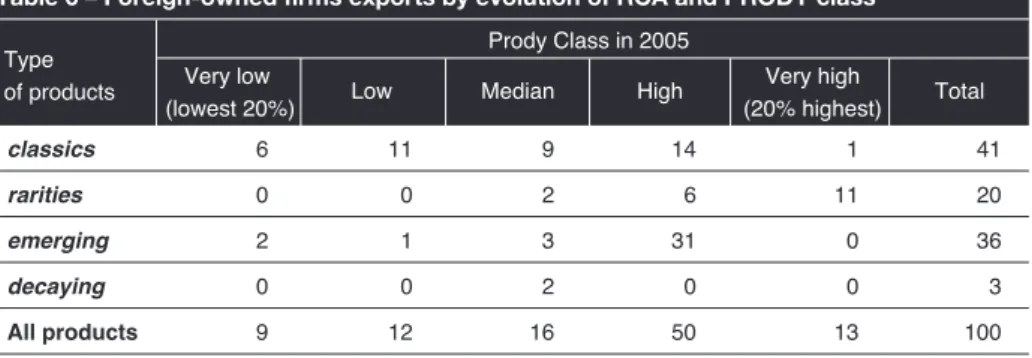
owned firms’ exports. The table reveals that the group of “classics” is dominant in foreign--owned firms’ exports, but with a loosing weight (41% in 2005, as compared to 54% in 1995). The non-traditional products (“emerging” plus “rarities”), in turn, are of increasing importance and, taken together, already accounted for 56% of the foreign-commanded exports in 2005 (33% in 1995). We now investigate the role of foreign-owned firms in the upscale move of the Portuguese specialization pattern. Table 5 analyses the presence of foreign-owned firms in exports per class of income content. According to these estimates, the share of those firms in total exports increased from 33% in 1995 to 36% in 2005. In 2005, the classes of PRODY with higher presence of foreign-owned firms were, respectively, the “High” and “Very High” (weights equal to 56% and 43%, respectively). Moreover, in that year, 63% of exports by foreign firms were accounted for by these two classes.
In Figure 4, we compare the distributions of exports by classes of PRODY, for domestic firms and foreign firms, in 1995 and in 2005. We observe that the distribution of foreign-owned firms – led exports is more biased towards products with higher income content than the corresponding distribution of domestic firms (a simple Chi-square test rejects the hypothesis of equal distributions, at a 1% significance level). Furthermore, while in the case of “domestic” exports the shape of the distribution is approximately the same in 1995 and in 2005 (though with an increase in the weight of products with higher income content), in the case of foreign-owned firms there is a visible change in the shape of the distribution (also confirmed by the Chi-square test). In particular, the distribution of foreign-commanded exports by class of PRODY has changed from a bi-modal to a one-modal one, with half of exports concentred in the class of “High” PRODY value.
Finally, we assess whether the increasing role of foreign-owned firms in exports with high income content refers to traditional or to non-traditional sectors. In Table 6, we cross the information on Figure 4 – Share of exports of different PRODY classes
50 40 30 20 10 0 very low (lowest 20%)
Sources: Own calculations based on INE, COMTRADE and GEP/MTSS.
low median high very high (20% highest) 50 40 30 20 10 0 very low (lowest 20%)
low median high very high (20% highest) 1995 2005 “domestic” exports “FDI exports” “domestic” exports “FDI exports”
exports by foreign affiliates per historical status (Table 4) with the information on exports by foreign affiliates per classes of PRODY (Table 5), for the year 2005. We observe that 31% of the foreign-owned firms exports correspond to “emerging” products with “High” income content and other 11% correspond to “rarities” with “Very High” income content.
Table 7 illustrates the results discussed in this section by providing information on the 20 product categories that have contributed the most for the growth in Portuguese exports between 1995 and 2005 (these were responsible for 60% of the total increase in exports during this period). In the table we see that foreign-owned firms accounted for at least 2/3 of the exports in 2005 in 8 out of those 20 product categories. With two exceptions, the share of foreign-owned firms in these foreign-owned firms – dominated products was already significant in 1995. Only 3 of these 8 cases consist in “classic” exports, the others being non-traditional products. And in all but two of these products (namely, cigarrets and rubber tyres), the income content is either “High” or “Very High”. This table also illustrates the relevance of the automotive and related industries in the processes discussed above: Motor cars and Parts and accessories of motor vehicles, both classified as products with high PRODY values, are responsible for 19% of the growth observed in Portuguese exports.
32
33
classics 6 11 9 14 1 41 rarities 0 0 2 6 11 20 emerging 2 1 3 31 0 36 decaying 0 0 2 0 0 3 All products 9 12 16 50 13 100Table 6 – Foreign-owned firms exports by evolution of RCA and PRODY class Prody Class in 2005
Type Very low
Low Median High Very high Total
of products (lowest 20%) (20% highest)
Sources: Own calculations based on INE and GEP/MTSS, Quadros de Pessoal.
Notes: The table does not include data on 140 product classes, for wich there is not data available on the presence of foreign-owned firms; the share of foreign-owned firms in each group is calculated as the weighted average of the foreign-owned firms shares in the exports in each product, with the weights given by the share of each product in the exports of the group; firms are considered “foreign” if the percentage of capital held by non-nationals is greater or equal to 50%.
8 70 3 M ot or ca rs a nd o th er m ot or ve hic les p rin cip all y d es ign ed fo r t he tr an sp or t… 7 11 99 84 Hi gh em er gi ng 8 70 8 Pa rts a nd a cc es so rie s of th e m ot or v eh icl es o f h ea di ng s 87 .0 1 to 8 7. 05 . 4 8 56 66 Hi gh em er gi ng 8 47 3 Pa rts a nd a cc es so rie s fo r u se w ith m ac hi ne s of h ea di ng 8 4. 69 to 8 4. 72 2 5 28 n. a. Ve ry H ig h em er gi ng 2 71 0 Pe tro le um o ils , o th er th an c ru de 4 5 0 0 Lo w cla ss ics 9 40 1 Se at s (o th er th an th os e of h ea di ng 9 4. 02 ), wh et he r o r n ot co nv er tib le in to … 2 3 5 0 M ed ia n cla ss ics 4 80 2 Un co at ed p ap er a nd p ap er bo ar d, o f a k in d us ed fo r w rit in g 2 3 1 0 Ve ry H ig h cla ss ics 8 52 7 Re ce pt io n ap pa ra tu s fo r r ad io -te le ph on y, ra di o-te le gr ap hy or ra di o-br oa dc as … 3 3 93 98 Hi gh cla ss ics 8 54 2 El ec tro ni c in te gr at ed c irc ui ts a nd m icr oa ss em bl ie s 2 3 80 95 Ve ry H ig h ra rit ie s 6 10 9 T-sh irt s, s in gl et s an d ot he r v es ts , k ni tte d or c ro ch et ed 2 3 31 33 Ve ry lo w cla ss ics 4 01 1 Ne w pn eu m at ic ty re s, o f r ub be r 1 3 75 93 M ed ia n cla ss ics 7 60 1 Un wr ou gh t a lu m in iu m 1 2 0 12 M ed ia n em er gi ng 2 40 2 Ci ga rs , c he ro ot s, c ig ar illo s an d cig ar et te s 1 2 4 85 Ve ry lo w em er gi ng 3 00 4 M ed ica m en ts (e xc lu di ng g oo ds o f h ea di ng 3 0. 02 , 3 0. 05 o r 3 0. 06 ) 1 2 38 36 Ve ry H ig h ra rit ie s 8 48 1 Ta ps , c oc ks , v al ve s an d sim ila r a pp lia nc es fo r p ip es , b oi le r s he lls 1 1 14 78 Hi gh em er gi ng 7 21 4 O th er b ar s an d ro ds o f i ro n or n on -a llo y st ee l, no t f ur th er w or ke d th an fo r… 1 1 0 0 Lo w em er gi ng 2 20 4 W in e of fr es h gr ap es , i nc lu di ng fo rti fie d wi ne s 2 1 31 18 Lo w cla ss ics 2 90 1 Ac yc lic h yd ro ca rb on s 1 1 5 73 Hi gh cla ss ics 4 50 4 Ag gl om er at ed c or k (w ith o r w ith ou t a b in di ng s ub st an ce ) 1 1 8 8 Hi gh cla ss ics 8 48 0 M ol di ng b ox es fo r m et al fo un dr y; m ou ld b as es ; m ol di ng p at te rn s 1 1 4 6 Hi gh cla ss ics 4 50 3 Ar tic le s of n at ur al c or k 1 1 8 8 Hi gh cla ss ics To ta l o f 2 0 pr od uc ts c on tri bu tin g m os t t o ex po rt gr ow th 39 60 46 50 – – T ab le 7 – T o p 2 0 p ro d uc ts in t er m s o f co nt ri b ut io n to e xp o rt g ro w th sh ar e of sh ar e of sh ar e of co nt rib ut io n fo re ig n fo re ig n Pr od y va lu e Co de Co m m od ity ex po rts in to e xp or t fir m s in fir m s in in 2 00 5 RC A cla ss 20 05 (% ) gr ow th (% ) ex po rts in ex po rts in 19 95 (% ) 20 05 (% ) So ur ce s: O wn c al cu la tio ns b as ed o n IN E an d G EP /M TS S.
In this paper, we document that the average income content of the Portuguese exports has grown above the world average between 1995 and 2005. This evolution is related to an above average “structural transformation effect” (that is, a shift in the specialization pattern towards products with higher income content). Given the increasing competition from emerging economies in the traditional segments, had the Portuguese export basket remained stuck, its average income content would have grown less than the world average.
Analysing in greater detail the evolution in the Portuguese export structure, we find an increasing role of the classes of products with “High” and “Very High” income content, both in terms of growth and in terms of contribution to growth. Between 1995 and 2005, these two classes accounted for 55% of the total export growth. Though using a different methodology, our evidence accords with the recent findings of Caldeira Cabral (2008) and Amador et al. (2007) who analysed the changing structure of Portuguese exports following the OECD classification of R&D intensities.
As far as the role of foreign-owned firms is concerned, we draw three main conclusions. First, foreign-owned firms have played a key role in the growth rate of Portuguese exports. In particular, we observe that the top 20% of products that most accounted for the growth in Portuguese exports concentrate 83% of the estimated exports by foreign firms in 2005. Second, we document that foreign-owned firms have contributed significantly to the change in the Portuguese specialization pattern. In particular, we find that the share of those firms in total exports is higher in the category of products in which Portugal recently achieved comparative advantage. Taken together, the non-traditional exports (e.g, those products in which Portugal had no revealed comparative advantage in 1995) accounted for 56% of the exports by foreign firms. Third, foreign affiliated firms have contributed to the upscale move of the Portuguese specialization pattern. For instance, we find that almost 2/3 of exports by foreign firms in Portugal in 2005 correspond to products with “High” and “Very High” income content. We also observe that the distribution of foreign-owned firms’ exports is more biased towards products with higher income content than the corresponding distribution for domestic firms and that this bias has increased over time. Taken together, this evidence suggests that foreign-owned firms have played a relevant role in the Portuguese export performance, both in terms of growth, diversification and upscale movement.
The evidence found in this paper complements those of Cabral (1996) and Magalhães and Africano (2007), who found that foreign investment has contributed to the expansion of Portuguese exports. The evidence in this paper does not, support, however, the IMF (2008, pp 97-103) claim that foreign investment did not contribute to boosting export performance or to upgrade Portuguese exports. The IMF conclusion is formulated observing that: (i) the sectors which experienced an increase in the shares of FDI since the mid-1990s were typically those with a lower growth of international demand, and (ii) rising FDI flows to “high-tech” sectors were offset by increasing “low-tech FDI”. A drawback in the IMF analysis is that the authors used a high level of aggregation and examined FDI financial flows, rather than exports by foreign affiliated firms, as we do in this paper.
34
Amador, J.; Cabral, S.; Maria, J. (2007) International Trade Patterns over the Last Four Decades: How Does Portugal Compare with Other Cohesion Countries?, Lisboa, Banco de Portugal, Working Paper N.º14.
Balassa, B. (1965) Trade Liberalization and Revealed Comparative Advantage, The Manchester School of Economic and Social Studies, 33(2), 99-123.
Boccardo, J.; Chandra, V.; Li, Y.; Osorio, I. (2007) Why Export Sophistication Matters for Growth?, mimeo.
Cabral, S. (1996) Comparative Export Behaviour of Foreign and Domestic Firms in Portugal, Lisboa, Banco de Portugal, Working Paper N.º 8.
Caldeira Cabral, M. (2008) Export Diversification and Technological Improvement: Recent Trends in the Portuguese Economy, Lisboa, GEE Papers N.º 6, Gabinete de Estratégia e Estudos, Ministério da Economia e Inovação.
Di Maio, M.; Tamagni, F. (2007) The Evolution of the World Trade and the Italian “Anomaly”: A New Look, Università degli Studi di Macerata, mimeo.
Flores, R.; Fontoura, M.; Santos, R. (2007) Foreign Direct Investment Spillovers: Additional Lessons from a Country Study, The European Journal of Development Research, 19 (3), 372-390. Fosfuri, A.; Motta, M.; Ronde, T. (2001) Foreign Direct Investment and Spillovers Through Workers’ Mobility, Journal of International Economics, 53, 205-22.
Guimarães, P.; Figueiredo, O.; Woodward, D. (2000) Agglomeration and the Location of Foreign Direct Investment in Portugal, Journal of Urban Economics, 47, 115-135.
Hausmann, R.; Hwang, J.; Rodrik, R. (2007) What You Export Matters, Journal of Economic Growth, 12, 1-25.
International Monetary Fund (2007) World Economic Outlook Database.
International Monetary Fund (2008) France, Greece, Italy, Portugal, and Spain: Competitiveness in the Southern Euro Area, IMF Country Report No. 08/145.
Keller, W. (2004) International Technological Diffusion, Journal of Economic Literature, 42, 752-782.
Krugman, P. (1987) The Narrow Moving Band, the Dutch Disease and the Competitive Consequences of Mrs. Thatcher, Journal of Development Economics, 27, 41-55.
Lebre de Freitas, M., Susana Salvado (2008) Industry Similarities, Comparative Advantage and Upscale Opportunities for Portugal in the Process of Structural Transformation: An Empirical Assessment Based on 2005 Trade Data, Paper presented at the 2008 Meeting of the European Economic Association.
Lucas, R. (1988) On the Mechanics of Economic Development, Journal of Monetary Economics, 22, 3-42.
Magalhães, M.; Africano, A. (2007) A Panel Analysis of the FDI impact on International Trade, Universidade do Minho, NIPE WP 6.
Markusen, J.; Venables, T. (1999) Foreign Direct Investment as a Catalyst for Industrial Development, European Economic Review, 43(2), 335-356.
Matsuyama, K. (1992) Agriculture Productivity, Comparative Advantage and Economic Growth, Journal of Economic Theory, 58, 317-334.
OECD (2008) OECD Economic Surveys: Portugal, Paris, OECD. References
Rodriguez-Crare, A. (1996) The Division of Labour and Economic Development, Journal of Development Economics, 49, 3-32.
Rodriguez-Clare, A. (1996) Multinationals, Linkages, and Economic Development, American Economic Review, 86, 852-873.
Rodrik, D. (1996) Coordination Failures and Government Policy: A Model with Applications to East Asia and Eastern Europe, Journal of International Economics, 40, 1-22.
Rodrik, D. (2007) One Economics, Many Recipes: Globalization, Institutions, and Economic Growth, Princeton, Princeton University Press.
UNCTAD (2007) United Nations Conference on Trade and Development World Investment Report 2007.
Young, A. (1991) Learning by Doing and the Dynamic Effects of International Trade, Quarterly Journal of Economics, 106, 369-405.
36
37
The PRODY index measures the “income content” of each product, as a weighted average of per capita incomes of the countries that export it. For each product i, the PRODY index is computed as:
where Ycis real GDP per capita in the c-th country, M is the number of countries and the weights σicnormalize the Balassa (1958) index of Revealed Comparative Advantage (RCA) of the c-country with respect to all the countries exporting in the same sector.
The average income content of a country export basket, EXPY, is computed, for each country, according to:
Appendix 1: Definitions of PRODY and EXPY
PRODYi =
c∈Cσ
c i Yc, where σic = RCAic , RCAic = Xic / Xc , C = {1, 2, ……, M },
Σ
Σ
d∈C
RCAid Xi / X
EXPYc =
i
Si PRODYi, where Si = Xic , is the share of product i in the exports of country c.
Let Et
ibe the value of EXPY of country iin year t, s t
ijthe share of product jin the total exports of country iin year t, and Pj tthe PRODY value of product jin year t. The change in EXPY from tto t + ncan be decomposed as follows:
The first component of this expression is the pure “structural transformation effect” (it tells how the EXPY would have changed if the PRODY values of the different products did not change between 1995 and 2005), the last component gives the pure “PRODY effect” (it shows how the EXPY of a country would have changed if there had been no transformation in its export structure), and the component in the middle is the “mixed effect” (which takes into account the fact that the impact of changes in PRODY values on the country’s EXPY are amplified when they refer to products which have gained weight in the country’s export basket and vice-versa). Dividing both sides of the equation by the initial EXPY value, the decomposition appears in growth rates. The following table displays the results in the later form for 81 countries.
38
39
Appendix 2: Decomposing the growth of EXPY at current PRODYΣ
Ei t+n – Ei t = sij t+n . Pj t+n – sij t . Pj t =(
sij t+n . Pj t+n – sij t . Pj t)
=[(
sij t+n – si t)
. Pj t+n + sij t .(
Pj t+n – Pj t)]
=(
sij t+n – sij t)
. Pj t+n + sij t .(
Pj t+n – Pj t)
=(
sij t+n – sij t)
. Pj t +(
sij t+n . Pj t+n + sij t . Pj t – sij t+n . Pj t – sij t . Pj t+n)
+ sij t .(
Pj t+n – Pj t)
Σ
j jΣ
jΣ
jΣ
jΣ
Σ
j jΣ
jΣ
jArgentina 9.909 12.964 31 73 29 2 -1 Australia 11.328 16.762 48 33 42 4 2 Austria 13.656 18.599 36 67 35 2 -1 Belize 5.731 7.150 25 81 42 -7 -10 Bolivia 6.825 11.038 62 13 29 -1 34 Brazil 10.231 15.063 47 35 39 1 6 Cameroon 6.681 11.054 65 12 45 -7 27 Canada 9.200 14.537 58 19 42 6 9 Chile 9.012 17.340 92 6 70 -20 42 China 6.875 9.736 42 47 49 -3 -4 Colombia 8.835 17.240 95 4 31 12 52 Costa Rica 10.981 13.794 26 80 39 -3 -10 Cote d'Ivoire 6.963 13.918 100 3 39 5 56 Croatia 10.800 15.478 43 44 37 -1 7 Cyprus 10.540 17.699 68 11 35 7 25 Czech Rep. 12.360 18.053 46 38 38 0 7 Denmark 13.468 18.578 38 61 36 2 0 Dominica 5.680 8.071 42 46 32 -13 23 Ecuador 7.418 12.810 73 8 41 7 25 Estonia 10.810 16.380 52 29 39 -2 14 Finland 14.324 19.569 37 66 35 -1 2 France 13.077 18.493 41 48 37 3 2 Germany 14.054 19.363 38 62 36 1 1 Greece 9.828 15.363 56 23 37 9 11 Guatemala 6.419 10.376 62 14 41 -5 26 Honduras 4.365 9.321 114 2 47 -2 69
Hong Kong SAR 11.293 17.337 54 26 34 3 16
Hungary 11.332 18.071 59 16 37 0 22 Iceland 13.440 18.952 41 52 31 6 4 India 9.322 14.455 55 25 43 4 8 Ireland 14.585 23.438 61 15 39 16 6 Israel 12.411 18.550 49 31 43 6 0 Italy 12.880 17.886 39 59 36 2 1 Japan 14.547 19.575 35 70 34 1 0 Jordan 8.314 11.962 44 43 46 -12 10 Kazakhstan 9.216 14.460 57 21 56 -9 11 Kiribati 4.527 5.854 29 77 55 -60 35 Kyrgyzstan 6.968 9.237 33 72 80 -62 14 Latvia 10.023 15.236 52 28 49 -5 8 Lithuania 10.177 15.041 49 34 45 -2 5 Madagascar 4.205 9.458 125 1 50 -5 80 EXPY growth
Pure Prody Mixed Pure
EXPY 1995 EXPY 2005
40
41
Malawi 2.921 4.589 57 20 38 -5 24 Malaysia 12.387 17.095 38 60 31 0 7 Maldives 7.396 12.827 73 7 49 -13 37 Malta 13.293 18.710 41 53 31 5 5 Mauritius 7.582 11.988 58 18 34 1 23 Mexico 12.152 16.998 40 54 35 0 5 Morocco 6.791 10.775 59 17 42 -6 22 Mozambique 4.692 6.528 39 58 55 -86 70 Netherlands 13.044 17.928 37 63 35 1 1 New Zealand 11.848 17.120 44 40 41 0 3 Nicaragua 5.901 8.213 39 57 57 -31 13 Niger 3.985 5.159 29 76 35 -22 17 Norway 12.673 16.532 30 75 36 -3 -3 Oman 11.195 15.379 37 64 37 -4 4 Panama 6.111 10.357 69 9 44 -14 39 Paraguay 6.713 9.031 35 71 36 -10 8 Peru 6.233 8.984 44 42 54 -12 2 Poland 10.916 16.730 53 27 39 1 13 Portugal 11.058 16.394 48 32 35 5 9 Rep. of Korea 12.787 18.280 43 45 34 0 9 Rep. of Moldova 8.213 10.547 28 78 41 -15 2 Romania 10.241 14.465 41 50 39 -2 4 Saudi Arabia 10.863 15.360 41 49 41 -1 2 Singapore 13.903 18.792 35 69 32 3 1 Slovakia 11.472 17.148 49 30 39 2 8 Slovenia 12.629 18.561 47 36 41 3 4 Spain 12.507 17.475 40 55 38 1 1 Sweden 14.143 19.332 37 65 37 1 -1 Switzerland 15.117 21.842 44 41 38 6 0 TFYR of Macedonia 8.939 12.107 35 68 42 -8 2 Thailand 11.246 16.484 47 37 32 3 11 Togo 6.153 8.039 31 74 42 -40 28Trinidad and Tobago 8.994 14.064 56 22 52 -9 13
Tunisia 8.683 12.668 46 39 31 4 12 Turkey 9.124 14.247 56 24 33 6 17 Uganda 4.493 8.732 94 5 34 -8 68 United Kingdom 13.689 19.312 41 51 38 2 2 Uruguay 10.645 13.523 27 79 28 2 -3 USA 13.700 19.078 39 56 35 2 2 Zambia 3.376 5.701 69 10 76 -87 80 EXPY growth
Pure Prody Mixed Pure
EXPY 1995 EXPY 2005
A p p en d ix 3 : E xp o rt s sh ar es b y cl as s o f P R O D Y Ar ge nt in a 39 25 20 12 4 10 0 35 27 20 13 4 10 0 36 ,8 26 ,1 22 ,7 10 ,7 3, 8 10 0 Au st ra lia 26 20 33 14 7 10 0 24 18 33 15 11 10 0 20 22 33 13 13 10 0 17 ,5 18 ,6 42 ,4 11 ,7 9, 8 10 0 Au st ria 6 16 20 34 24 10 0 5 14 18 37 24 10 0 4, 3 17 ,1 18 ,6 35 ,3 24 ,7 10 0 Be liz e 69 27 2 3 1 10 0 62 36 1 1 0 10 0 67 ,8 29 ,4 1, 3 0, 7 0, 7 10 0 Bo liv ia 64 23 11 2 0 10 0 61 11 14 12 1 10 0 42 ,3 18 ,1 37 ,9 1, 1 0, 5 10 0 Br az il 28 25 24 17 6 10 0 30 20 24 19 6 10 0 24 18 24 26 8 10 0 23 ,8 21 ,8 24 ,2 21 ,5 8, 8 10 0 Ca m er oo n 38 51 10 1 0 10 0 24 68 8 0 0 10 0 28 ,5 64 ,1 6, 7 0, 5 0, 2 10 0 Ca na da 9 18 24 33 17 10 0 8 17 22 35 18 10 0 6 18 24 35 18 10 0 6, 1 21 ,1 27 ,5 30 ,4 15 ,0 10 0 Ch ile 64 22 7 6 1 10 0 59 20 9 11 2 10 0 56 22 10 10 2 10 0 65 ,6 17 ,9 8, 9 5, 3 2, 3 10 0 Ch in a 27 24 18 20 12 10 0 20 21 18 25 15 10 0 13 ,0 16 ,7 18 ,2 30 ,1 22 ,0 10 0 Ch in a Ho ng Ko ng S AR 15 17 18 25 24 10 0 13 15 17 27 29 10 0 9, 7 11 ,0 13 ,4 25 ,0 40 ,9 10 0 Co lo m bi a 49 28 14 6 3 10 0 29 43 16 9 3 10 0 30 ,8 36 ,0 21 ,6 8, 3 3, 3 10 0 Co st a Ri ca 64 19 9 5 3 10 0 32 13 10 5 40 10 0 30 ,5 14 ,0 13 ,7 7, 5 34 ,2 10 0 Co te d ’Iv oi re 54 ,8 37 ,8 3, 2 3, 4 0, 8 10 0 Cr oa tia 20 29 27 16 8 10 0 17 29 32 14 9 10 0 12 ,5 31 ,3 29 ,7 17 ,3 9, 2 10 0 Cy pr us 32 32 21 10 6 10 0 42 21 21 6 10 10 0 40 23 16 12 9 10 0 7, 7 27 ,2 13 ,6 13 ,6 37 ,9 10 0 Cz ec h Re p. 9 21 27 30 12 10 0 6 16 26 40 12 10 0 4, 5 14 ,5 24 ,1 44 ,3 12 ,7 10 0 De nm ar k 10 17 27 20 26 10 0 9 16 27 21 27 10 0 9 19 21 21 30 10 0 7, 7 19 ,6 19 ,7 22 ,5 30 ,6 10 0 Do m in ica 81 10 6 2 1 10 0 59 25 14 2 1 10 0 53 ,3 28 ,6 16 ,2 1, 0 1, 0 10 0 Ec ua do r 54 41 2 2 1 10 0 38 56 3 2 1 10 0 30 ,8 64 ,4 2, 3 1, 7 0, 9 10 0 Es to ni a 21 29 21 15 14 10 0 13 26 20 11 30 10 0 8, 9 28 ,6 20 ,1 17 ,1 25 ,2 10 0 Fi nl an d 6 15 14 24 41 10 0 4 14 15 25 42 10 0 3 13 12 21 51 10 0 3, 7 13 ,5 11 ,5 22 ,1 49 ,2 10 0 Fr an ce 7 17 22 35 19 10 0 6 15 20 35 25 10 0 5, 4 15 ,9 19 ,2 36 ,0 23 ,6 10 0 G er m an y* 5 11 20 41 23 10 0 5 10 19 41 24 10 0 4 9 18 43 26 10 0 3, 8 9, 4 17 ,3 42 ,7 26 ,8 10 0 G re ec e 35 39 17 7 3 10 0 32 37 18 9 4 10 0 25 37 18 11 10 10 0 19 ,8 32 ,7 20 ,8 13 ,6 13 ,1 10 0 G ua te m al a 66 17 10 3 4 10 0 56 24 13 3 4 10 0 59 ,7 20 ,6 11 ,5 3, 8 4, 3 10 0 Ho nd ur as 86 9 3 1 0 10 0 72 18 7 3 0 10 0 61 ,4 23 ,4 8, 2 4, 8 2, 2 10 0 Hu ng ar y 16 23 29 21 11 10 0 7 13 19 43 18 10 0 4, 6 12 ,4 19 ,0 42 ,3 21 ,7 10 0 Ic el an d 46 37 12 4 1 10 0 49 32 12 4 2 10 0 43 29 21 3 3 10 0 38 ,7 27 ,2 20 ,8 6, 7 6, 6 10 0 In di a 48 13 27 7 5 10 0 44 15 26 9 6 10 0 37 20 25 10 8 10 0 27 ,2 26 ,7 26 ,2 12 ,1 7, 8 10 0 Ire la nd 4 11 17 25 43 10 0 2 6 8 21 63 10 0 1, 8 6, 1 6, 7 17 ,8 67 ,6 10 0 Is ra el 8 11 41 14 26 10 0 5 7 37 15 35 10 0 4, 1 7, 0 61 ,6 12 ,6 24 ,7 10 0 Ita ly 9 21 24 28 19 10 0 8 20 23 28 20 10 0 6, 9 20 ,2 23 ,1 28 ,4 21 ,4 10 0 Ja pa n 2 5 18 46 29 10 0 1 5 18 42 33 10 0 1 5 16 42 36 10 0 1, 5 6, 1 16 ,9 42 ,1 33 ,3 10 0 Jo rd an 42 24 11 11 11 10 0 29 22 25 15 10 10 0 43 ,1 24 ,1 16 ,6 7, 2 9, 0 10 0 Ka za kh ist an 27 38 23 7 4 10 0 18 67 12 2 1 10 0 14 ,9 74 ,5 8, 9 1, 4 0, 3 10 0 Ki rib at i 79 21 0 0 0 10 0 81 ,2 11 ,5 6, 6 0, 2 0, 5 10 0 Ky rg yz ta n 41 31 10 15 3 10 0 62 25 6 6 2 10 0 64 ,3 22 ,6 7, 3 4, 8 1, 0 10 0 La tv ia 19 44 17 11 9 10 0 18 48 19 7 7 10 0 12 ,5 46 ,0 19 ,9 12 ,9 8, 7 10 0 Li th ua ni a 15 40 26 12 7 10 0 18 43 22 12 5 10 0 10 ,9 44 ,9 23 ,6 15 ,2 5, 4 10 0 M ad ag as ca r 86 9 3 1 1 10 0 85 10 4 2 0 10 0 64 29 3 3 1 10 0 70 ,7 20 ,8 3, 9 2, 4 2, 1 10 0 19 90 19 95 20 00 20 05 V er y Lo w M ed ia n H ig h V er y To ta l V er y Lo w M ed ia n H ig h V er y To ta l V er y Lo w M ed ia n H ig h V er y To ta l V er y Lo w M ed ia n H ig h V er y To ta l Lo w H ig h Lo w H ig h Lo w H ig h Lo w H ig h
42
43
A p p en d ix 3 : E xp o rt s sh ar es b y cl as s o f P R O D Y (c on t. ) M al aw i 95 3 1 1 0 10 0 93 3 2 1 0 10 0 93 2 3 1 0 10 0 92 ,6 3, 1 2, 2 1, 6 0, 5 10 0 M al ay sia 23 30 14 12 21 10 0 17 14 17 22 30 10 0 9 12 17 23 39 10 0 11 ,0 14 ,4 18 ,1 25 ,2 31 ,3 10 0 M al di ve s 61 39 0 0 0 10 0 65 35 0 0 0 10 0 19 ,3 75 ,2 2, 5 2, 3 0, 8 10 0 M al ta 13 6 42 9 31 10 0 7 8 7 10 68 10 0 5, 4 4, 2 56 ,4 20 ,3 13 ,7 10 0 M au rit iu s 72 17 5 2 4 10 0 74 15 4 3 3 10 0 60 ,0 13 ,1 5, 9 4, 2 16 ,9 10 0 M ex ico 12 48 10 24 5 10 0 11 25 17 36 11 10 0 8 22 17 38 15 10 0 6, 4 27 ,0 18 ,7 34 ,2 13 ,7 10 0 M or oc co 64 26 6 4 1 10 0 51 ,6 32 ,5 11 ,0 3, 5 1, 3 10 0 M oz am bi qu e 79 12 4 4 1 10 0 52 27 19 1 1 10 0 75 ,8 13 ,5 8, 3 2, 1 0, 3 10 0 Ne th er la nd s 11 18 22 26 23 10 0 9 17 16 28 30 10 0 8, 7 18 ,5 18 ,1 25 ,0 29 ,7 10 0 Ne w Ze al an d 9 28 25 28 10 10 0 11 26 27 26 10 10 0 10 25 28 26 12 10 0 8, 5 24 ,4 29 ,8 24 ,9 12 ,4 10 0 Ni ca ra gu a 62 20 4 7 7 10 0 75 17 6 1 1 10 0 64 ,8 26 ,3 6, 4 1, 5 1, 0 10 0 Ni ge r 90 3 2 5 0 10 0 78 6 5 11 1 10 0 88 ,3 2, 9 2, 6 5, 7 0, 5 10 0 No wa y 6 54 23 8 10 10 0 3 64 20 5 7 10 0 2, 8 58 ,7 26 ,4 4, 8 7, 3 10 0 O m an 2 93 1 3 0 10 0 6 82 3 8 1 10 0 4 85 3 7 1 10 0 1, 9 73 ,2 23 ,2 1, 3 0, 4 10 0 Pa na m a 73 14 9 1 4 10 0 57 29 10 1 2 10 0 56 ,3 35 ,3 7, 4 0, 6 0, 5 10 0 Pa ra gu ay 78 19 3 0 0 10 0 81 14 3 1 1 10 0 80 14 4 1 1 10 0 69 ,0 21 ,5 7, 5 1, 0 1, 0 10 0 Pe ru 73 21 4 1 1 10 0 70 23 4 2 1 10 0 71 ,8 21 ,3 4, 2 2, 1 0, 6 10 0 Po la nd 20 24 37 14 7 10 0 13 20 35 24 7 10 0 8, 6 19 ,9 34 ,1 29 ,3 8, 0 10 0 Po rtu ga l 26 32 15 21 6 10 0 20 31 15 25 8 10 0 16 27 15 32 9 10 0 14 ,4 26 ,5 16 ,9 31 ,5 10 ,7 10 0 Re p. o f K or ea 17 25 20 21 17 10 0 9 17 21 27 24 10 0 7 16 19 28 30 10 0 3, 1 13 ,5 18 ,4 33 ,3 31 ,6 10 0 Re p. o f M ol do va 27 51 11 7 4 10 0 34 48 7 8 3 10 0 34 ,5 48 ,3 9, 9 5, 4 1, 9 10 0 Ro m an ia 8 43 25 21 4 10 0 23 38 23 11 4 10 0 27 35 19 11 7 10 0 20 ,2 38 ,7 20 ,6 16 ,8 3, 7 10 0 Sa ud iA ra bi a 1 89 7 3 0 10 0 1 93 4 3 0 10 0 0, 6 88 ,0 8, 0 2, 9 0, 4 10 0 Si ng ap or e 10 24 13 31 22 10 0 6 12 12 36 34 10 0 4 12 10 29 44 10 0 2, 7 15 ,2 10 ,2 23 ,0 48 ,9 10 0 Sl ov ak ia 11 30 28 23 8 10 0 8 25 23 37 7 10 0 5, 3 26 ,9 23 ,1 36 ,4 8, 3 10 0 Sl ov en ia 9 13 31 32 15 10 0 6 11 32 36 16 10 0 4, 6 11 ,5 28 ,7 38 ,2 17 ,0 10 0 Sp ai n 8 26 20 37 9 10 0 8 20 19 41 11 10 0 8 20 20 40 12 10 0 7, 4 20 ,1 20 ,8 37 ,4 14 ,3 10 0 Sw ed en 3 13 14 33 37 10 0 2 12 14 28 43 10 0 2, 9 14 ,9 14 ,8 29 ,4 38 ,1 10 0 Sw itz er la nd 4 8 18 25 44 10 0 3 8 17 26 46 10 0 2 7 17 23 50 10 0 2, 7 8, 8 12 ,3 19 ,4 56 ,8 10 0 TF YR o f M ac ed on ia 39 33 14 11 3 10 0 38 47 7 6 2 10 0 42 ,7 43 ,2 6, 1 5, 3 2, 7 10 0 Th ai la nd 45 16 14 11 14 10 0 31 15 17 21 15 10 0 21 14 20 20 24 10 0 17 ,2 14 ,9 22 ,1 30 ,1 15 ,7 10 0 To go 68 25 3 3 1 10 0 82 10 4 3 0 10 0 65 ,4 26 ,9 6, 7 0, 6 0, 5 10 0 Tr in id ad a nd T ob ag o 6 67 24 2 1 10 0 3 62 33 1 0 10 0 1, 6 52 ,1 44 ,6 0, 9 0, 8 10 0 Tu ni sia 53 32 6 6 2 10 0 48 36 6 9 2 10 0 38 ,6 38 ,7 7, 5 12 ,7 2, 5 10 0 Tu rk ey 48 33 11 6 2 10 0 41 35 14 8 2 10 0 34 30 18 14 3 10 0 24 ,4 29 ,8 24 ,9 17 ,8 3, 1 10 0 Ug an da 94 3 2 1 0 10 0 75 10 12 1 2 10 0 80 ,0 12 ,6 2, 2 2, 5 2, 7 10 0 Un ite d Ki ng do m 5 17 17 33 29 10 0 3 16 16 30 34 10 0 3, 3 17 ,7 15 ,9 27 ,8 35 ,2 10 0 Ur ug ua y 38 27 22 11 2 10 0 33 32 20 11 4 10 0 22 ,3 42 ,4 24 ,3 7, 2 3, 7 10 0 US A 10 10 16 35 30 10 0 7 9 15 36 34 10 0 6, 5 9, 3 16 ,3 35 ,8 32 ,1 10 0 Za m bi a 91 5 3 1 0 10 0 85 9 2 2 1 10 0 90 ,2 5, 7 3, 4 0, 4 0, 3 10 0 19 90 19 95 20 00 20 05 V er y Lo w M ed ia n H ig h V er y To ta l V er y Lo w M ed ia n H ig h V er y To ta l V er y Lo w M ed ia n H ig h V er y To ta l V er y Lo w M ed ia n H ig h V er y To ta l Lo w H ig h Lo w H ig h Lo w H ig h Lo w H ig h * F or m er F ed . R ep . o f G er m an y in 1 99 0.Although we have data on exports at the product level (including confidential positions), we do not know how much of these exports are conducted by foreign-controlled firms. In order to estimate the share of foreign-owned firms in the total exports of each product category, we used the “Quadros de Pessoal” database, which is compiled by the Portuguese Ministry of Labour and Social Solidarity. This database includes information on every firm with employed labour in Portugal, and contains a variable measuring the proportion of each firm’s capital held by non-nationals. We start with the concordance tables between the Combined Nomenclature of goods (at the 4 digit level of desegregation) and NACE (the Classification of Economic Activities in the European Community, at the 4 digit level of desegregation) for 1995 and 2005. There is a bi-univocal relation for 84% of the CN codes, but some of the product categories have more than on corresponding NACE code, as shown in the following table:
Using the information in “Quadros de Pessoal”, we computed the share of foreign-controlled firms (defined as those firms in which the proportion of capital owned by non-nationals is equal or greater than 50%) in the total sales turnover of each industry. Then, the share of foreign-owned firms in the exports of each CN category was computed as the weighted average of
foreign-owned firms’ shares each industry turnover, with weights given by the turnover of that industry. In those cases in which there is a bi-univocal relation between NC and NACE codes, we assume that the share of foreign-owned firms in the exports of a given product is simply the share of foreign-controlled firms in the corresponding industry (computed as above). In the other cases, the share of foreign-owned firms in the exports of each CN category was computed as the weighted average of the shares of foreign-owned firms in the turnover of each industry exporting that product, with weights given by the turnover of that industry. Formally,
where FXiis the share of foreign-owned firms in the exports of product i; FTjis the proportion of foreign-affiliated firms’ turnover in the total turnover of industry j; andaijis the weight of industry j in the total turnover of industries associated with the product i(according the concordance tables), i.e.,
Appendix 4: Estimating the role of foreign-owned firms in exports
1 924 84
2 139 13
3 or more 24 3
Total 1094 100
CN codes
Number of NACE codes for each CN code N.º %
FXi= a
Σ
ij FTj , j a ij = Tij/
Σ
Tij , j where Tij ={
turnover of industry j if jis associated with product i