and non-linear methods
Mirjana M. Brdar, Aleksandar A. Takači, Marina B. Šćiban, Dušan Z. Rakić
University of Novi Sad, Faculty of Technology, Novi Sad, Serbia
Abstract
Equilibrium studies were carried out for the adsorption of Cu(II) onto Kraft lignin as an ad-sorbent. The experimental data were fitted to the Freundlich, Langmuir and Redlich-Peter-son isotherms by linear and non-linear methods. CompariRedlich-Peter-son of linear and non-linear re-gression methods was given in selecting the optimum isotherm for the experimental data. The coefficient of correlation r2 and chi-square test χ2
were used to select the best linear theoretical isotherm. The best linear model is Redlich–Peterson isotherm model, where
r2 = 0.985 and χ2
= 0.02. In order to predict the error ERRSQ, HYBRD, MPSD, ARE and EABS were used. Moreover, by minimizing these error functions the optimal values of para-meters and also the optimum isotherm was found.The Redlich–Peterson isotherm was found to be the best representative for adsorption of Cu(II) on the adsorbent in the cases when ERRSQ, HYBRD and MPSD functions were used. Their coefficients of determination were 0.986, 0.985 and 0.984, respectively and chi-square was 0.02 in all cases. Freundlich isotherms obtained by minimization of the ERRSQ, HYBRD, MPSD, ARE and EABS function showed very good agreement with experimental data. In all cases the coefficients of deter-mination were greater than 0.91. Besides, it was observed that non-linear isotherm models were better for representation of equilibrium data than linearized models.
Keywords: adsorption isotherm, linear and non-linear methods, Cu(II), lignin.
SCIENTIFIC PAPER
UDC 66.081.3:546.56:665.947.4
Hem. Ind.66 (4) 497–503 (2012)
doi: 10.2298/HEMIND111114003B
Available online at the Journal website: http://www.ache.org.rs/HI/
There is increasing interest in the development of economically viable new applications of lignin, which can be found as waste from cellulose and paper indus-try. This is evidenced by the existence of the Interna-tional Lignin Institute, which promotes new technolo-gies with lignin as the main component. Among others, the possibility of using lignin as an adsorbent for diffe-rent pollutants from water has been considered [1]. Different functional groups of lignin provide binding of heavy metal ions. The lignin’s capacity depends on its origin, type of metal ions and experimental conditions. In this work, the lignin is used as an adsorbent for cop-per ions. Copcop-per has a number of important functions in the human body, but in large quantities, it also can cause different acute and chronic disorders. The World Health Organization’s guideline for drinking water re-commends the maximum permissible concentration for copper of 1 mg/L [2].
Equilibrium relationships between adsorbent and adsorbate are described by adsorption isotherms and characterized by certain constants, the values of which provide information on adsorbent capacity and affinity for some kind of adsorbate. In addition, the quality of the fit of experimental results indicates whether
Correspondence: M. Brdar, Faculty of Technology, University of Novi Sad, Bulevar cara Lazara 1, 21000 Novi Sad, Serbia.
E-mail: [email protected] Paper received: 14 November, 2011 Paper accepted: 30 December, 2011
sorption is monolayer or multilayer, on a homogeneous or heterogeneous surface. Isotherm equations do not consider which adsorption mechanisms, such as exter-nal mass transfer of solute, intraparticle diffusion or adsorption at sites, are decisive in the adsorption pro-cess, but can be used for design of batch adsorption systems. Some of the isotherm equations that can ex-plain solid–liquid adsorption systems are: Langmuir, Freundlcih, Temkin, Sips, Toth, Redlich–Peterson iso-therm equations [9].
Linear regression has been frequently used to de-termine the most fitted models and the method of least squares has been frequently used for finding the parameters of the models [3–6]. However, transfor-mations of non-linear isotherm equations to linear forms implicitly alter their error structure and may also violate the error variance and normality assumptions of standard least squares. In recent years, several error analysis methods, such as the coefficient of determi-nation, the sum of the errors squared, a hybrid error function, Marquardt’s percent standard deviation, the average relative error and the sum of absolute errors, have been used to determine the best-fitting isotherm [7–10].
Red-lich-Peterson isotherm model (Table 1) were analyzed. The well-known least square method was used to pre-dict the isotherm by linear regression method, i.e., the models were linearized and the parameters were found using the least square method. Generally, linearization leads to uncontrollable error margins, thus it is better to directly estimate the parameters of the model. For error estimation, ERRSQ, HYBRD, MPSD, ARE and EABS functions were used. Essentially, each of these func-tions is a distance function in the Cartesian plane. Since the optimal values of the parameters minimize the dis-tances of experimental results from the model iso-therm this means that the isoiso-therm obtained by these methods is the best approximation of experimental re-sults with respect to that distance function. The calcul-ations were made using the Wolfram Research soft-ware Mathematica 6.
Namely, the purpose of this paper is that the expe-rimental data obtained during the adsorption of copper ions on lignin serve as accurate representations of some commonly used models of adsorption isotherms, such as Freundlich, Langmuir and Redlich-Peterson. The aim is to highlight the role of the error function and the advantage of nonlinear methods in relation to linear ones.
EXPERIMENTAL
Materials
The 0.25 mol/L stock solution of copper was pre-pared by dissolving the desired quantity of CuSO4·5H2O
in one liter of distilled water. Prior to the adsorption experiments, water solutions of different copper con-centrations were prepared by dilution of stock solu-tions by distilled water and pH adjusment was made using HCl solution. All chemicals used were of analytical reagent grade.
Kraft lignin was obtained from the sulphate pulping process of poplar and beech wood (70:30) conducted in a pulp mill. Lignin was precipitated from black liquor with sulphuric acid and washed by distilled water. After filtering and drying at room temperature, the obtained lignin was in the form of fine black–brown powder (particle size < 0.25 mm). The BET surface area of Kraft lignin was measured and it was found to be 0.77 m2/g (Micrometrics, ASAP 2000, USA), which classifies it into adsorbents with a small surface area.
Batch adsorption studies
Batch adsorption experiments were carried out by shaking 5 g of Kraft lignin in 1 L of aqueous copper so-lution with different concentration (5 to 200 mg/L), at pH 4. The adsorption experiments were done at this pH value in accordance with results of previous investiga-tions [11,12]. That pH value is below the onset of metal hydroxid precipitation and then the copper is mostly in the form of Cu2+. The suspensions were shaken for 3 h at an agitation speed of 110 rpm. This contact time was sufficient to reach equilibrium [12]. After reaction time, the suspensions were filtered through a Gooch G4 fun-nel. The concentrations of copper ions in the aqueous solutions before (c0) and after adsorption (c) were
de-termined using a Pye-Unicam SP 191 atomic absorption spectrophotometer (Cambridge, UK). Experiments were performed in duplicate and the results were averaged.
The amount of copper ions adsorbed per specified amount of adsorbent, q, was calculated as follows:
0
c c
q m
−
= (1)
where m is mass of adsorbent per liter of solution. Adsorption isotherms
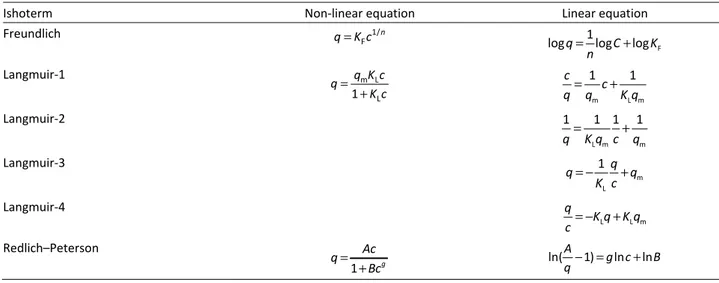
All isotherm equations and their linearized forms are presented in Table 1.
Table 1. Models of isotherm equation
Ishoterm Non-linear equation Linear equation
Freundlich 1/
F
n q=K c
F
1
logq logC logK n
= +
Langmuir-1 m L
L
1
q K c q
K c =
+ m L m
1 1
c c q=q +K q
Langmuir-2
L m m
1 1 1 1
q=K q c+q
Langmuir-3
m L
1 q
q q
K c
= − +
Langmuir-4
L L m q
K q K q c= − +
Redlich–Peterson
1 g
Ac q
Bc =
+ ln( 1) ln ln
A
g c B
The Freundlich equation is an empirical model that considers heterogeneous adsorptive energies on the adsorbent surface [13]. The parameters of this iso-therm can be obtained from the slope and intercept of plot log q versus log c.
The magnitude of the Freundlich adsorption capa-city n gives an indication of the favorability of adsorp-tion. The values of n in the range from 2–10 indicate good adsorption capacity, 1–2 moderate adsorption ca-pacity and less than 1 indicate poor adsorption caca-pacity. The Langmuir isotherm equation is derived from simple mass kinetics, assuming chemisorption [14]. This model is based on two assumptions: the forces of inter-action between adsorbed molecules are negligible and once a molecule occupies a site no further adsorption takes place. In this paper the Langmuir isotherms were linearized to four different types. The Langmuir-1 iso-therm was the most commonly used linear expression to study the relation between the concentration of so-lute in liquid phase and in the solid phase at equilibrium conditions. The Langmuir-2 isotherm was also used to explain the equilibrium phenomena of dye adsorption processes. The values of Langmuir constants qm and KL
can be calculated from the plots: c q/ =f c( ),
1 /q=f(1 / )c , q= f q c( / ) and q c/ = f q( ) for Lang-muir-1, -2, -3 and -4 isotherms, respectively.
The Redlich–Peterson isotherm [15], contains three parameters, A, B and g and the form of the equation includes features of the Langmuir and Freundlich iso-therms. The exponent, g, lies between 0 and 1. Thus, when g = 1, the Redlich–Peterson equation becomes the Langmuir equation, and, when g = 0, equation pre-sents the Henry’s law. This equation can be converted into a linear form but, the isotherm constants are not possible to obtain because of the three unknowns. The constant A was obtained by maximizing the value of coefficient of determination using software package Mathematica 6.
RESULTS AND DISCUSSIONS
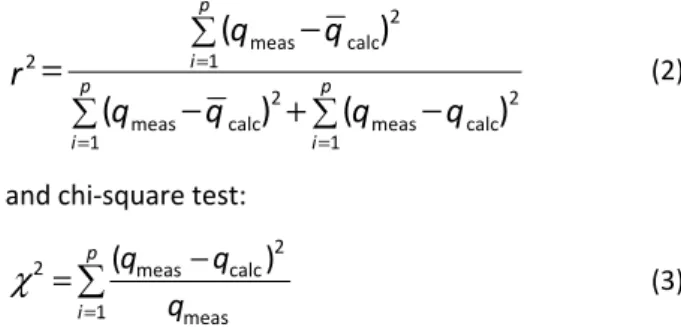
As a suitable measure for determination of the rela-tionship between independent and dependent vari-ables, the coefficient of determination was used:
2 meas calc 1
2
2 2
meas calc meas calc
1 1
(
)
(
)
(
)
p
i
p p
i i
q
q
r
q
q
q
q
=
= =
−
=
−
+
−
(2)
and chi-square test:
2
2 meas calc
1 meas
( )
p
i
q q q
χ
=
−
=
(3)where p denotes the number of experimental data, qcalc
is calculated equilibrium solid phase concentration, qmeas is measured equilibrium solid phase concentration
and qcalc is the average of qcalc. The advantage of using
the chi-square test was the comparison of all isotherms on the same abscissa and ordinate. If data from the model were similar to the experimental data, χ2 would be a small number or vice versa.
Linear method
The simplest method for determination of the iso-therm constants for two parameter isoiso-therms is to linearize the model equation and then apply linear regression.
From Table 2, it was observed that the Langmuir constants varied for different forms of linear Langmuir equations. This is because depending on the way iso-therm is linearized, the error distribution changes either the worse or the better. All types of linearized Lang-muir equation give a lower coefficient of determination and higher values of the chi-squared test compared to Freundlich and Redlich–Peterson isotherms and that suggests that the Langmuir equation is not appropriate to use. From Table 2 it can be seen that the Freundlich constant related to the adsorption intensity (n) is be-tween 6 and 7, which indicated that lignin has high affinity for copper removal. Also, high value of r2 and the very small values of χ2 for both Freundlich and Redlich–Peterson isotherms suggest that both models can be used to explain copper adsorption behavior. Based on these results it can be concluded that the surface area of Kraft lignin is heterogenous with dif-ferent adsorption sites. The capacity of lignin for cop-per ions is simmilar to other lignocellulosic adsorbents [1,16].
Table 2. Isotherm parameters obtained by linear regression method
Ishoterm KF/ mg g–1(L mg–1)n qm / mg g–1 A / L g–1 B /L mg1–1/A KL/ L mg–1 1/n g r2 χ2
Freundlich 1.628130 – – – – 0.148632 – 0.943476 0.13957
Langmuir-1 – 3.37995 – – 0.246773 – – 0.788194 1.89191
Langmuir-2 – 2.64700 – – 11.54270 – – 0.734178 0.32631
Langmuir-3 – 2.73844 – – 10.65550 – – 0.767616 0.32502
Langmuir-4 – 2.85213 – – 8.139280 – – 0.811769 0.34907
Therefore, from Figure 1 it can be seen that the Redlich–Peterson linearized isotherm model gave the best fit of the experimental data and explained the adsorption isotherm of copper onto lignin. Points on the graphs represent the experimental data.
Non-linear methods
Due to the inherent bias from linearization, alter-native isotherm parameter sets were determined by non-linear regression. This provides a mathematically rigorous method for determining the isotherm parame-ters by using the original form of the isotherm equa-tion. The optimization procedure requires the selection of an error function in order to evaluate the fit of the isotherm to the experimental data. The choice of error function can affect the parameters derived-error func-tions based primarily on absolute deviation bias the fit towards high concentration data and this weighting increases when the square of the deviation is used to penalize extreme errors.
ERRSQ – the sum of the squares of the errors:
(
meas calc)
21
p
i i
q q
=
−
(4)HYBRD – a composite fractional error function:
(
meas calc)
21 meas
p
i
q q
q
i =
−
(5)MPSD – a derivative of Marquardt’s percent stan-dard deviation:
2 meas calc
1 meas
p
i
q q
q i
=
−
(6)ARE – the average relative error:
meas calc
1 meas
p
i
q q
q i
=
−
(7)EABS – the sum of the absolute errors:
meas calc 1
p
i i
q q
=
−
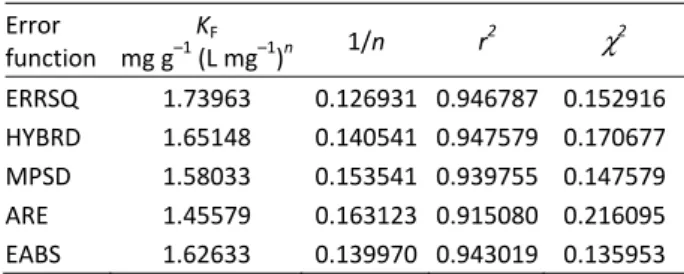
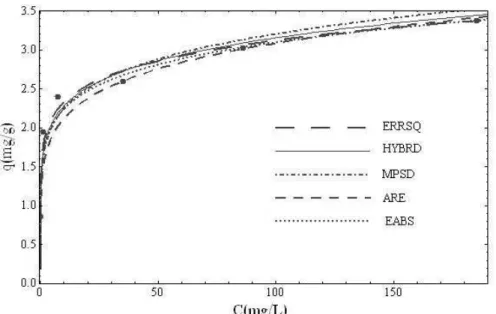
(8)where p denotes the number of experimental data. The explanations of various error functions used in the present study are given in Table 3 for Freundlich Equation, in Table 4 for Langmuir Equation and in Table 5 for Redlich–Peterson Equation. The Freundlich Equa-tion showed a very good agreement with our experi-mental data (Figure 2). It had a high value of r2 and low value of χ2 for all error function. The constant related to adsorption capacity was about 7, which shows that copper has very good adsorption characteristics. Table 3. Freundlich isotherm parameters obtained by mini-mizing the error distribution using different error functions
Error function
KF
mg g–1 (L mg–1)n 1/n r2 χ2
ERRSQ 1.73963 0.126931 0.946787 0.152916
HYBRD 1.65148 0.140541 0.947579 0.170677
MPSD 1.58033 0.153541 0.939755 0.147579
ARE 1.45579 0.163123 0.915080 0.216095
EABS 1.62633 0.139970 0.943019 0.135953
As it can be seen from the Table 4, the Langmuir isotherm does not represent the equilibrium equation well, but all error functions give the approximately the same value for qm (Figure 3).
Table 4. Langmuir isotherm parameters obtained by mini-mizing the error distribution using different error functions
Error function qm / mg g–1 KL / L mg–1 r2 χ2
ERRSQ 2.8514 4.19223 0.858974 0.426817
HYBRD 2.70171 9.39488 0.778946 0.314164
MPSD 2.61213 11.1800 0.728865 0.329032
ARE 2.60625 11.8894 0.716251 0.334938
EABS 3.04206 2.19007 0.876446 0.617294
Table 5 shows that the error functions ARE and EABS have low r2 and higher values of χ2 than other
error functions. This indicates that the ARE and EABS error functions are not good approximations of expe-rimental data with the model isotherm. The cause lies in the definition of these errors. But, the ERRSQ, HYBRD
and MPSD give excellent results of isotherm para-meters. If we consider only the first five error functions (ERRSQ, HYBRD and MPSD), it can be concluded that Redlich–Peterson provides better agreement than the Freundlich isotherm model.
Table 5. Redlich–Peterson isotherm parameters obtained by minimizing the error distribution using different error functions
Error function
A
L g–1
B
L mg1–1/A g r2 χ2
ERRSQ 53.1769 26.7504 0.904783 0.986118 0.021119 HYBRD 49.6404 24.6554 0.908584 0.985636 0.020521 MPSD 47.6677 23.4299 0.912062 0.984437 0.020971 ARE 0.91548 0.29720 0.995192 0.782122 1.809790 EABS 2.57947 1.18709 0.922565 0.849041 1.112110
Figure 2. Freundlich isotherms obtained using the non-linear method for the adsorption of copper ions onto lignin.
CONCLUSION
The equilibrium adsorption of copper ions onto Kraft lignin was explained using the Freundlich, Lang-muir and Radlich–Peterson isotherms. Often, lineari-zation is used for estimating the adsorption characte-ristics of certain adsorption systems, due to the simp-licity in estimation. The Redlich–Peterson isotherm was found to be the best model, with r2 = 0.985 and χ2 = = 0.02. The present investigations showed that the non-linear method is a better way to obtain the isotherm parameters. Freundlich isotherms obtained by minimi-zation of the ERRSQ, HYBRD, MPSD, ARE and EABS functions show very good agreement with experimen-tal data. In all cases the coefficients of determination were greater than 0.91. For the three-parameter iso-therm (Redlich–Peterson isoiso-therm), ERRSQ, HYBRD and MPSD functions were found to be an equally good op-tion to minimize the error. Error funcop-tions ARE and EABS are not the best choice for determining iso-therms. In linear and non-linear methods, where we used ERRSQ, HYBRD and MPSD function, the experi-mental equilibrium data of copper ions onto lignin showed the best results represented by the Redlich– –Peterson isotherm equation. Their coefficients of de-termination were 0.986, 0.985 and 0.984, respectively, and chi-square was 0.02 in all cases.
Nomenclature
KF (mg/g)(L/mg)n Constant for Freundlich equation
n Constant for Freundlich equation KL (L/mg) Constant for Langmuir equation
qm (mg/g) Saturation capacity-constant for
Langmuir
C (mg/L) Fluid adsorbate concentration q (mg/g) Solid adsorbate concentration A (L/g) Constant for Redlich–Peterson
equa-tion
B (L/mg1-1/A) Constant for Redlich–Peterson equa-tion
g Exponent in Redlich–Peterson iso-therm
Acknowledgement
The work presented here was supported by the Ministry of Education, Science and Technological Deve-lopment of the Republic of Serbia (Project III44006 and Project III43005).
REFERENCES
[1] P. J. M. Carrott, M. M. L. R. Carrott, Lignin – from natural adsorbent to activated carbon: A review. Biores. Tech-nol. 98 (2006) 2301–2312.
[2] WHO, Guidelines for Drinking Water Quality, Recom-mendations, vol. I, WHO, Geneva, 1984.
[3] Y.S. Ho, Isotherms for the sorption of lead onto peat: Comparison of linear and non-linear methods, Pol. J. Environ. Stud. 15 (2006) 81–86.
[4] K.V. Kumar, K. Porkodi, Batch adsorber design for diffe-rent solution volume/adsorbent mass ratios using the experimental equilibrium data with fixed solution vo-lume/adsorbent mass ratio of malachite green onto orange peel, Dyes Pigments 74 (2007) 590–594.
[5] K.V. Kumar, S. Sivanesan, Isotherm parameters for basic dyes onto activated carbon: Comparison of linear and non-linear method, J. Hazard. Mater. B129 (2006) 147– –150.
[6] B. Subramanyam, A. Das, Linearized and non-linearized isotherm models comparative study on adsorption of aqueous phenol solution in soil, Int. J. Environ. Sci. Tech. 6 (2009) 633–640.
[7] A. Alihosseini, V. Taghikhani, A.A. Safekordi, D. Bastani, Equilibrium sorption of crude oil by expanded perlite using different adsorption isotherms at 298.15 K, Int. J. Environ. Sci. Tech. 7 (2010) 591–598.
[8] L.R. Chevalier, Use of optimization to develop a corre-lation model for predicting residual NAPL Saturation, Civ. Eng. Environ. Syst. 23 (2006) 65–72.
[9] Y.S. Ho, J.F. Porter, G. McKay, Equilibrium isotherm stu-dies for the sorption of divalent metal ions onto peat: Copper, nickel and lead single component systems, Wa-ter Air Soil Poll. 141 (2002) 1–33.
[10] K.V. Kumar, K. Porkodi, F. Rocha, Isotherms and thermo-dynamics by linear and non-linear regression analysis for the sorption of methylene blue onto activated car-bon: Comparison of various error functions, J. Hazard. Mater. 151 (2008) 794–804.
[11] M. Ajmal, A.H. Khan, S. Ahmad, A. Ahmad, Role of saw-dust in the removal of copper(II) from insaw-dustrial wastes, Water Res. 22 (1998) 3085–3091.
[12] M. Šćiban, M. Klašnja, Study of the adsorption of cop-per(II) ions from water onto wood sawdust, pulp and lignin, Adsorp. Sci. Technol. 22 (2004) 195–206.
[13] H.M.F. Freundlich, Over the adsorption in solution, Z. Phys. Chem. 57A (1906) 385–470.
[14] I. Langmuir, The constitution and fundamental proper-ties of solids and liquids, J. Am. Chem. Soc. 38 (1916) 2221–2295.
[15] O. Redlich, D. L. Peterson, A useful adsorption isotherm, J. Phys. Chem. 63 (1959) 1024.
IZVOD
IZOTERME ZA ADSORPCIJU Cu(II) NA LIGNINU – POREĐENJE LINEARNIH I NELINEARNIH METODA Mirjana M. Brdar, Aleksandar A. Takači, Marina B. Šćiban, Dušan Z. Rakić
Univerzitet u Novom Sadu, Tehnološki fakultet, Novi Sad, Srbija
(Naučni rad)
U ovom radu izvršena su ispitivanja adsorpcije Cu(II) na Kraft ligninu kao ad-sorbentu. Eksperimentalni podaci su fitovani Freundlichovom, Langmuirovom i Redlich–Petersonovom izotermom linearnim i nelinearnim metodama. Dato je po-ređenje linearnog i nelinearnog metoda regresije u određivanju optimalne izo-terme za date eksperimentalne podatke. Koeficijent korelacije r2 i hi-kvadrat test, χ2, korišćeni su za određivanje najbolje linearne, teorijske izoterme. Najbolji li-nearni model je Redlich–Petersonov model, gde je r2 = 0,985 i χ2 = 0,02. U slučaju nelinearnog regresionog metoda korišćeno je pet funkcija greške: ERRSQ, HYBRD, MPSD, ARE i EABS. Rezultati pokazuju da Redlich–Petersonova izoterma najbolje predstavlja sorpciju Cu(II) na Kraft lignin prilikom korišćenja ERRSQ, HYBRD i MPSD funkcija. Koeficijenti determinacije su 0,986, 0,985 i 0,984, redom, a hi-kva-drat je 0,02 u ovim slučajevima. Freundlichova izoterma dobijena minimizacijom ERRSQ, HYBRD, MPSD, ARE i EABS pokazuje veoma dobra slaganja sa eksperi-mentalnim podacima. U svim slučajevima koeficijenti determinacije su veći od 0,91. Osim toga, primećeno je da parametri izotermi dobijeni nelinearnim meto-dama bolje opisuju adsorpciju jona bakra na ligninu od onih koji su dobijeni li-nearnim metodama.