www.atmos-chem-phys.net/12/9187/2012/ doi:10.5194/acp-12-9187-2012
© Author(s) 2012. CC Attribution 3.0 License.
Chemistry
and Physics
Commentary on using equivalent latitude in the upper troposphere
and lower stratosphere
L. L. Pan1, A. Kunz1,*, C. R. Homeyer2, L. A. Munchak1,**, D. E. Kinnison1, and S. Tilmes1
1National Center for Atmospheric Research, Boulder, Colorado, USA 2Texas A&M University, College Station, Texas, USA
*now at: Forschungszentrum J¨ulich, J¨ulich, Germany
**now at: Science System Applications, Greenbelt, Maryland, USA Correspondence to:L. L. Pan ([email protected])
Received: 10 October 2011 – Published in Atmos. Chem. Phys. Discuss.: 15 December 2011 Revised: 26 August 2012 – Accepted: 7 September 2012 – Published: 11 October 2012
Abstract. We discuss the use of potential vorticity (PV) based equivalent latitude (EqLat) and potential temperature (θ) coordinates in the upper troposphere and lower strato-sphere (UTLS) for chemical transport studies. The main ob-jective is to provide a cautionary note on using EqLat-θ co-ordinates for aggregating chemical tracers in the UTLS. Sev-eral examples are used to show 3-D distributions of EqLat to-gether with chemical constituents for a range ofθ. We show that the use of PV-θcoordinates may not be suitable for sev-eral reasons when tropospheric processes are an important part of a study. Due to the different static stability structures between the stratosphere and troposphere, the use ofθ as a vertical coordinate does not provide equal representations of the UT and LS. Since theθsurfaces in the troposphere often intersect the surface of the Earth, theθvariable does not work well distinguishing the UT from the boundary layer when used globally as a vertical coordinate. We further discuss the duality of PV/EqLat as a tracer versus as a coordinate vari-able. Using an example, we show that while PV/EqLat serves well as a transport tracer in the UTLS region, it may con-ceal the chemical structure associated with wave breaking when used as a coordinate to average chemical tracers. Over-all, when choosing these coordinates, considerations need to be made not only based on the time scale of PV being a con-servative tracer, but also the specific research questions to be addressed.
1 Introduction
Similar to the role of the polar vortex edge in the over-world (where theθ surfaces lie entirely in the stratosphere, Hoskins, 1991), the tropopause is a significant dynamical boundary that separates air masses of distinct chemical com-positions in the middleworld (where theθsurfaces intersect the extratropical tropopause, Hoskins, 1991). The tropopause region, however, is significantly different from the polar vor-tex region in the behaviour of both PV andθ. In the polar stratosphere, PV is a quasi-conservative dynamical variable both inside and outside of the polar vortex. This is not the case for the tropopause region when the upper troposphere is of significant interest. From the perspective of time scales involved, the dynamical variability in the polar stratosphere is largely dictated by isentropic processes with a synoptic time scale of a week to 10 days. In the UTLS region, con-vective processes in the time scale of a few hours can play a significant role in redistributing chemical species and di-abatically modifying PV. In addition, the PV based EqLat is derived in an isentropic coordinate system. In the polar stratosphere, isentropes are quasi-lateral (i.e., approximately horizontal in Eulerian altitude sense) and serve well as ver-tical coordinates. In the troposphere, however, isentropes of-ten intersect the Earth surface and at times and may have a significant vertical component in the Eulerian sense (for ex-ample, see Shapiro et al., 1999). These are perhaps the most significant distinctions between the polar vortex edge and the tropopause.
Despite these distinctions, EqLat-θ may still be a pre-ferred coordinate system for many UTLS applications. In this note, we discuss some potential issues of using EqLat in the UTLS for chemical tracer analyses. We examine EqLat as a 3-dimensional (3-D) variable, together with chemical trac-ers, andθ as a vertical coordinate variable in the UTLS re-gion in contrast to latitude and pressure/altitude coordinates to make several points. These discussions may help recognise some unintended consequences of using EqLat-θcoordinates in aggregating chemical measurements.It is not the goal of this discussion to address the general applicability of EqLat in the UTLS, but rather to note that when considering these coordinates it is important to determine whether the use of these coordinates clarifies or obscures the issues of a par-ticular research question. The discussion should also help to consider EqLat-θ coordinates within a suite of comple-mentary methods for aggregating data in the UTLS, includ-ing tropopause relative coordinates (Pan et al., 2004; Tilmes et al., 2010), jet stream based coordinates (Ray et al., 2004; Manney et al., 2011), and tropopause relative latitude coor-dinates (Kunz et al., 2011b).
One specific example is the use of PV/EqLat as a tracer versus a boundary/coordinate for zonal averaging. This is a frequently encountered issue in stratosphere-troposphere ex-change (STE) studies. On the one hand, we identify strato-spheric contribution to the troposphere using high PV as a signature. On the other hand, we use PV-based EqLat to ag-gregate trace gas species, which in effect removes the high
PV air mass from the tropospheric average. Similar situa-tions may occur in the other direction of STE where tropo-spheric intrusions are observed to be associated with low PV, therefore, low EqLat (Pan et al., 2009). We use an example to show that an EqLat based zonal average conceals these events (by mapping these events based on their origin). The example raises a general question on how well EqLat clima-tologically separates reversible (wave) from the presence of irreversible (wave breaking) transport.
This question is particularly relevant to the ongoing stud-ies of double tropopause phenomena. Increasing number of case studies have shown that double tropopause events in mid- to high latitudes are often signatures of poleward Rossby wave breaking and are accompanied by chemical sig-natures of tropospheric air mass intruding into lower strato-sphere above the subtropical jet and mid-latitude tropopause (Randel et al., 2007; Pan et al., 2009; Pan et al., 2010, Home-yer et al., 2011). Statistics based on satellite observations indicate that the maximum occurrence is in late winter and early spring (Randel et al., 2007; Peevey et al., 2011). In con-trast, in a Lagrangian view of the tropopause using trajectory based statistical analyses, a ventilation layer, a layer similar to the secondary tropopause in the Eulerian view, is found to be more prevalent in summer in the EqLat-θspace (Berthet et al., 2007). Many factors may contribute to the apparent con-troversy in this case. We raise the question here whether and how much the use of EqLat versus the geographical latitude may have contributed to the differences.
This commentary is also motivated by the ongoing community activity of process-oriented chemistry climate model (CCM) evaluation with enhanced representation of both stratosphere and troposphere chemistry (http://projects. pmodwrc.ch/ccval/). One of the challenges is to integrate the research aircraft data from a large number of field campaigns over many years for model evaluation. The discussions here are relevant to the consideration of using EqLat-θ coordi-nates to compile aircraft climatology globally.
We begin with a brief summary of the EqLat calculation, followed by a comparison of EqLat-θbetween the overworld polar stratosphere and the UTLS region. Then, the morphol-ogy of EqLat and chemical tracers at the middleworld isen-tropes, and the compactness of tracers in EqLat versus geo-graphical latitude for the UTLS region are shown. Finally, we use an example to contrast the use of EqLat as a tracer ver-sus a coordinate variable. Two trace gas species, ozone (O3)
-150
-120
-90
-60
-30
0
30
60 90 120 150
180
0 30 60 90
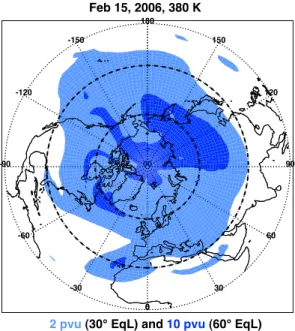
2 pvu (30° EqL) and 10 pvu (60° EqL) Feb 15, 2006, 380 K
Fig. 1.In this example, contours of 30◦and 60◦EqLat are shown
on the 380 K potential temperature surface for the 15 February 2006 00:00 UTC WACCM analysis. These two contours correspond to PV of 2 pvu and 10 pvu, respectively. For contrast, the geographical latitudes of 30◦and 60◦(dashed circles) are also given.
2 Data, model and EqLat calculation
3 WACCM Model and the specified dynamics run
For analysis of EqLat and trace gas distributions, we use global output from version 4 of the NCAR Whole Atmo-sphere Community Climate Model with Specified Dynam-ics (SD-WACCM4). WACCM uses a free-running dynam-ical core that is adopted from the NCAR Community At-mosphere Model (CAM) and a chemistry module that is an extension of version 3 of the Model of OZone and Re-lated Tracers (MOZART3) (e.g., Neale et al. (2012), Kinni-son et al. (2007)). In a recent validation effort, WACCM was shown to perform very well in comparisons with many other chemistry-climate models (SPARC CCMVal, 2010). For the specified dynamics (SD) run, wind and temperature fields are nudged, at each model time step, using the Goddard Earth Observing System 5 (GEOS-5) analysis. The nudging in ef-fect allows SD-WACCM4 to perform as a chemical transport model and facilitates the comparisons with observations. A description of the SD approach is described in Lamarque et al. (2011). In this study, SD-WACCM4 is nudged with 1 % of the GEOS-5 meteorological fields (e.g., temperature, zonal and meridional winds, and surface pressure) every 30 min. Analyses are available daily at a horizontal resolution of 1.9◦×2.5◦(lat×lon), 72 pressure levels in the vertical from
the surface to∼80 km, and a time resolution of 6 h. The verti-cal resolution in the model decreases with height and is∼1–
2 km in the UTLS.
WACCM Feb 15, 2006
−90 −60 −30 0 30 60 90
EqLat −15
−10 −5 0 5 10 15
PV (pvu)
380K 350K
320K
Fig. 2. The relationship of PV and EqLat for three middleworld isentropes on 15 February 2006.
3.1 Calculation of EqLat
Equivalent latitude maps PV to latitude based on the area enclosed by the specific isopleth of PV. For each PV value, Pi, on a given isentrope,θj, there is a corresponding geo-graphical latitude,φ, the area (of the polar cap) enclosed by which equals the areaA(Pi,θj)covered byP >Pi. This cor-responding latitude is defined as the equivalent latitude for Pi on isentropeθj,φe(Pi,θj). The above description can be written as:
φe(Pi, θj)=sin−1
1−A(Pi, θj)
2π R2
(1) whereR is the radius of Earth. In our calculation, the area enclosed by a given PV isopleth is calculated by summing the equivalent areas of each grid cell that hasP≥Pi.
To give an example of EqLat as an alternative representa-tion of PV and how it compares to geographic latitude, we show in Fig. 1 areas enclosed by two selected PV contours on the 380 Kθ surface on 15 February 2006. They are ap-proximately 2 pvu and 10 pvu, and correspond to 30◦and 60◦
EqLat, respectively. In contrast to 30◦ and 60◦ geographic
latitude circles, the EqLat field embodies the instantaneous PV field and provides a snapshot of the underlying conserva-tive dynamics.
EqL
0 180
30 60 90
Feb 15, 2006 WACCM 600K
-150
-120
-90
-60
-30
0
30 60
90 120 150 180
0 30 60 90
0 30 60 90
Eqlat -150
-120
-90
-60
-30 30
60 90 120 150
0
CO (ppbv)
CO
15 30 45 60
Fig. 3.Distribution of EqLat (left) and CO (right) on the 600 K isentropic surface. The white contours represent 30 and 40 m s−1wind
speeds.
Feb 15, 2006 WACCM 600K
0 15 30 45 60 75 90
Latitude 0
20 40 60 80
CO (ppbv)
0 15 30 45 60 75 90
EqLat 0
20 40 60 80
CO (ppbv)
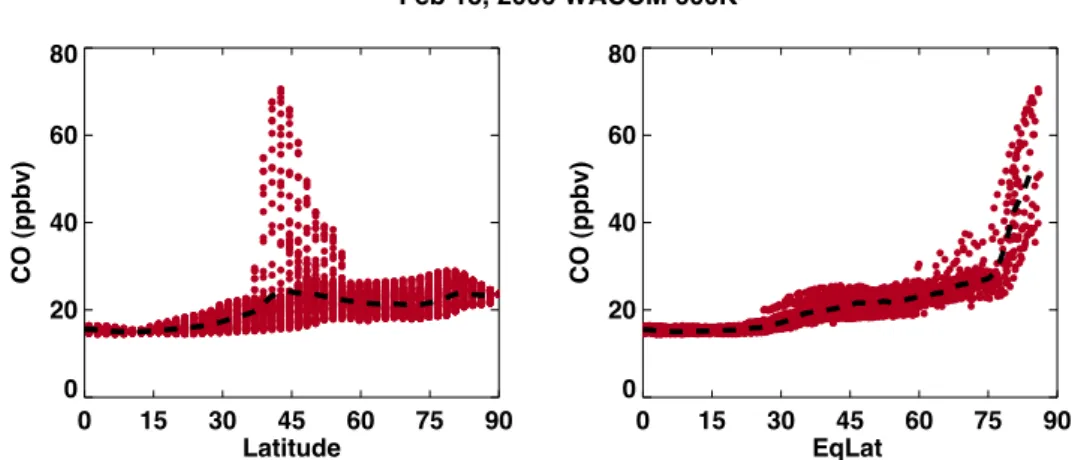
Fig. 4. Scatterplots of WACCM CO at 600 K as functions of latitude (left) and equivalent latitude (right). The black dashed lines represent the zonal means (calculated in 1.9◦intervals) in latitude or EqLat coordinates, respectively.
4 EqLat in the polar stratosphere
Trace gas distributions in the winter stratosphere are strongly influenced by vortex dynamics, and consideration of the vor-tex is essential when aggregating trace gas data. Figures 3 and 4 demonstrate how EqLat can be used to produce dynam-ically consistent averages of trace gas distributions. Figure 3 shows EqLat and CO mixing ratio from the WACCM model in the Northern Hemisphere (NH) on the 600 K θ surface on 15 February 2006. In this case, following a major strato-sphere sudden warming (Coy et al., 2009) the air mass asso-ciated with the polar vortex is fragmented into three pieces (green shading). The piece containing highest EqLat is
lo-cated near 45◦
N and 90◦
–120◦
E. There are corresponding signatures in the CO field. This well-known correlation is produced by the descent of polar vortex air that brings higher CO produced by CO2photolysis in the mesosphere and lower
thermosphere into the stratosphere (Allen et al., 1999). Figure 4 compares scatterplots and averages of CO mixing ratio using the geographical latitude with that using EqLat. In geographical latitude coordinates, the vortex fragment with high CO near 45◦N is averaged with low-CO air from
out-side the vortex to produce a small peak in zonal-mean CO near 45◦N. The zonal-mean CO across all latitudes is nearly
0 15 30 45 60 75 90 Latitude
0 5 10 15 20
Log Pressure Altitude (km)
20
30
40
WACCM Feb 15, 2006 120° W
2
2
2 4 8
8
280
300 330
380 450
0 15 30 45 60 75 90
Latitude 250
300 350 400 450
Potential Temperature (K)
20 30
40
2 2
2
4
4
8 8
0 5 10 15 20 25
dθ/dz (K/km)
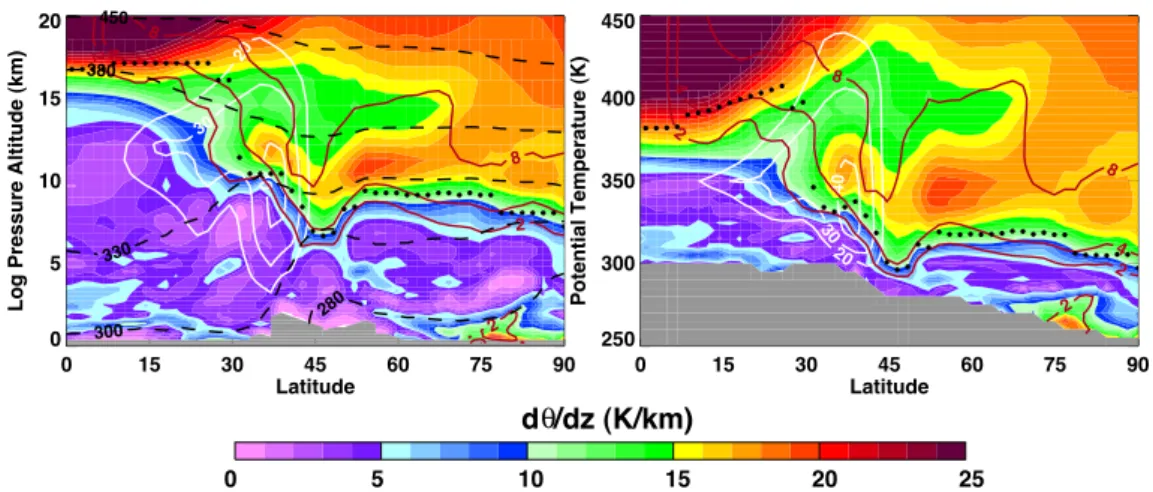
Fig. 5.An example of a latitude-height cross-section in Log-pressure altitude (left) versus potential temperature (right) coordinates. Colour images represent static stability (potential temperature lapse rate). Also shown are zonal wind speed (m s−1, white lines), PV (red lines) and the thermal tropopause (black dots). The cross-sections are along 120◦W longitude. In theθ-coordinate the troposphere is a narrow layer,
especially around the subtropical jet.
WACCM Feb 15, 2006 120° W
0 15 30 45 60 75 90
Latitude 0
5 10 15 20
Log Pressure Altitude (km)
20
20
30
40 2
2
2
4
8
8
280
300
330 380
450
0 15 30 45 60 75 90
Latitude 250
300 350 400 450
Potential Temperature (K)
20 20
30
40
2 2
2
4 4
8 8
0
Eqlat
90 60
30
Fig. 6. As in Fig. 5 but for EqLat.
50 ppbv in the vortex (poleward of 75◦N in EqLat). This
ex-ample demonstrates the utility of EqLat-coordinates in the polar stratosphere: these coordinates highlight the associa-tion of large CO abundance with polar vortex air, which is lost when viewed as function of geographical latitude.
5 EqLat andθin the UTLS
In contrast to the overworld, the representation of UTLS in the EqLat-θ coordinates requires some additional consider-ations. While isentropes are quasi-horizontal in the strato-sphere, they often have a significant vertical component in the troposphere, i.e.,θ surfaces may span the upper tropo-sphere and the boundary layer or intersect the Earth surface. An example can be seen in Fig. 5, where the 300 K
poten-tial temperature contour represents the upper troposphere in mid to high latitudes, but boundary layer in the low latitudes. From a slightly different perspective, the stratosphere is sta-ble and stratified because of the large vertical gradient inθ, i.e., high static stability. The troposphere is relatively unsta-ble and has a weakθgradient. These simple facts reflect the nature of these two atmospheric layers so named. As a conse-quence, in comparison to geometric or pressure coordinates, θ-coordinates expand the LS and compress the UT. This fea-ture is illustrated in Figs. 5 and 6.
Figure 5 shows a vertical cross-section of static stability for 15 February 2006 along 120◦W longitude. Also shown
380K
0 180
0 30 60 90 -150
-120
-90
-60
-30
60 90 120 150
30
330K
180
30 60 90 -150
-120
-90
-60
-30 30
60 90 120 150
0 0 0
EqL
O3 -150
-120
-90
-60
-30 0
30 60
90 120 150 180
0 30 60 90
-150
-120
-90
-60
-30 0
30 60
90 120 150 180
0 30 60 90
50
200
350
500+
O3 (ppbv)
330K 380K
200
800
1400
2000+
330K 380K EqL
O3
EqL
30
90
60
0
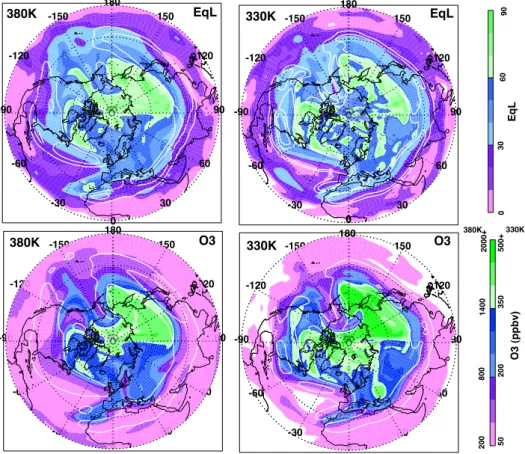
Fig. 7. WACCM EqLat and O3on the 380 K (left column) and 330 K (right column)θ-surfaces for 15 February 2006. The position of the jet is represented by white contours (wind speeds of 30 and 40 m s−1).
vertical coordinates. The two scales represent a similar ver-tical range. The main message of the figure is that in al-titude space, the tropopause divides the lower stratosphere and troposphere roughly equally in terms of the area in the cross-section. In θ space, on the other hand, the asymme-try is quite obvious with the entire troposphere reduced to a narrow layer. The relevance of this information is that of-ten times when poof-tential temperature is used as the vertical coordinate, a layer of 20–30 K above the tropopause is con-trasted to a layer of 20–30 K below the tropopause. We want to point out here that, the former is a narrow layer of 1–2 km in the geophysical space and only represents the bottom of the stratosphere, while the latter is often the entire tropo-sphere. One needs to be aware of this asymmetry when using isentropic coordinates in the UTLS.
Figure 6 shows a cross-section of EqLat as a 3-D vari-able, together with the tropopause and the jet locations, in both Log-pressure altitude and potential temperature vertical coordinates. In addition to showing the asymmetry of rep-resenting UT versus LS, the comparison of the wind and EqLat distribution highlights the role of the jet streams in the UTLS EqLat distribution. In the subtropics, the quasi-vertical isolines of EqLat are approximately perpendicular to and increase with latitudes across the strong subtropical jet,
an indication that EqLat here serves well as a latitudinal co-ordinate variable. It is evident, in this example, how the jet structure is dominating the latitudinal PV variation. The high PV and associated high EqLat around the jets is accompa-nied by lower EqLat away from the jets, where the PV iso-lines are quasi-lateral and largely parallel to the isentropes. The weak gradient in PV-EqLat relationship away from the strong jet, as shown in Fig. 2, is responsible for this struc-ture. This structure raises the question whether the behaviour is consistent with the UTLS chemical distribution and what implications are when using the coordinates for averaging chemical tracers. This is the focus of the next section.
6 EqLat and chemical tracers in the UTLS
stratosphere and troposphere chemistry in the new generation of CCMs, there is a need to identify an optimal method of ag-gregating research aircraft data, which often include both the troposphere and the lower stratosphere, for process oriented model evaluations. One question we consider here is to what extent EqLat-θ coordinates could serve the need and what would be unintended effects when both the stratosphere and the troposphere are included.
To provide a perspective, we show O3 and CO from the
WACCM model for selected isentropes and in vertical cross-sections. Note that these two species are the most commonly used stratospheric and tropospheric tracers, respectively, for transport studies in the UTLS region. They have very differ-ent relationships with EqLat. O3, similar to PV, has strong
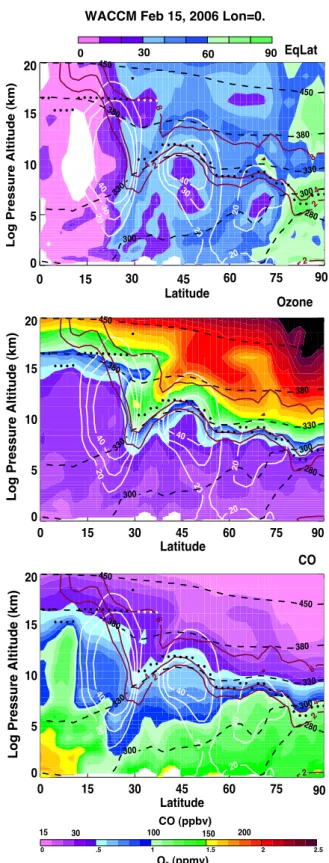
stratospheric sources and is known to correlate with PV in the tropopause region (e.g., Danielsen, 1968; Browell et al., 1987; Pittman et al., 2009). CO on the other hand, has large anthropogenic origin and the surface value of CO has a strong relationship with geographical latitude (e.g., Novelli et al., 2003). Low CO air mass near the tropopause is often correlated with stratospheric influence. High CO air mass in the UT, on the other hand, may be an indication of convec-tive transport or biomass burning, processes that are PV non-conservative. Figures 7–9 in this section aim to illustrate the behaviours of EqLat and tracers on several UTLS isentropes to shed light on the use of EqLat for aggregating chemical tracer data in this region.
Figure 7 shows a NH view of EqLat and O3distributions
on two selected isentropes (380 K and 330 K). On the 380 K surface, the spatial patterns of EqLat and O3are largely
con-sistent. This is especially true for high EqLat and high O3and
the gradient change in the region of the jet stream. The 380 K level is largely stratospheric, as indicated by Figures 5–6. This is no longer the case at 330 K, a level that spans the middle troposphere in the tropics, the tropopause region in the mid-latitudes and the lower stratosphere in the high lat-itudes. At this level, the high (polar) EqLats are shown to be strongly associated with the jet streams. The gradients of tracer distribution in the subtropics show a good consis-tency with the gradient of EqLat but lose correlation at high latitudes. If the O3 field is re-sampled using EqLat, the
dy-namical variability in the subtropics and mid-latitudes will be mapped consistently with the dynamical field. However, O3in the polar region will be mapped into mid-equivalent
latitudes. What produced this large difference between the EqLat and O3 in the polar latitudes is not entirely
under-stood. In addition to the known weak gradient (Fig. 2), we speculate that this relationship may be dependent on the sea-sonality of static stability in the polar UTLS, which reaches a minimum that is less than that in mid-latitudes during win-ter in each hemisphere (e.g., Tomikawa et al., 2009; Grise et al., 2010). This lack of compact tracer-EqLat correlation away from the tropopause (or jet) region is also seen in the scatterplot (Fig. 9).
Latitude
WACCM Feb 15, 2006 Lon=0.
0 15 30 45 60 75 90
Latitude
0 5 10 15 20
Log Pressure Altitude (km)
20
20
20 20
40 40
280 300
300
330
330
380 380
450 450
CO
0 15 30 45 60 75 90
Latitude 0
5 10 15 20
Log Pressure Altitude (km)
20
20
20 20
40 40
2 2 2
4
4 8
8
280 300
300
330
330
380 380
450 450
Ozone
0 .5 1 1.5 2 2.5
O3 (ppmv)
15 30 100 150 200
CO (ppbv)
EqLat
0 15 30 45 60 75 90
0 5 10 15 20
Log Pressure Altitude (km)
20
20
20 20
30
30
40 40
2 2 2
4
4 8
8
280 300
300
330
330
380 380
450 450
0 30 60 90
Fig. 8. WACCM NH meridional cross-sections of EqLat (top), Ozone (middle) and CO (bottom) for 15 February 2006 along 0◦
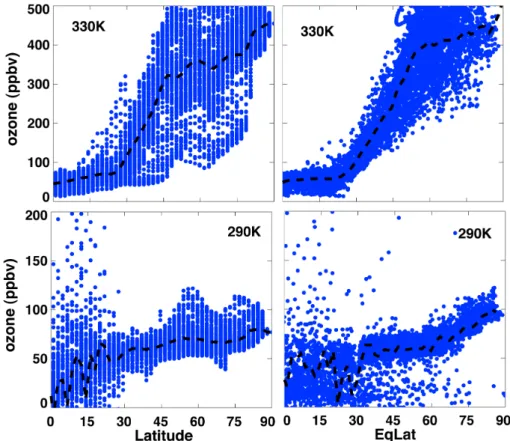
Fig. 9.WACCM NH ozone as a function of latitude (left) and EqLat (right) for the 330 K and 290 K potential temperature surfaces on 15 February 2006. The dashed line in each plot represents the zonal average in their respective coordinates.
Figure 8 provides a cross-section view of EqLat and chem-ical tracers in the UTLS region to complement the view on θ-surfaces in the previous figure. Overall, the figure high-lights the strong vertical gradients in the tracer cross-section, and the role of the tropopause in dictating the change in the tracer fields. In this particular cross-section, three upper tro-pospheric jet streams, the subtropical, the polar and the Arc-tic jets, are clearly identifiable in the wind fields. In the region of the subtropical jet between 5–15 km, the horizontal gradi-ents of the tracers are consistent with the gradigradi-ents of EqLat. Away from the subtropical jet, and the variable EqLat shows weakened latitudinal gradient which is consistent with the PV-EqLat relationship shown in Fig. 2. This figure suggests that while EqLat maybe effective in the subtropics, away from the subtropical jet tropopause relative coordinates are more effective in representing the variability of the tracers.
Note that in the tropics (equatorward of the subtropical jet), there is a region of strong enhancement of CO, likely representing the influence of convective transport coupled with local emission sources. This region is associated with negative EqLat, consistent with the likely convective modifi-cation of PV. Although this behaviour is well known, this ex-ample illustrates how the use of EqLat as a global coordinate may result in undesired tracer redistributions. In this case the
CO plum will be mapped to the Southern Hemisphere in an EqLat based zonal average.
Figure 9 shows scatterplots of O3as a function of latitude
and EqLat and their respective zonal averages for the 330 K and 290 K levels. The two levels are chosen to contrast LS and UT for mid- to high latitudes, and also to contrast the use of EqLat in the tropopause region with that in the po-lar stratosphere as shown in Fig. 4. At the 330 K level, the compactness and zonal averages using the two latitude co-ordinates are significantly different. The large scatter of O3
in latitude reflects the latitudinal variation of the tropopause. The distribution in the EqLat coordinate is much more com-pact especially in the tropopause region (∼30◦N EqLat and
100–200 ppbv of ozone). In the polar latitudes, the correla-tion is no longer as compact, which is consistent with the discussion of the plane view shown in Fig. 7. Nevertheless, the figure indicates that the EqLat based average provides a better consistency with the dynamical background. In con-trast, at the 290 K level (nearly entirely in the troposphere) both tropospheric chemistry and STE influence the O3
distri-bution. The low O3scatters in the tropics (the points below
Apr 16, 2008, 380 K
0 10 20 30 40 50 60 70 80 90
EqLat 0
30 60
90
6 6
6
6
6
6 6
6
6
6
0° 180°
60°W 60°E
120°W 120°E
(a)
100 200 300 400 500 600 700 800 900 1000
O3 in ppbv
0 30
60 90
6 6
6
6
6
6 6
6
6
6
0° 180°
60°W 60°E
120°W 120°E
(b)
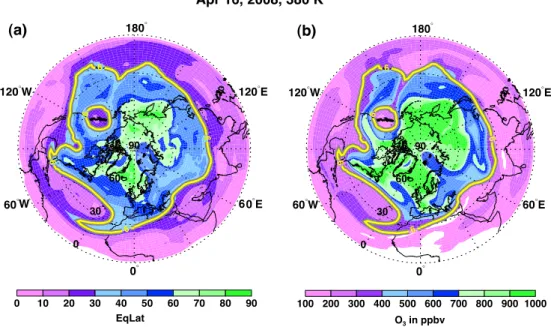
Fig. 10.Maps of(a)EqLat and(b)ozone from the SD-WACCM run for 16 April 2008 at the 380 K potential temperature surface. The 6 pvu PV contours are shown by the yellow lines. The dynamical tropopause is defined as the pole-enclosing 6 pvu contour.
figure illustrates that the steep slopes of the isentropes in the troposphere makes it difficult to separate UT from the bound-ary layer inθ coordinates. In addition, it is more important to have the geographical latitude information when it comes to identifying the source and sink origin in the lower tropo-sphere.
7 EqLat as a tracer versus as a coordinate variable
An important issue to consider when using EqLat is what scientific question we intend to address. Two scenarios we contrast in this section are using EqLat as a tracer to identify the transport origins versus as a coordinate for achieving a zonal average.
Similar to the polar stratospheric studies, EqLat has been shown as an effective transport tracer in the UTLS. For exam-ple, several recent studies have shown that PV based EqLat is effective at identifying poleward intrusions of tropospheric air mass into lower stratosphere above the subtropical jet core (Pan et al., 2009; Homeyer et al., 2011). We use an example here to illustrate what happens in a tropospheric intrusion case if EqLat is used as a coordinate variable. This example is an event involving transport of tropospheric air into the lower stratosphere due to Rossby wave breaking, on April 16, 2008. A later stage of the event was sampled in situ by research aircraft during the START08 experiment (Pan et al., 2010). This wave breaking event and associated irreversible transport has been analysed in detail (Homeyer et al., 2011). We illustrate the issues here using the SD-WACCM simula-tion of this time period.
Figure 10 shows 380 K NH EqLat and O3 fields on 16
April 2008 from the SD-WACCM run. The 6 pvu PV con-tours are superimposed on each map. There are multiple contours, but only the one that encloses the pole represents the dynamic tropopause for this isentrope, determined us-ing the PV gradient-based definition described in Kunz et al. (2011a). The tropospheric intrusion air mass is seen as a “blob” of low EqLat (∼20◦–30◦) and low O3 (∼100–
200 ppbv) air, near 60◦N and 140◦W, separated from the
tropical reservoir. This air mass, enclosed by the shorter one of the 6 pvu contours, highlights the fact that this is, both dynamically and chemically, a bulk of tropospheric air that has been cut-off from the troposphere and is embedded in the stratospheric background. The high consistency of EqLat and O3indicates that the low O3is not produced chemically,
but a result of transport. The figure, therefore, speaks for the effective role of EqLat as a transport tracer. In this case, the occurrence of wave breaking is signified by the PV/EqLat structure, and the process as a whole is irreversible in gen-eral (McIntyre and Palmer, 1983). Although in this case, mixing and irreversible transport associated with this event is confirmed by the in situ tracer measurement (Homeyer et al., 2011), the general quantification of air mass irreversible transport involved in this type of events is a subject of future studies (e.g., Homeyer and Bowman, 2012).
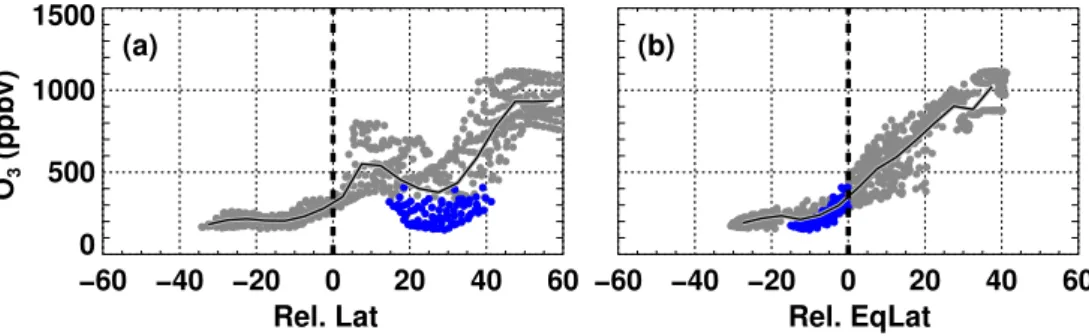
Figures 11–12 contrast the use of latitude and EqLat as the coordinate variable to compute a zonal average in this case, using data from the meridional section over the longi-tude range 110◦–150◦W. Figure 11 shows the O
3
−60 −40 −20 0 20 40 60 0
500 1000 1500
Rel. Lat O3
(ppbv)
(a)
−60 −40 −20 0 20 40 60
Rel. EqLat (b)
Fig. 11. Ozone at 380 K and from 110◦–150◦W in longitude on 16 April 2008,(a)as a function of relative latitude to the 380 K dynamical
tropopause (6 pvu in Fig. 10), and(b)as a function of relative EqLat to the dynamical tropopause. The blue points highlight the parcels that are on different sides of the tropopause when using relative latitude versus relative EqLat.
15 30 45 60 75
300 320 340 360 380 400
15 30 45 60 75
Latitude 300
320 340 360 380 400
Potential Temperature (K) 20
20
30
20
20
30
2 2
4 4
6
6
6
15 30 45 60 75
300 320 340 360 380 400
15 30 45 60 75
EqLat 300
320 340 360 380 400
0 100 200 300 400 500
20 20
20 20
2 2
4 4
6 6
O3 (ppbv)
Apr 16, 2008, 110-150° W Sectional Zonal Mean
Fig. 12. Sectional zonal means of ozone for 110◦–150◦W in(a)latitude and(b)EqLat. Yellow squares represent the dynamical tropopause
at each isentrope. Black dots represent the thermal tropopause. Also shown are PV in pvu (red contours) and zonal wind in m s−1(white contours).
cases, the zero represents the latitude or EqLat location of the isentropic tropopause (the pole-enclosing 6 pvu contour in this case). In each case, the blue points are those to be mapped to the opposite side of the tropopause depending on the coordinate variable used (relative latitude or EqLat).
As shown in Fig. 11a and b, the O3-EqLat relationship
is much more compact than O3-latitude, which reflects the
strong correlation of O3and PV in this region and speaks to
the role of transport in the ozone distribution at thisθlevel. The low ozone points (blue) on the positive side of the O3
-relative latitude relationship, however, highlights the fact that significant transport of low ozone air mass from troposphere to stratosphere would be classified back to their transport ori-gin if EqLat is used for zonal averaori-ging. This issue is further highlighted in Fig. 12, where the sectional zonal mean for the region shows the low ozone air mass due to the transport lat-itude based zonal average. On the other hand, this low ozone air mass is mapped back to the troposphere in EqLat based zonal mean.
To further clarify the issues of how we consistently char-acterise the dynamical variability of the chemical field in the UTLS, we connect our discussion here to a body of re-search that uses the PV field to characterise Rossby wave breaking in the context of STE. A few good representatives of the research are Postel and Hitchman (1999), Wernli and Sprenger (2007) and Sprenger et al. (2007). These works are based on the concept that wave breaking events are fun-damentally an irreversible process and highly relevant to STE (McIntyer and Palmer, 1983). The result of these works largely represents our knowledge of preferred locations of STE. Sprenger et al. (2007), in particular, did a detailed anal-ysis to compare PV structures (streamers, cutoffs) and STE studies from an earlier work (Sprenger and Wernli, 2003). The result shows that the PV structures do have a significant connection with the trajectory analyses based STE events, i.e., these PV structures represent STE activities. If we av-erage the chemical tracers based on their PV or EqLat, the STE events related to these PV structures will be largely con-cealed. What coordinates we use to perform averaging will potentially alter the picture of spatial and seasonal variability of these STE relevant activities. The choice of coordinates, therefore, should be carefully made based on the purpose of averaging.
This example also has a specific implication in regard to the double tropopause statistics. As shown in the example, the wave breaking and associated double tropopause occur-rence in this case will be concealed in the EqLat coordinate.
8 Summary
We have discussed three areas of concerns for using EqLat-θ coordinates in the UTLS region. The first one concerns the representation of troposphere in the EqLat-θspace. The EqLat-θcoordinates are fundamentally stratosphere focused (Fig. 5) and do not represent UT and LS equally. This point is relevant when tropospheric sources, sinks and processes are important to a particular study. In the subtropics, the steep slopes of the isentropes makes it difficult to useθ as a ver-tical coordinate globally with a clear distinction between the upper troposphere and the boundary layer. While the chem-ical composition in the UT is strongly coupled dynamchem-ically to the LS, the vertical transport of tracers from the boundary layer is also important. The tropospheric tracer distribution is, therefore, often strongly coupled to the surface source, which makes geographical latitude a more relevant coordi-nate variable.
The second area concerns the use of EqLat to aggregate chemical tracers in the region away from the jet stream. Us-ing modelled tracers of O3 and CO, we show examples of
the polar region being mapped to middle EqLats (Fig. 6) and the possibility of convectively influenced tropical upper tro-posphere being mapped to the south of the Equator (Fig. 8).
Most importantly, in the third area, EqLat based zonal av-erages may conceal the chemical structure associated with wave breaking as shown in the last example (Figs. 10–12). Since the PV structure based Rossby wave breaking analy-sis is a significant part of the STE studies (e.g., Postel and Hitchman, 1999; Wernli and Spenger, 2007; and Sprenger et al., 2007), it is important to be aware that using PV as a co-ordinate will in effect obscure the dynamical variability of the trace gas associated with wave breaking. Whether the lat-itude or EqLat representation of wave breaking events has contributed to the differences in double tropopause studies should be examined in future work.
An important message that comes out of these examples is that the choice of coordinate for averaging data in this region depends on the specific scientific question. Different from the stratospheric polar vortex studies, where quantifying chemi-cal processing in the polar vortex air is usually the goal, the focus of the UTLS region is most often to quantify trans-port and exchange. Intrusions from stratosphere into tropo-sphere, and vice versa, are processes that often involve both reversible and irreversible transport and are, therefore, im-portant STE activities to characterise in this region. Using a tracer that itself is influenced by the transport as a coor-dinate often convolutes the problem. A general interest of aggregating UTLS observations is also to identify transport boundaries and pathways associated with the meteorological patterns. It is often more effective to examine the chemical and dynamical tracers in parallel (Kunz et al., 2011b).
Acknowledgements. The National Center for Atmospheric Re-search is sponsored by the National Science Foundation. The authors thank Kenneth Bowman, Eric Jensen and John Bergman for helpful suggestions.
Edited by: A. Engel
References
Allen, D. R., Stanford, J. L., L´opez-Valverde, M. A., Nakamura, N., Lary, D. J., Douglass, A. R., Cerniglia, M. C., Remedios, J. J., and Taylor, F. W.: Observations of middle atmosphere CO from the UARS ISMAS during the early northern winter 1991/92, J. Atmos. Sci., 56, 563–583, 1999.
Berthet, G., Esler, J. G., and Haynes, P. H.: A Lagrangian perspective of the tropopause and the ventilation of the lowermost stratosphere, J. Geophys. Res., 112, D18102, doi:10.1029/2006JD008295, 2007.
Browell, E. V., Danielsen, E. F., Ismail, S., Gregory, G.L., and Beck, S. M.: Tropopause fold structure determined from airborne li-dar and in situ measurements, J. Geophys. Res., 92, 2112– 2120, 1987.
Butchart, N. and Remsberg, E. E.: The area of the stratospheric po-lar vortex as a diagnostic for tracer transport on an isentropic surface, J. Atmos. Sci., 43, 1319–1339, 1986.
Coy, L., Eckermann, S., and Hoppel, K.: Planetary wave break-ing and tropospheric forcbreak-ing as seen in the stratospheric sudden warming of 2006, J. Atmos. Sci., 66, 495–507, 2009.
Danielsen, E. F.: Stratospheric-tropospheric exchange based on ra-dioactivity, ozone and potential vorticity, J. Atmos. Sci., 25, 502– 518, 1968.
Engel, A., B¨onisch, H., Brunner, D., Fischer, H., Franke, H., G¨unther, G., Gurk, C., Hegglin, M., Hoor, P., K¨onigstedt, R., Krebsbach, M., Maser, R., Parchatka, U., Peter, T., Schell, D., Schiller, C., Schmidt, U., Spelten, N., Szabo, T., Weers, U., Wernli, H., Wetter, T., and Wirth, V.: Highly resolved obser-vations of trace gases in the lowermost stratosphere and upper troposphere from the Spurt project: an overview, Atmos. Chem. Phys., 6, 283–301, doi:10.5194/acp-6-283-2006, 2006.
Grise, K. M., Thompson, D. W. J., and Birner, T.: A global survey of static stability in the stratosphere and upper troposphere, J. Clim., 23, 2275–2292, doi:10.1175/2009JCLI3369.1, 2010 Haynes, P. and Shuckburgh, E.: Effective diffusivity as a diagnostic
of atmospheric transport 2. troposphere and lower stratosphere, J. Geophys. Res., 105, 22795–22810, 2000.
Hegglin, M. I., Brunner, D., Peter, T., Hoor, P., Fischer, H., Stae-helin, J., Krebsbach, M., Schiller, C., Parchatka, U., and Weers, U.: Measurements of NO, NOy, N2O, and O3during SPURT:
implications for transport and chemistry in the lowermost strato-sphere, Atmos. Chem. Phys., 6, 1331–1350, doi:10.5194/acp-6-1331-2006, 2006.
Homeyer, C. R., Bowman, K. P., Pan, L. L., Atlas, E. L., Gao, R.-S., and Campos, T. L.: Dynamical and chemical characteristics of tropospheric intrusions observed during START08, J. Geophys. Res., 116, D06111, doi:10.1029/2010JD015098, 2011.
Homeyer, C. R. and Bowman, K. P.: Rossby wavebreaking and transport between the tropics and extratropics above the
subtrop-ical jet, J. Altmos. Sci., doi:10.1175/JAS-D-12-0198.1, in press, 2012.
Hoor, P., Gurk, C., Brunner, D., Hegglin, M. I., Wernli, H., and Fischer, H.: Seasonality and extent of extratropical TST derived from in-situ CO measurements during SPURT, Atmos. Chem. Phys., 4, 1427–1442, doi:10.5194/acp-4-1427-2004, 2004. Hoskins, B. J.: Towards a PV-θview of the general circulation,
Tel-lus, Ser. B, 43, 27–35, 1991.
Juckes, M. N.: An annual cycle of long lived stratospheric gases from MIPAS, Atmos. Chem. Phys., 7, 1879–1897, doi:10.5194/acp-7-1879-2007, 2007.
Kanzawa, H., Sugita, T., Nakajima, H., Bodeker, G. E., Oelhaf, H., Stowasser, M., Wetzel, G., Engel, A., Schmidt, U., Levin, I., Toon, G. C., Sen, B., Blavier, J.-F., Aoki, S., Nakazawa, T., Jucks, K. W., Johnson, D. G., Traub, W. A., Camy-Peyret, C., Payan, S., Jeseck, P., Murata, I., Fukunishi, H., von K¨onig, M., Bremer, H., K¨ullmann, H., Park, J. H., Pan, L. L., Yokota, T., Suzuki, M., Shiotani, M., and Sasano, Y.: Validation and data characteristics of nitrous oxide and methane profiles observed by the Improved Limb Atmospheric Spectrometer (ILAS) and pro-cessed with the Version 5.20 algorithm, J. Geophys. Res., 108, 8003, doi:10.1029/2002JD002458, 2003.
Kinnison, D. E., Brasseur, G. P., Walters, S., Garcia, R. R., Marsh, D. R., Sassi, F., Harvey, V. L., Randall, C. E., Emmons, L., Lamarque, J. F., Hess, P., Orlando, J. J., Tie, X. X., Randel, W., Pan, L. L., Gettelman, A., Granier, C., Diehl, T., Niemeier, U., and Simmons, A. J.: Sensitivity of chemical tracers to meteoro-logical parameters in the MOZART-3 chemical transport model, J. Geophys. Res., 112, D20302, doi:10.1029/2006JD007879, 2007.
Kunz, A., Konopka, P., M¨uller, R., and Pan, L. L.: Dynami-cal tropopause based on isentropic potential vorticity gradients, J. Geophys. Res., 116, D01110, doi:10.1029/2010JD014343, 2011a.
Kunz, A., Pan, L. L., Konopka, P., Kinnison, D. E., and Tilmes, S.: Chemical and dynamical discontinuity at the extratropical tropopause based on START08 and WACCM analyses, J. Geo-phys. Res., 116, D24302, doi:10.1029/2011JD016686, 2011b. Lait, L. R., Schoeberl, M. R., Newman, P. A., Proffitt, M. H.,
Loewenstein, M., Podolske, J. R., Strahan, S. E., Chan, K. R., Gary, B., Margitan, J. J., Browell, E., McCormick, M. P., and Tor-res, A.: Reconstruction of O3and N2O fields from ER-2, DC-8, and balloon observations, Geophys. Res. Lett., 17(4), 521–524, 1990.
Lamarque, J.-F., Emmons, L. K., Hess, P. G., Kinnison, D. E., Tilmes, S., Vitt, F., Heald, C. L., Holland, E. A., Lauritzen, P. H., Neu, J., Orlando, J. J., Rasch, P. J., and Tyndall, G. K.: CAM-chem: description and evaluation of interactive at-mospheric chemistry in the Community Earth System Model, Geosci. Model Dev., 5, 369–411, doi:10.5194/gmd-5-369-2012, 2012.
Manney, G. L., Hegglin, M. I., Daffer, W. H., Santee, M. L., Ray, E. A., Pawson, S., Schwartz, M. J., Boone, C. D., Froide-vaux, L., Livesey, N. J., Read, W. G., and Walker, K. A.: Jet char-acterization in the upper troposphere/lower stratosphere (UTLS): applications to climatology and transport studies, Atmos. Chem. Phys., 11, 6115–6137, doi:10.5194/acp-11-6115-2011, 2011 Manney, G. L., Michelsen, H. A., Santee, M. L., Gunson, M. R.,
dynam-ics during spring and fall diagnosed using trace gas observations from the Atmospheric Trace Molecule Spectroscopy instrument, J. Geophys. Res., 104, 18841–18866, 1999.
Manney, G. L., Zurek, R. W., Gelman, M. E., Miller, A. J., and Na-gatani, R.: The anomalous arctic lower stratospheric polar vortex of 1992–1993, Geophys. Res. Lett., 21, 2405–2408, 1994. McIntyre, M. E. and Palmer, T. N. : Breaking planetary waves in the
stratosphere, Nature, 305, 593–600, 1983.
Neale, R. B., Richter, J., Park, S., Lauritzen, P. H. , Vavrus, S. J., Rasch, P. J., and Zhang, M.: The Mean Climate of the Commu-nity Atmosphere Model (CAM4) in Forced SST and Fully Cou-pled Experiments, J. Clim., in review, 2012.
Novelli, P. C., Masarie, K. A., Lang, P. M., Hall, B. D., Myers, R. C., and Elkins, J. W.: Reanalysis of tropospheric CO trends: Ef-fects of the 1997–1998 wildfires, J. Geophys. Res., 108, 4464, doi:10.1029/2002JD003031, 2003.
Pan, L. L., Bowman, K. P., Atlas, E. L., Wofsy, S. C., Zhang, F., Bresch, J. F., Ridley, B. A., Pittman, J. V., Homeyer, C. R., Ro-mashkin, P., and Cooper, W. A.: The Stratosphere-Troposphere Analyses of Regional Transport 2008 experiment, Bull. Am. Me-teorol. Soc., 91, 327–342, 2010.
Pan, L. L., Randel, W. J., Massie, S. T., Kanzawa, H., Sasano, Y., Nakajima, H., Yokota, T., and Sugita, T.: Variability of polar stratospheric water vapor observed by ILAS, J. Geophys. Res., 107, 8214, doi:10.1029/2001JD001164, 2002.
Pan, L. L., Randel, W. J., Gary, B. L., Mahoney, M. J., and Hintsa, E. J.: Definitions and sharpness of the extratropical tropopause: A trace gas perspective, J. Geophys. Res., 109, D23103, doi:10.1029/2004JD004982, 2004.
Pan, L. L., Randel, W. J., Gille, J. C., Hall, W. D., Nardi, B., Massie, S., Yudin, V., Khosravi, R., Konopka, P., and Tarasick, D.: Tro-pospheric intrusions associated with the secondary tropopause, J. Geophys. Res., 114, D10302, doi:10.1029/2008JD011374, 2009. Peevey, T. R., Gille, J. C., Randall, C. E., and Kunz, A.: In-vestigation of double tropopause spatial and temporal global variability utilizing High Resolution Dynamics Limb Sounder temperature observations, J. Geophys. Res., 117, D01105, doi:10.1029/2011JD016443, 2012.
Pittman, J. V., Pan, L. L., Wei, J. C., Irion, F. W., Liu, X., Maddy, E. S., Barnet, C. D., Chance, K., and Gao, R.: Evaluation of AIRS, IASI, and OMI ozone profile retrievals in the extratropical tropopause region using in situ aircraft measurements, J. Geo-phys. Res., 114, D24109, doi:10.1029/2009JD012493, 2009. Postel, G. A. and Hitchman, M. H.: A climatology of Rossby wave
breaking along the subtropical tropopause, J. Atmos. Sci., 56, 359–373, 1999.
Randel, W. J., Seidel, D. J., and Pan, L. L.: Observational charac-teristics of double tropopauses, J. Geophys. Res., 112, D07309, doi:10.1029/2006JD007904, 2007.
Randel, W. J., Wu, F., Russell, J. M., Roche, A., and Waters, J. W.: Seasonal cycles and QBO variations in stratospheric CH4 and H2O observed in UARS HALOE data, J. Atmos. Sci., 55, 163– 185, 1998.
Ray, E. A., Rosenlof, K. H., Richard, E., Parrish, D., and Jakoubek, R.: Distributions of ozone in the region of the subtropical jet: An analysis of in situ aircraft measurements, J. Geophys. Res., 109, D08106, doi:10.1029/2003JD004143, 2004.
Schoeberl, M. R., Lait, L. R., Newman, P. A., Martin, R. L., Proffitt, M. H., Hartmann, D. L., Loewenstein, M., Podolske, J., Strahan, S. E., Anderson, J., Chan, K. R., and Gary, B.: Reconstruction of the constituent distribution and trends in the Antarctic polar vortex from ER-2 flight observations. J. Geophys. Res., 94, 16 815–16 846, 1989.
Shapiro, M. Wernli, A., H., Bao, J.-W., Methven, J., Zou, X., Doyle, J. D., Holt, T., Donall-Grell, E., and Neiman, P. J.: A planetary-scale to mesoplanetary-scale perspective of the life cycles of extratropical cyclones: The bridge between theory and observations, in The Life Cycles of Extratropical Cyclones, edited by S. Grøn˚as and M. A. Shapiro, 139–185, Am. Meteorol. Soc., Boston, Mass., 1999.
SPARC CCMVal: Report on the Evaluation of Chemistry-Climate Models, edited by: Eyring, V., Shepherd, T. G., and Waugh, D. W., SPARC Report No. 5, WCRP-132, WMO/TD- No. 1526, available at: www.sparc-climate.org, 2010.
Sprenger, M. and Wernli, H.: A Northern Hemispheric climatology of cross-tropopause exchange for the ERA15 time period (1979– 1993), J. Geophys. Res., 108, 8521, doi:10.1029/2002JD002636, 2003.
Sprenger, M., Wernli, H., and Bourqui, M.: Stratosphere-Troposphere Exchange and Its Relation to Potential Vorticity Streamers and Cutoffs near the Extratropical Tropopause. J. At-mos. Sci., 64, 1587–1602, 2007.
Strahan, S. E., Duncan, B. N., and Hoor, P.: Observationally de-rived transport diagnostics for the lowermost stratosphere and their application to the GMI chemistry and transport model, At-mos. Chem. Phys., 7, 2435–2445, doi:10.5194/acp-7-2435-2007, 2007.
Tilmes, S., Pan, L. L., Hoor, P., Atlas, E., Avery, M. A., Cam-pos, T., Christensen, L. E., Diskin, G. S., Gao, R.-S., Herman, R. L., Hintsa, E. J., Loewenstein, M., Lopez, J., Paige, M. E., Pittman, J. V., Podolske, J. R., Proffitt, M. R., Sachse, G. W., Schiller, C., Schlager, H., Smith, J., Spelten, N., Webster, C., Weinheimer, A., and Zondlo, M. A.: An aircraft-based upper tro-posphere and lower stratosphere O3, CO, and H2O climatology for the Northern Hemisphere, J. Geophys. Res., 115, D14303, doi:10.1029/2009JD012731, 2010.
Tomikawa, Y., Nishimura, Y., and Yamanouchi, T.: Characteristics of tropopause and tropopause inversion layer in the polar region, SOLA, 5, 141–144, doi:10.2151/sola.2009–036, 2009.