ACPD
12, 17001–17030, 2012Montreal Protocol benefits
T. Egorova et al.
Title Page
Abstract Introduction
Conclusions References
Tables Figures
◭ ◮
◭ ◮
Back Close
Full Screen / Esc
Printer-friendly Version Interactive Discussion
Discussion
P
a
per
|
Dis
cussion
P
a
per
|
Discussion
P
a
per
|
Discussio
n
P
a
per
|
Atmos. Chem. Phys. Discuss., 12, 17001–17030, 2012 www.atmos-chem-phys-discuss.net/12/17001/2012/ doi:10.5194/acpd-12-17001-2012
© Author(s) 2012. CC Attribution 3.0 License.
Atmospheric Chemistry and Physics Discussions
This discussion paper is/has been under review for the journal Atmospheric Chemistry and Physics (ACP). Please refer to the corresponding final paper in ACP if available.
Montreal Protocol benefits simulated with
CCM SOCOL
T. Egorova1, E. Rozanov1,2, J. Gr ¨obner1, M. Hauser2, and W. Schmutz1
1
PMOD/WRC, Davos, Switzerland
2
IAC ETH, Zurich, Switzerland
Received: 12 June 2012 – Accepted: 29 June 2012 – Published: 10 July 2012 Correspondence to: T. Egorova ([email protected])
ACPD
12, 17001–17030, 2012Montreal Protocol benefits
T. Egorova et al.
Title Page
Abstract Introduction
Conclusions References
Tables Figures
◭ ◮
◭ ◮
Back Close
Full Screen / Esc
Printer-friendly Version Interactive Discussion
Discussion
P
a
per
|
Dis
cussion
P
a
per
|
Discussion
P
a
per
|
Discussio
n
P
a
per
|
Abstract
Ozone depletion is caused by the anthropogenic increase of halogen containing species in the atmosphere, which results in the enhancement of the concentration of reactive chlorine and bromine in the stratosphere. To reduce the influence of an-thropogenic ozone-depleting substances (ODS), the Montreal Protocol was agreed by 5
Governments in 1987, with several Amendments adopted later. In order to assess the benefits of the Montreal Protocol and its Amendments (MPA) on ozone and UV
radia-tion, two different runs of the chemistry-climate model (CCM) SOCOL have been
car-ried out. The first run was driven by the emission of ozone depleting substances (ODS) prescribed according to the restrictions of the Montreal Protocol and all its Amend-10
ments. For the second run we allow the ODS to grow by 3 % annually. We find that the MPA would have saved up to 80 % of the global annual total ozone by the end of the 21st century. Our calculations also show substantial changes in surface tempera-ture and precipitations that could occur in the world without MPA implementations. To illustrate the changes in UV radiation at the surface and to emphasize certain features 15
which can only be seen for some particular regions if the influence of the cloud cover changes is accounted for, we calculate geographical distribution of the erythemally
weighted irradiance (Eery). For the no Montreal Protocol simulation Eery increases by
factor of 4 to 16 between the 1970s and 2100. For the scenario including the Montreal Protocol it is found that UV radiation starts to decrease in 2000, with continuous decline 20
of 5 % to 10 % at middle latitudes in the Northern and Southern hemispheres.
1 Introduction
The ozone hole in the Southern Hemisphere (Farman et al., 1985) and the ozone depletion in the Northern Hemisphere led to the promulgation of the Montreal Proto-col. In accordance with the Montreal Protocol and its Amendments and Adjustments, 25
ACPD
12, 17001–17030, 2012Montreal Protocol benefits
T. Egorova et al.
Title Page
Abstract Introduction
Conclusions References
Tables Figures
◭ ◮
◭ ◮
Back Close
Full Screen / Esc
Printer-friendly Version Interactive Discussion
Discussion
P
a
per
|
Dis
cussion
P
a
per
|
Discussion
P
a
per
|
Discussio
n
P
a
per
|
to decrease considerably. Extensive model experiments (WMO, 2011; SPARC CCM-Val, 2011) have shown that the atmospheric ozone column will increase reaching its values typical of the late 1970s in the middle of 21st century.
There were several attempts to estimate the effectiveness of the MPA. The first
esti-mates were made with an array of two-dimensional models (e.g., Prather et al., 1996; 5
World Meteorological Organization (WMO), 1999). Later on Egorova et al. (2001)
ex-ploited atmospheric chemical-transport model (ACTM) to assess the effect of the
Mon-treal Protocol and its Amendments (MPA). They carried out two model simulations with the University of Illinois at Urbana-Champaign (UIUC) ACTM , one with the ac-tual values of the chlorofluorocarbon (CFC) concentrations and another with the CFC 10
concentrations prescribed according to the “No-Protocol” (H1) scenario (WMO, 1999) wherein there is about a 3 % annual growth of the tropospheric CFC’s emission. They
showed that the MPA began to affect the ozone layer noticeably in 1996/97. For the
Northern Hemisphere the influence of the reduced active chlorine depends on the me-teorological situation and is more conspicuous for colder stratospheric winters. For the 15
Southern Hemisphere the effect mainly depends on the amount of chlorine loading.
The quantitative results that were obtained in this study are not accurate because the temperature and circulation fields were prescribed in the model. Ever since, the nu-merical models were greatly developed and presently the studies devoted to this issue exploit chemistry-climate models (CCM), which are able to simulate the interactions 20
between chemistry and thermo-dynamical processes. Recently two papers were
pub-lished which explore the effectiveness of Montreal Protocol and its Amendments using
state-of-the art CCMs. Morgenstern et al. (2008) applied the UK Chemistry and Aerosol
(UKCA) chemistry-climate model to study the effects of high chlorine loading on ozone
and climate. They compare two time slice simulations with the total chlorine loading of 25
ACPD
12, 17001–17030, 2012Montreal Protocol benefits
T. Egorova et al.
Title Page
Abstract Introduction
Conclusions References
Tables Figures
◭ ◮
◭ ◮
Back Close
Full Screen / Esc
Printer-friendly Version Interactive Discussion
Discussion
P
a
per
|
Dis
cussion
P
a
per
|
Discussion
P
a
per
|
Discussio
n
P
a
per
|
surface climate. Newman et al. (2009) employed the Goddard Earth Observing Sys-tem (GEOS) chemistry-climate model to explore the ozone distribution that might have occurred without ODS regulations. They carried out transient simulation from 1974 to
2065 using 3 % per year rate of equivalent effective chlorine growth and IPCC (2000)
A1b scenario for other greenhouse gases. They obtained very large ozone losses by 5
the end of the simulated time interval and a year-round ozone hole in the Southern Hemisphere. Furthermore, they also calculated the spectral changes in surface UV ir-radiance and showed that the obtained decreases in stratospheric ozone subsequently led to increases in erythemal irradiance for a cloud-free atmosphere. In particular they obtained threefold increase of the surface erythemal radiation in the summer of north-10
ern latitudes by 2065.
The above described research papers have shown that substantial ozone depletion could occur in the absence of the Montreal Protocol and its Amendments. However WMO (Ch.5, 2011) pointed out that Morgenstern et al. (2008) and Newman et al. (2009) did not include certain processes that could influence the results. In particular, the ab-15
sence of tropospheric chemistry in the both models does not allow taking into account possible increase of the tropospheric ozone due to the enhanced level of tropospheric UV irradiance and continuous changes of the ozone precursors. Moreover, Morgen-stern et al. (2008) did not simulate evolution of the ozone layer and did not consider the changes in radiative forcing from ODS. Newman et al. (2009) demonstrated dra-20
matic ozone depletion in the future and substantial alteration of the entire circulation regime of the stratosphere, which needs to be confirmed using independent models.
Therefore, new efforts to assess the MPA effectiveness were made in the context of
the CCM validation campaign CCMVal-2 (SPARC CCMVal, 2011). In the framework of this campaign the transient simulations with reference and world avoided scenarios 25
of ODS concentrations similar to Newman et al. (2009) were performed with several CCMs covering 1960–2100 but so far those simulations have not been analyzed. In our simulations with CCM SOCOL some of above mentioned feedbacks have been
ACPD
12, 17001–17030, 2012Montreal Protocol benefits
T. Egorova et al.
Title Page
Abstract Introduction
Conclusions References
Tables Figures
◭ ◮
◭ ◮
Back Close
Full Screen / Esc
Printer-friendly Version Interactive Discussion
Discussion
P
a
per
|
Dis
cussion
P
a
per
|
Discussion
P
a
per
|
Discussio
n
P
a
per
|
et al. (2009). Also our simulations cover the whole 21st century (end of the simula-tion in 2100) whereas Morgenstern et al. (2008) performed time slice experiments and Newman et al. (2009) terminated their simulations in 2065.
Here we describe the performed reference (with MPA) and scenario (no MPA) ex-periments and analyze the results that were obtained with CCM SOCOL (Schraner 5
et al., 2008) within the framework of the CCMVal-2 inter-comparison (SPARC
CCM-Val, 2011). We estimate the effectiveness of MPA on ozone, temperature, surface
tem-perature, precipitation and total ozone. We also investigate the influence of the Mon-treal Protocol on erythemally weighted UV irradiance (Eery) for the period 1960–2100 in
both cloud-free and cloudy atmospheres. The total ozone column is the main influenc-10
ing parameter on the amount of UV radiation which reaches the surface of the Earth (e.g. Tourpali et al., 2009). Other factors are ozone profile (e.g. McKenzie et al., 2003), albedo, aerosols and clouds. Any trend of these factors will influence future UV levels. Meel et al. (2007) suggest a decrease in cloud cover of 4 % by the end of the 21st century in most of the low and middle latitudes counteracting the recovery of the ozone 15
and leading to higher UV irradiance. Prediction of the aerosols is highly uncertain and
has not been included in our CCM runs.Eery is used as a metric to characterize future
UV levels. As novelty, this UV study evaluates the influence of the Montreal Protocol on UV radiation reaching the surface of the Earth compared to the situation if the Montreal Protocol had not been agreed upon. A similar investigation was performed by Newman 20
and McKenzie (2011) for clear sky UV irradiances. They also found significantly en-hanced UV levels under the “No Montreal Protocol Scenario”. However their study did not take into account changes in neither albedo nor cloud cover, which have important effects on surface UV irradiances.
Section 2 describes the CCM SOCOL and the performed simulations. Section 3 25
ACPD
12, 17001–17030, 2012Montreal Protocol benefits
T. Egorova et al.
Title Page
Abstract Introduction
Conclusions References
Tables Figures
◭ ◮
◭ ◮
Back Close
Full Screen / Esc
Printer-friendly Version Interactive Discussion
Discussion
P
a
per
|
Dis
cussion
P
a
per
|
Discussion
P
a
per
|
Discussio
n
P
a
per
|
2 Description of the model and numerical experiments
2.1 Model description
CCM SOCOL is a three dimensional global chemistry-climate model. It was developed at the Physical-Meteorological Observatory (Davos, Switzerland) in collaboration with ETH (Z ¨urich, Switzerland) and Voeikov Main Geophysical Observatory (St. Petersburg, 5
Russia) (Egorova et al., 2005). The CCM SOCOL is a combination of the middle atmo-sphere version of the European Center/Hamburg Model 4 General Circulation Model (MA-ECHAM4) (Manzini et al., 1997) with a modified version of the University of Illi-nois at Urbana–Champaign three-dimensional CTM Model for the Evaluation of Ozone Trends (MEZON) (Egorova et al., 2003).
10
The horizontal resolution of SOCOL is 3.75◦
×3.75◦. Vertically, this model is divided into 39 levels in a hybrid sigma/pressure coordinate system and extends from the
surface to 0.01 hPa (∼80 km). The CTM MEZON calculates the distributions of
con-centrations of 45 trace gases from the major atmospheric groups, which are deter-mined by 118 gas phase reactions, 33 photolytic reactions, and 16 heterogeneous 15
reactions. The transport of trace gases in the CTM MEZON is calculated using the advection scheme (Zubov et al., 1999). The time step for the dynamic core of the MA-ECHAM4 model is 15 min. Parameters of physical processes as well as photo-chemical processes are calculated every 2 h. The model parts of the CCM SOCOL (MEZON and MAECHAM4) exchange data on the fields of major dynamical variables 20
and radiatively active gases every 2 h. Concentrations of ozone, methane, nitrous ox-ide, chlorofluorocarbons, and stratospheric water vapor are transferred from MEZON to MA-ECHAM4, and three-dimensional distributions of temperature, water vapor concen-tration, and zonal, meridional, and vertical components of wind velocity are transferred from ECHAM4 to MEZON. Thus, the interactive character of the CCM SOCOL makes it 25
ACPD
12, 17001–17030, 2012Montreal Protocol benefits
T. Egorova et al.
Title Page
Abstract Introduction
Conclusions References
Tables Figures
◭ ◮
◭ ◮
Back Close
Full Screen / Esc
Printer-friendly Version Interactive Discussion
Discussion
P
a
per
|
Dis
cussion
P
a
per
|
Discussion
P
a
per
|
Discussio
n
P
a
per
|
The CCM SOCOL extensively participates in the international Chemistry–Climate Model Validation Activity (CCMVal) of the Stratospheric Processes and Their Role in Climate (SPARC) program on chemistry–climate model intercomparison and testing (Eyring et al., 2006, 2007, 2010). A preliminary intercomparison of the results from SOCOL test runs with analogous results from other models and with ground-based 5
and satellite observations showed a good overall performance of SOCOL. A number of model deficiencies in describing the global transport of chemical species and het-erogeneous processes in the polar region have been found (Eyring et al., 2007). In the improved model version (SOCOL 2.0; Schraner et al., 2008), the transport of the major families of the chlorine, nitrogen, and hydrogen groups was included in the transport 10
scheme, as result of which, in particular, the model managed to significantly improve the characteristics of the numerical transport of odd chlorine in the polar stratosphere. A more adequate scheme of mass correction in the horizontal semi-Lagrangian part of the numerical transport scheme was additionally used for calculating ozone transport, which in its formulation is not conservative. An updated thermodynamic parameteriza-15
tion for polar stratospheric cloud formation was also included in the model. The new model version more correctly describes the distribution, transport, and transformation of the atmospheric halogen-containing species and ozone in the middle and high lat-itudes in the stratosphere of both hemispheres (Schraner et al., 2008). The improved model version (SOCOL 2.0), with eleven other modern CCMs, has also been tested in 20
the experiments on the simulation of Southern Hemisphere ozone evolution in the last 25 yr of the 20th century (Karpechko et al., 2010).
2.2 Description of the numerical experiments
To assess the effectiveness of the Montreal Protocol and it’s Amendments we
car-ried out two 140-yr long transient simulations with CCM SOCOL v.2.0 (Schraner et 25
al., 2008) spanning 1960–2100 and driven by the prescribed evolution of the Sea Sur-face Temperature (SST), Sea Ice (SI), Greenhouse Gases (GHG), Ozone Depleting
ACPD
12, 17001–17030, 2012Montreal Protocol benefits
T. Egorova et al.
Title Page
Abstract Introduction
Conclusions References
Tables Figures
◭ ◮
◭ ◮
Back Close
Full Screen / Esc
Printer-friendly Version Interactive Discussion
Discussion
P
a
per
|
Dis
cussion
P
a
per
|
Discussion
P
a
per
|
Discussio
n
P
a
per
|
In the reference simulation GHG (N2O, CH4, and CO2) are taken from the
IPCC (2001) “A1B” scenario. We use simulated SSTs and SIs for the entire period from ECHAM5-MPIOM experiments (Roeckner et al., 2003, 2004). Surface mixing ra-tios of ODS are based on the halogen scenario A1 from WMO (2007) and on adjusted HCFCs scenario of nearly a full phase out in 2030. More detailed description of the ref-5
erence simulation and used anthropogenic forcing can be found in Eyring et al. (2010) and Morgenstern et al. (2010).
For the second scenario simulation (no MPA), which was designed to estimate the role of the Montreal Protocol, we applied ODS from the so called World Avoided
Sce-nario proposed by Velders et al. (2007) where ODS is increasing by∼3 % per year due
10
to the absence of the limitation introduced by MPA. The scenario starts in 1987 and shows what would have happened without any further national regulations, interna-tional agreements, or public actions. It is a transient simulation similar to the reference simulation, but with halogen loading evolution taken from the world avoided scenario throughout the simulation, whereas GHGs and SSTs/SIs are the same as in the refer-15
ence simulation.
3 Results
3.1 Zonal mean ozone and temperature
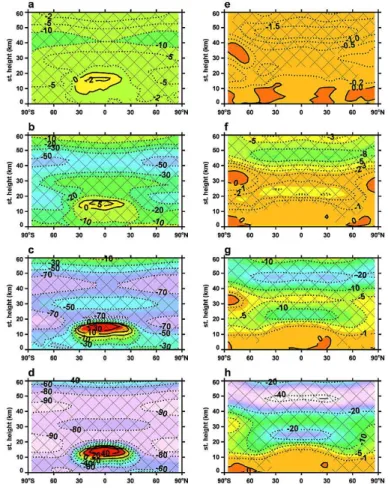
Figure 1 presents zonal mean distribution of annual mean ozone mixing ratio (in %) and
temperature (in K) as differences between the scenario (no MPA) and reference (MPA)
20
simulations for decadal averages 1987–2012 (a, e), 2025–2035 (b, f), 2055–2065 (c, g), and 2090–2100 (d, h). In our simulation the absence of MPA leads to the ozone de-crease everywhere except at 10–20 km in the tropical area, where we obtain 5 % ozone increase for the near future (2025–2035) more than 30 % for the 2055–2065 and more than 60 %, for the distant future (2090–2100). The latter effect is the result of the down-25
ACPD
12, 17001–17030, 2012Montreal Protocol benefits
T. Egorova et al.
Title Page
Abstract Introduction
Conclusions References
Tables Figures
◭ ◮
◭ ◮
Back Close
Full Screen / Esc
Printer-friendly Version Interactive Discussion
Discussion
P
a
per
|
Dis
cussion
P
a
per
|
Discussion
P
a
per
|
Discussio
n
P
a
per
|
and middle stratosphere followed by an increase of the oxygen photolysis rates in the lower stratosphere and enhanced level of active halogens. According to our calcula-tions for the present time without MPA we would have 10–20 % less ozone in the upper stratosphere as we have it currently and 6–8 % less ozone in the lower stratosphere in the polar areas of the Southern and Northern hemispheres. In comparison with sim-5
ulations by Morgenstern el al. (2008) for 2030 we have 10 % more ozone decrease in the upper stratosphere and good agreement in the polar areas of the lower strato-sphere. The area of tropical ozone increase is also in a good quantitative agreement with Morgenstern et al. (2008) results, but the location is somewhat lower, at 15 km. As seen from Fig. 1e, f, g, and h the ozone changes lead to concomitant changes in tem-10
perature. The upper stratosphere cools down by 1.5 K in 1987–2012 and up to 40 K in 2090–2100. The comparison with Morgenstern et al. (2008) results shows that in the upper stratosphere we obtain more pronounced cooling, which is expected because the sensitivity of their radiation code to the ozone changes is slightly smaller than in
our model (Forster et al., 2011). In the lower stratosphere our results show−3 K
cool-15
ing, while Morgenstern et al. (2008) have got only 0.5 K temperature decrease. The
cooling patterns in the polar stratosphere also look quite different. Results of CCM
SOCOL do not show a pronounced dipole structure. It means that by 2030 we have not obtained substantial changes of circulation fields. In comparison with the Newman et al. (2009) results we see good agreement in the middle stratosphere, where the 20
ozone loss reaches 40–60 % and in the upper stratosphere where both models show 70 % ozone decrease (see Fig. 1e). In the polar areas of the lower stratosphere we obtain 70–80 % ozone decrease, which is only about 10 % less then obtained by New-man et al. (2010). The most pronounced disagreement appears in the tropics, where the simulated ozone increase exceeds 30 % in our model while Newman et al. (2010) 25
ACPD
12, 17001–17030, 2012Montreal Protocol benefits
T. Egorova et al.
Title Page
Abstract Introduction
Conclusions References
Tables Figures
◭ ◮
◭ ◮
Back Close
Full Screen / Esc
Printer-friendly Version Interactive Discussion
Discussion
P
a
per
|
Dis
cussion
P
a
per
|
Discussion
P
a
per
|
Discussio
n
P
a
per
|
the middle stratosphere and 10 K in the tropical lower stratosphere and slight warming around 35 km over the southern high latitudes. The obtained temperature response is in a good agreement with the results obtained by Newman et al. (2010).
3.2 Total ozone
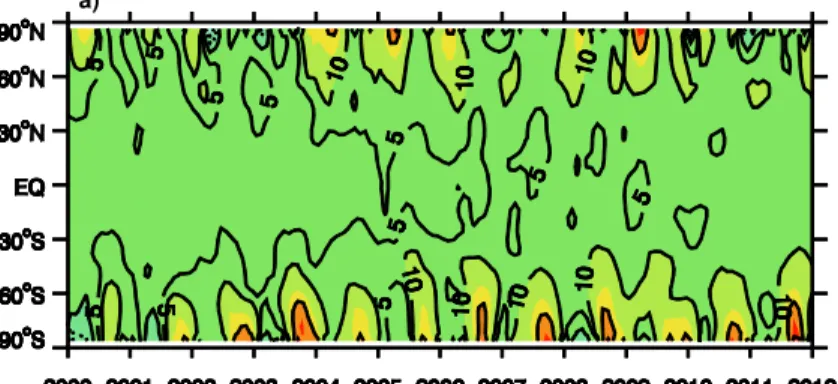
Figure 2 illustrates the time evolution of the monthly mean total ozone saved by MPA in 5
percent from 2000 to 2011 (a) and from 2055 to 2065 (b). It is clearly seen that the Polar Regions are the most sensitive to the reduction in the active halogen burden. We find that the MPA has already saved 10–30 % of the present-day total ozone in the Northern and Southern hemispheres. In the tropical and extra tropical latitudes the saved ozone amount exceeds 5 %. In 2055–2065 MPA prevent about 50 % of total ozone destruction 10
in the tropical and extra tropical latitudes and more than 70–80 % in the high latitudes of the Northern and Southern hemispheres.
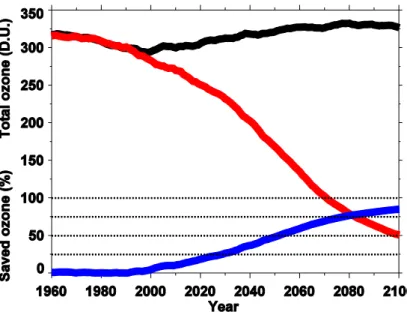
Figure 3 demonstrates that the ozone destruction by increased stratospheric halogen loading is also essential for the global and annual mean total column ozone. The
con-tinuous increase of stratospheric halogens leads to almost complete (∼80 %) global
15
ozone loss at the end of 21st century. The global total ozone loss calculated as the
difference between no MPA and MPA simulations is already rather dramatic in 2030
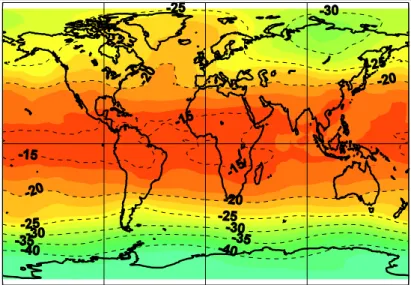
reaching∼80 D.U. The geographical distribution of the annual mean total ozone loss
for this particular year is illustrated in Fig. 4. As expected the most pronounced (30– 40 %) total ozone loss occurs over the cold polar areas, however, even in the tropics 20
the ozone loss can exceed 15 %. Over Europe and North America the total ozone loss is about 20 %, which would lead to an increase of dangerous erythemal irradiance by
∼20–30 %. The obtained results are in reasonable agreement with the total ozone loss
estimates published by Newman et al. (2009).
The geographical distribution of the annual-mean total ozone destruction prevented 25
ACPD
12, 17001–17030, 2012Montreal Protocol benefits
T. Egorova et al.
Title Page
Abstract Introduction
Conclusions References
Tables Figures
◭ ◮
◭ ◮
Back Close
Full Screen / Esc
Printer-friendly Version Interactive Discussion
Discussion
P
a
per
|
Dis
cussion
P
a
per
|
Discussion
P
a
per
|
Discussio
n
P
a
per
|
largest benefits during the last 10 yr were obtained in 2003, which reaches more than 30 %.
Figures 2a and 5 also show that for the present-day total ozone the effect of MPA
limitations on man-made halogen containing species depends not only on the amount of chlorine loading but also on the meteorological conditions and is more pronounced 5
for a colder stratospheric winter that support previous estimations provided by Egorova et al. (2001).
3.3 Surface air temperature and precipitation changes
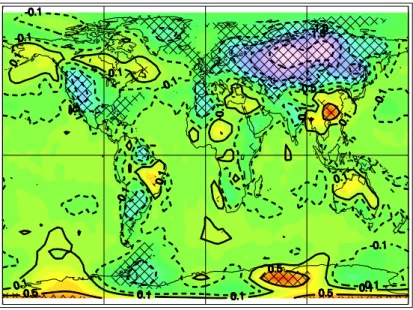
Large ozone loss leads to substantial and statistically significant changes in the surface air temperature over the continents illustrated in Fig. 6. The model results reveal pro-10
nounced surface warming of up to 1 K over the South Pole and Southern China. Less intensive and not statistically significant warm anomalies of about 0.5 K also appear over Greenland, Canada, north of Australia, Brazil and Paraguay. Very pronounced
cooling spots (up to−2.5 K) appear over Europe, Russia, Northern Asia (Kazakhstan
and Mongolia) and Argentina. Over the oceans the surface air temperature changes 15
are not large because the sea surface temperatures are the same in both scenario and reference run. In comparison with historical records of surface air temperature evo-lution the obtained large anomalies imply that in the world without MPA considerable climate impact is possible.
By the end of the 21st century our model simulates some changes in the precipitation 20
ACPD
12, 17001–17030, 2012Montreal Protocol benefits
T. Egorova et al.
Title Page
Abstract Introduction
Conclusions References
Tables Figures
◭ ◮
◭ ◮
Back Close
Full Screen / Esc
Printer-friendly Version Interactive Discussion
Discussion
P
a
per
|
Dis
cussion
P
a
per
|
Discussion
P
a
per
|
Discussio
n
P
a
per
|
4 Erythemal UV irradiance estimations
Clear sky surface UV irradiances have been calculated with the radiative transfer model UVSpec from libRadtran using the following output parameters from the CCM SOCOL: total column ozone, ozone profile, temperature profile, surface albedo and surface pres-sure (Mayer and Kylling, 2005). In this study, the standard plane-parallel disort algo-5
rithm (Stamnes et al., 1988) has been applied using 4 streams which gives an error of less than 0.5 % for solar zenith angles (SZA) smaller 750 and less than 1.5 % for larger SZA in comparison with the calculations using 16 streams. For all calculations the default aerosol profile of UVSPEC was used (Shettle, 1990). The mean elevation of every grid point as given by SOCOL has been used to set the surface height. For every 10
grid point the global, diffuse and direct UV irradiance spectrum have been calculated
for the 15th of each month and for local noon, to obtain an estimate for the maximum UV level. For this study, only the global irradiances have been used after the convolu-tion with the erythemal acconvolu-tion spectrum to estimate the impact of the UV levels on the human population; other weightings could be used depending on the application. The 15
future changes in cloud cover estimated by the CCM SOCOL have been converted to Cloud Modification Factors in the UV range using a formula developed by Den Outer et al. (2005). These correction factors were then multiplied with the modeled clear sky UV irradiances to obtain erythemal UV irradiances under cloudy conditions.
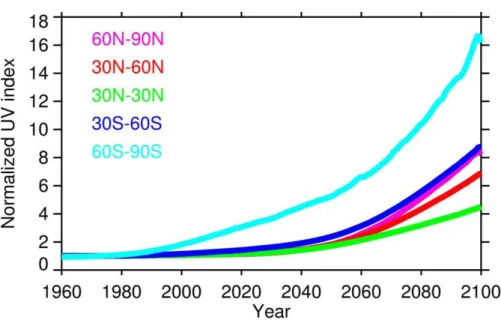
4.1 No Montreal Protocol scenario
20
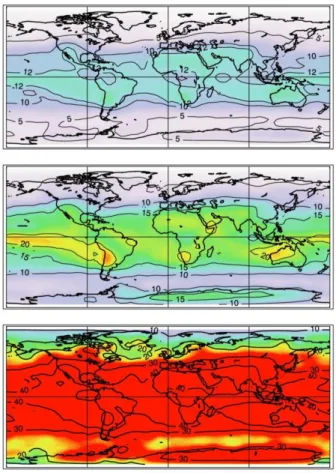
Under the assumption that the Montreal Protocol was not implemented, the surface UV irradiances undergo dramatic increases during the 21st century illustrated in Fig. 8. Even though the changes are modulated by latitude and season, erythemal UV irra-diances increase by factors of 4 to 16 between the 1970’s and 2100. As discussed in Newman and McKenzie (2011), the impact of these high UV levels on the whole bio-25
ACPD
12, 17001–17030, 2012Montreal Protocol benefits
T. Egorova et al.
Title Page
Abstract Introduction
Conclusions References
Tables Figures
◭ ◮
◭ ◮
Back Close
Full Screen / Esc
Printer-friendly Version Interactive Discussion
Discussion
P
a
per
|
Dis
cussion
P
a
per
|
Discussion
P
a
per
|
Discussio
n
P
a
per
|
Figure 9 displays the relative changes ofEery in September for five latitudinal bands
relative to the 1970–1979 average. The changes are largest over the southern high latitudes, with increases of more than a factor 16 by the end of this century due to the dramatic ozone losses over the Antarctic Peninsula. The relative increases over the middle and low latitudes are between 4 and 8 times the values found in the pre-5
Montreal Protocol era, leading to UVI values in excess of 50, which are more than double the highest values found currently on Earth.
These UV increases can be mainly attributed to the corresponding decrease in at-mospheric ozone due to the continuous emission of ozone depleting substances in the atmosphere, as described in the previous sections. Changes in the other parameters, 10
such as surface albedo or clouds have a negligible influence.
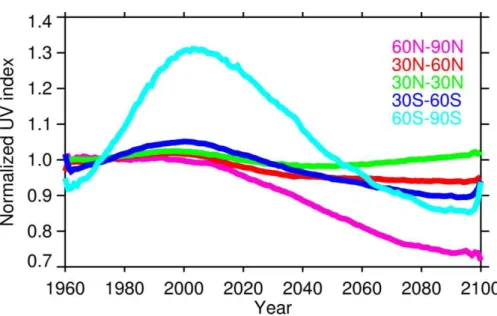
4.2 Montreal Protocol scenario
The CCM SOCOL reference run, implementing the Montreal Protocol limitations and the following amendments, was used to infer the most plausible future UV changes to be expected in the 21st century. Figure 10 shows the expected changes of erythemal 15
UV irradiances for five latitudinal bands, relative to the reference years. As can be seen in the figure, UV radiation increases slightly in the last decades of the previous century corresponding to the observed ozone decreases. In-line with the implementation of the Montreal Protocol, UV radiation starts to decrease around 2000, with continuous de-creases of 5 % to 10 % at middle latitudes in the Northern and Southern Hemispheres. 20
UV radiation actually decreases to lower values than found in the pre-ozone-hole pe-riod, but only by 5 % to 10 %. Larger decreases are observed at higher latitudes: in the Northern Hemisphere, UV radiation decreases by more than 20 %, while in the South-ern Hemisphere, UV radiation decreases by nearly 50 % due to the disappearance of the ozone hole over the Antarctic. While ozone changes have a well documented influ-25
ence on the future evolution of the UV radiation, cloud changes need to be taken into
account in this scenario as well so that the parameters affecting future UV changes
ACPD
12, 17001–17030, 2012Montreal Protocol benefits
T. Egorova et al.
Title Page
Abstract Introduction
Conclusions References
Tables Figures
◭ ◮
◭ ◮
Back Close
Full Screen / Esc
Printer-friendly Version Interactive Discussion
Discussion
P
a
per
|
Dis
cussion
P
a
per
|
Discussion
P
a
per
|
Discussio
n
P
a
per
|
Cloud changes are still difficult to model, showing large differences between the
CCMs participating at the CCMVal study. In CCM SOCOL, cloud transmission changes show an overall decreasing trend, as evidenced in Fig. 11 for the five latitudinal bands. The largest changes are seen in the high northern latitudes, with a relative decrease in cloud modification factor of 10 %, while at lower latitudes and in the Southern Hemi-5
sphere, CMFs remain more or less constant, with changes of less than 4 % between the 1960s and 2100. Thus, CCM SOCOL predicts an overall slight increase in cloud cover or cloud thickness, which is in opposing tendency to currently observed cloud trends (Gr ¨obner and Wacker, 2011; Maugeri et al., 2001; Trenberth et al., 2007; Smed-ley et al., 2012). As future UV trends will significantly depend on the changes in cloud 10
cover, increased efforts to model cloud changes in CCM models will be required to
better predict future UV levels.
As future aerosol scenarios were not taken into account in this model-run, modeled changes in UV radiation are therefore dominated by changes in the total column ozone and cloud cover.
15
5 Conclusions
In this article we evaluate the usefulness of such international agreements as the Montreal Protocol on the basis of numerical experiments carried out with the modern chemistry-climate model SOCOL in the framework of CCMVal campaign. Analysis of the simulated data allows the following conclusions. In the absence of MPA by 2100, the 20
mesosphere and stratosphere cool down by 40 K and 20 K, respectively, as a conse-quence of dramatic ozone depletion, which by the end of the 21st century could exceed 80 %. For the total ozone the simulated benefits of MPA reaches 50 % in the tropical latitudes and 70–80 % in high latitudes of both hemispheres. For the global annual ozone benefits of the MPA reach 50 % by the 2050 and 80 % by the 2100. Absence of 25
ACPD
12, 17001–17030, 2012Montreal Protocol benefits
T. Egorova et al.
Title Page
Abstract Introduction
Conclusions References
Tables Figures
◭ ◮
◭ ◮
Back Close
Full Screen / Esc
Printer-friendly Version Interactive Discussion
Discussion
P
a
per
|
Dis
cussion
P
a
per
|
Discussion
P
a
per
|
Discussio
n
P
a
per
|
undergoes a dramatic increase in the 21st century, with 5-fold increases in populated areas, corresponding to UVI values in excess of 50 in the summer months. In contrast, UV levels tend to decrease in the 21st century under the Montreal Protocol scenario, by 5 % to 10 % at middle latitudes with respect to pre-ozone hole period. This decrease is partly due to an increase in total column ozone in excess of the ozone levels found in 5
the 1960s, but also due to an increase in overall cloud cover, as estimated by CCM SO-COL. We find that expected ozone increases and changes in clouds have quantitatively similar influences on future surface UV radiation levels. Therefore, cloud processes and their radiative impacts need to be further studied in CCM model validation studies to better constrain this important parameter. All our results confirm the important role of 10
the Montreal Protocol on protecting the ozone layer of Earth’s atmosphere.
Acknowledgements. The work supported by the European Community’s Seventh Framework
Programme (FP7/2007-2013) under grant agreement No. 218816 (SOTERIA project, http:// www.soteria-space.eu.
References
15
Den Outer, P. N., Slaper, H., and Tax, R. B.: UV radiation in the Netherlands: Assessing long-term variability and trends in relation to ozone and clouds, J. Geophys. Res.-Atmos., 110, D02203, doi:10.1029/2004JD004824, 2005.
Egorova, T. A., Rozanov, E. V., Schlesinger, M. E., Andronova, N. G., Malyshev, S. L., Karol, I. L., and Zubov, V. A.: Assessment of the effect of the Montreal Protocol on atmospheric
20
ozone, Geophys. Res. Lett., 28, 2389–2392, 2001.
Egorova, T., Rozanov, E., Zubov, V., and Karol, I.: Model for investigating ozone trends (MEZON), Izv. Atmos. Ocean. Phy., 39, 277–292, 2003.
Egorova, T., Rozanov, E., Zubov, V., Manzini, E., Schmutz, W., and Peter, T.: Chemistry-climate model SOCOL: a validation of the present-day climatology, Atmos. Chem. Phys., 5, 1557–
25
1576, doi:10.5194/acp-5-1557-2005, 2005.
ACPD
12, 17001–17030, 2012Montreal Protocol benefits
T. Egorova et al.
Title Page
Abstract Introduction
Conclusions References
Tables Figures
◭ ◮
◭ ◮
Back Close
Full Screen / Esc
Printer-friendly Version Interactive Discussion
Discussion
P
a
per
|
Dis
cussion
P
a
per
|
Discussion
P
a
per
|
Discussio
n
P
a
per
|
E., Mancini, E., Manzini, E., Marchand, M., Marsh, D. R., Nagashima, T., Newman, P. A., Nielsen, J. E., Pawson, S., Pitari, G., Plummer, D. A., Rozanov, E., Schraner, M., Shepherd, T. G., Schibata, K., Stolarski, R. S., Struthers, H., Tian, W., and Yoshiki, M.: Assessment of temperature, trace species, and ozone in chemistry-climate model simulation of the recent past, J. Geophys. Res., 111, D22308, doi:10.1029/2006JD007327, 2006.
5
Eyring, V., Waugh, D. W., Bodeker, G. E., Cordero, E., Akiyoshi, H., Austin, J., Beagley, S. R., Boville, B., Braesicke, P., Br ¨uhl, C., Butchart, N., Chipperfield, M. P., Dameris, M., Deckert, R., Deushi, M., Frith, S. M., Garcia, R. R., Gettelman, A., Giorgetta, M., Kinnison, D. E., Mancini, E., Manzini, E., Marsh, D. R., Matthes, S., Nagashima, T., Newman, P. A., Nielsen, J. E., Pawson, S., Pitari, G., Plummer, D. A., Rozanov, E., Schraner, M., Scinocca, J. F.,
10
Semeniuk, K., Shepherd, T. G., Shibata, K., Steil, B., Stolarski, R., Tian, W., and Yoshiki, M. : Multi-model Projections of Stratospheric Ozone in the 21st Century, J. Geophys. Res., 112, D16303, doi:10.1029/2006JD008332, 2007.
Eyring, V., Cionni, I., Bodeker, G. E., Charlton-Perez, A. J., Kinnison, D. E., Scinocca, J. F., Waugh, D. W., Akiyoshi, H., Bekki, S., Chipperfield, M. P., Dameris, M., Dhomse, S., Frith, S.
15
M., Garny, H., Gettelman, A., Kubin, A., Langematz, U., Mancini, E., Marchand, M., Naka-mura, T., Oman, L. D., Pawson, S., Pitari, G., Plummer, D. A., Rozanov, E., Shepherd, T. G., Shibata, K., Tian, W., Braesicke, P., Hardiman, S. C., Lamarque, J. F., Morgenstern, O., Pyle, J. A., Smale, D., and Yamashita, Y.: Multi-model assessment of stratospheric ozone re-turn dates and ozone recovery in CCMVal-2 models, Atmos. Chem. Phys., 10, 9451–9472,
20
doi:10.5194/acp-10-9451-2010, 2010.
Farman, J. C., Gardiner, B. G., and Schaklin, J. D.: Large losses of the total ozone in Antarctica reveal seasonal ClOx/NOx interaction, Nature, 315, 207–210, 1985.
Forster, P., Fomichev, V., Rozanov, E., Cagnazzo, C., Jonsson, A. I., Langematz, U., Fomin, B., Iacono, M. J., Mayer, B., Mlawer, E., Myhre, G. , Portmann, R. W., Akiyoshi, H., Falaleeva, V.,
25
Gillett, N., Karpechko, A., Li, J., Lemennais, P., Morgenstern, O., Oberl ¨ander, S., Sigmond, M., and Shibata, K.: Evaluation of radiation scheme performance within chemistry climate models, J. Geophys. Res., 116, D10302, doi:10.1029/2010JD015361, 2011.
Intergovernmental Panel on Climate Change (IPCC): Climate change 2001, in: The Scientific Basis, Contribution of Working Group I to the Third Assessment Report of the
Intergovern-30
ACPD
12, 17001–17030, 2012Montreal Protocol benefits
T. Egorova et al.
Title Page
Abstract Introduction
Conclusions References
Tables Figures
◭ ◮
◭ ◮
Back Close
Full Screen / Esc
Printer-friendly Version Interactive Discussion
Discussion
P
a
per
|
Dis
cussion
P
a
per
|
Discussion
P
a
per
|
Discussio
n
P
a
per
|
Intergovernmental Panel on Climate Change (IPCC): Climate change 2007, in: The Physical Scienc Basis. Contribution of Working Group I to the Fourth Assessment Report of the In-tergovernmental Panel on Climate Change, edited by: Solomon, S., Qin, D., Manning, M., Chen, Z., Marquis, M., Averyt, K. B., Tignor, M., and Miller, H. L., 996 pp., Cambridge Univ. Press, Cambridge, UK, 2007.
5
Manzini, E., McFarlane, N., and McLandress, C.: Impact of the Doppler spread parameteriza-tion on the simulaparameteriza-tion of the middle atmosphere circulaparameteriza-tion using the MA/ECHAM4 general circulation model, J. Geophys. Res., 102, 25751–25762, doi:10.1029/97JD01096, 1997. Maugeri, M., Bagnati, Z., and Brunetti, M.: Trends in Italian total cloud amount, 1951–1996,
Geophys. Res. Lett., 28, 4551–4554, 2001.
10
Mayer, B. and Kylling, A.: Technical note: The libRadtran software package for radiative trans-fer calculations – description and examples of use, Atmos. Chem. Phys., 5, 1855–1877, doi:10.5194/acp-5-1855-2005, 2005.
McKenzie, R., Smale, D., Bodeker, G., and Claude, H.: Ozone profile differences between Eu-rope and New Zealand: Effects on surface UV irradiance and its estimation from satellite
15
sensors, J. Geophys. Res., 108, 4179, doi:4110.1029/2002JD002770, 2003.
Meehl, G. A., Stocker, T. F., Collins, W. D., Friedlingstein, P., Gaye, A. T., Gregory, J. M., Kitoh, A., Knutti, R., Murphy, J. M., Noda, A., Raper, S. C. B., Watterson, I. G., Weaver, A. J., and Zhao, Z.-C.: Global Climate Projections, in: Climate Change 2007: The Physical Science Basis, Contribution of Working Group I to the Fourth Assessment Report of the
Intergov-20
ernmental Panel on Climate Change, edited by: Solomon, S., Qin, D., Manning, M., Chen, Z., Marquis, M., Averyt, K. B., Tignor, M., and Miller, H. L., Cambridge University Press, Cambridge, UK and New York, NY, USA, 2007.
Morgenstern, O., Braesicke, P., Hurwitz, M. M., O’Connor, F. M., Bushell, A. C., Johnson, C. E., and Pyle, J. A.: The world avoided by the Montreal Protocol, Geophys. Res. Lett., 35,
25
L16811, doi:10.1029/2008GL034590, 2008.
Morgenstern, O., Giorgetta, M. A., Shibata, K., Eyring,V., Waugh,D.W., Shepherd, T. G., Akiyoshi, H., Austin, J., Baumgaertner, A. J. G., Bekki, S., Braesicke, P., Br ¨uhl, C., Chip-perfield, M. P., Cugnet, D., Dameris, M., Dhomse, S., Frith, S. M., Garny, H., Gettelman, A., Hardiman, S. C., Hegglin, M. I., Kinnison, D. E., Lamarque, J.-F., Mancini, E., Manzini, E.,
30
associ-ACPD
12, 17001–17030, 2012Montreal Protocol benefits
T. Egorova et al.
Title Page
Abstract Introduction
Conclusions References
Tables Figures
◭ ◮
◭ ◮
Back Close
Full Screen / Esc
Printer-friendly Version Interactive Discussion
Discussion
P
a
per
|
Dis
cussion
P
a
per
|
Discussion
P
a
per
|
Discussio
n
P
a
per
|
ated external forcings, J. Geophys. Res.-Atmos., 115, D00M02, doi:10.1029/2009jd013728, 2010.
Newman, P. A., Oman, L. D., Douglass, A. R., Fleming, E. L., Frith, S. M., Hurwitz, M. M., Kawa, S. R., Jackman, C. H., Krotkov, N. A., Nash, E. R., Nielsen, J. E., Pawson, S., Stolarski, R. S., and Velders, G. J. M.: What would have happened to the ozone layer if chlorofluorocarbons
5
(CFCs) had not been regulated?, Atmos. Chem. Phys., 9, 2113–2128, doi:10.5194/acp-9-2113-2009, 2009.
Karpechko, A. Yu., Gillett, N. P., Hassler, B., Rosenlof, K. H., and Rozanov, E.: Quantitative assessment of Southern Hemisphere ozone in chemistry-climate model simulations, Atmos. Chem. Phys., 10, 1385–1400, doi:10.5194/acp-10-1385-2010, 2010.
10
Prather, M., Midgley, P., Sherwood Rowland, F., and Stolarski, R.: The ozone layer: The road not taken, Nature, 381, 551–554, doi:10.1038/381551a0, 1996.
Roeckner, E. , B ¨auml, G., Bonaventura, L., Brokopf, R., Esch, M., Giorgetta, M., Hagemann, S., Kirchner, I., Kornblueh, L., Manzini, E., Rhodin, A., Schlese, U., Schulzweida, U., and Tompkins, A.: The atmospheric general circulation model EHAM5. Part I: Model description,
15
Rep. 218, 90 pp., Max-Planck-Ins. F ¨ur Meteorol., Hamberg, Germany, 2003.
Roeckner, E., Brokopf, R., Esch, M., Giorgetta, M., Hagemann, S., Kornblueh, L., Manzini, E., Schlese, U., and Schulzweida, U.: The atmospheric general circulation model EHAM5. Part II: Sencetivity of simulated climate to horizontal and vertical resolution, Rep. 354, Max-Planck-Ins. F ¨ur Meteorol., Hamburg, Germany, 2004.
20
Rozanov, E. V., Schlesinger, M., Zubov, V. A., Yang, F., and Andronova, N. G.: The UIUC three-dimensional stratospheric chemical transport model: description and evalua-tion of the simulated source gases and ozone, J. Geophys. Res., 104, 11755–11781, doi:10.1029/1999JD900138, 1999.
Schraner, M., Rozanov, E., Schnadt Poberaj, C., Kenzelmann, P., Fischer, A. M., Zubov, V., Luo,
25
B. P., Hoyle, C. R., Egorova, T., Fueglistaler, S., Br ¨onnimann, S., Schmutz, W., and Peter, T.: Technical Note: Chemistry-climate model SOCOL: version 2.0 with improved transport and chemistry/microphysics schemes, Atmos. Chem. Phys., 8, 5957–5974, doi:10.5194/acp-8-5957-2008, 2008.
Smedley, A. R., Rimmer, J. S., More, D., Toumi, R., and Webb, A. R.: Total ozone
30
ACPD
12, 17001–17030, 2012Montreal Protocol benefits
T. Egorova et al.
Title Page
Abstract Introduction
Conclusions References
Tables Figures
◭ ◮
◭ ◮
Back Close
Full Screen / Esc
Printer-friendly Version Interactive Discussion
Discussion
P
a
per
|
Dis
cussion
P
a
per
|
Discussion
P
a
per
|
Discussio
n
P
a
per
|
SPARC CCMVal: SPARC Report on the Evaluation of Chemistry-Climate Models, edited by: Eyring, V., Shepherd, T. G., and Waugh, D. W., SPARC, Rep. 5, WCRP-132, WMO/TD 1526, World Clim. Res. Program, Toronto, Ont., Canada, 2010.
Stamnes, K., Tsay, S. C., Wiscombe, W., and Jayaweera, K.: Numerically stable algorithm for discrete-ordinate-method radiative-transfer in multiple-scattering and emitting layered media,
5
App. Opt., 27, 2502–2509, 1988.
Tourpali, K., Bais, A. F., Kazantzidis, A., Zerefos, C. S., Akiyoshi, H., Austin, J., Br ¨uhl, C., Butchart, N., Chipperfield, M. P., Dameris, M., Deushi, M., Eyring, V., Giorgetta, M. A., Kin-nison, D. E., Mancini, E., Marsh, D. R., Nagashima, T., Pitari, G., Plummer, D. A., Rozanov, E., Shibata, K., and Tian, W.: Clear sky UV simulations for the 21st century based on ozone
10
and temperature projections from Chemistry-Climate Models, Atmos. Chem. Phys., 9, 1165– 1172, doi:10.5194/acp-9-1165-2009, 2009.
Trenberth, K. E., Jones, P. D., Ambenje, P., Bojariu, R., Easterling, D., Klein Tank, A., Parker, D., Rahimzadeh, F., Renwick, J. A., Rusticucci, M., Soden, B., and Zhai, P.: Observations: Surface and Atmospheric Climate Change, in: Climate Change 2007: The Physical Science
15
Basis. Contribution of Working Group I to the Fourth Assessment Report of the Intergov-ernmental Panel on Climate Change, edited by: Solomon, S., Qin, D., Manning, M., Chen, Z., Marquis, M., Averyt, K. B., Tignor, M., and Miller, H. L., Cambridge University Press, Cambridge, UK and New York, NY, USA, 2007.
Velders, G. J. M., Andersen, S. O., Daniel, J. S., Fahey, D. W., and McFarland, M.: The
im-20
portance of the Montreal Protocol in protecting climate, Proc. Natl. Acad. Sci. USA, 104, 4814–4819, doi:10.1073/pnas.0610328104, 2007.
World Meteorological Organization (WMO): Scientific assessment of ozone depletion: 1991, Global Ozone Res. Monit. Proj. Rep. 25, Geneva, Switzerland, 1992.
World Meteorological Organization (WMO): Scientific assessment of ozone depletion: 1998,
25
Global Ozone Res. Monit. Proj. Rep. 44, Geneva, Switzerland, 1999.
World Meteorological Organization (WMO): Scientific assessment of ozone depletion: 2006, Global Ozone Res. Monit. Proj. Rep. 50, Geneva, Switzerland, 2007.
World Meteorological Organization: Scientific Assessment of Ozone Depletion: 2010, Global Ozone Research and Monitoring Project, Report No. 52, Geneva, Switzerland, 2011.
30
ACPD
12, 17001–17030, 2012Montreal Protocol benefits
T. Egorova et al.
Title Page
Abstract Introduction
Conclusions References
Tables Figures
◭ ◮
◭ ◮
Back Close
Full Screen / Esc
Printer-friendly Version Interactive Discussion
Discussion
P
a
per
|
Dis
cussion
P
a
per
|
Discussion
P
a
per
|
Discussio
n
P
a
per
|
Fig. 1.Zonal mean annual mean ozone(a, b, c, d)(in %) and temperature(e, f, g, h) (in K)
ACPD
12, 17001–17030, 2012Montreal Protocol benefits
T. Egorova et al.
Title Page
Abstract Introduction
Conclusions References
Tables Figures
◭ ◮
◭ ◮
Back Close
Full Screen / Esc
Printer-friendly Version Interactive Discussion
Discussion
P
a
per
|
Dis
cussion
P
a
per
|
Discussion
P
a
per
|
Discussio
n
P
a
per
|
a)
b)
Fig. 2.Simulated year-to-year evolution of the total ozone destruction prevented by the MPA.
ACPD
12, 17001–17030, 2012Montreal Protocol benefits
T. Egorova et al.
Title Page
Abstract Introduction
Conclusions References
Tables Figures
◭ ◮
◭ ◮
Back Close
Full Screen / Esc
Printer-friendly Version Interactive Discussion
Discussion
P
a
per
|
Dis
cussion
P
a
per
|
Discussion
P
a
per
|
Discussio
n
P
a
per
|
Fig. 3.Time evolution of the global and annual mean total ozone for the reference (black) and
ACPD
12, 17001–17030, 2012Montreal Protocol benefits
T. Egorova et al.
Title Page
Abstract Introduction
Conclusions References
Tables Figures
◭ ◮
◭ ◮
Back Close
Full Screen / Esc
Printer-friendly Version Interactive Discussion
Discussion
P
a
per
|
Dis
cussion
P
a
per
|
Discussion
P
a
per
|
Discussio
n
P
a
per
|
Fig. 4.The geographical distribution of the annual mean total ozone loss (%) calculated as the
ACPD
12, 17001–17030, 2012Montreal Protocol benefits
T. Egorova et al.
Title Page
Abstract Introduction
Conclusions References
Tables Figures
◭ ◮
◭ ◮
Back Close
Full Screen / Esc
Printer-friendly Version Interactive Discussion
Discussion
P
a
per
|
Dis
cussion
P
a
per
|
Discussion
P
a
per
|
Discussio
n
P
a
per
|
Fig. 5.Geographical distribution of the annual-mean total ozone destruction prevented by the
ACPD
12, 17001–17030, 2012Montreal Protocol benefits
T. Egorova et al.
Title Page
Abstract Introduction
Conclusions References
Tables Figures
◭ ◮
◭ ◮
Back Close
Full Screen / Esc
Printer-friendly Version Interactive Discussion
Discussion
P
a
per
|
Dis
cussion
P
a
per
|
Discussion
P
a
per
|
Discussio
n
P
a
per
|
Fig. 6.Difference of the surface temperature between scenario (no MPA) and reference (MPA)
ACPD
12, 17001–17030, 2012Montreal Protocol benefits
T. Egorova et al.
Title Page
Abstract Introduction
Conclusions References
Tables Figures
◭ ◮
◭ ◮
Back Close
Full Screen / Esc
Printer-friendly Version Interactive Discussion
Discussion
P
a
per
|
Dis
cussion
P
a
per
|
Discussion
P
a
per
|
Discussio
n
P
a
per
|
Fig. 7.Precipitation difference (mm s−1) between scenario (no MPA) and reference (MPA)
ACPD
12, 17001–17030, 2012Montreal Protocol benefits
T. Egorova et al.
Title Page
Abstract Introduction
Conclusions References
Tables Figures
◭ ◮
◭ ◮
Back Close
Full Screen / Esc
Printer-friendly Version Interactive Discussion
Discussion
P
a
per
|
Dis
cussion
P
a
per
|
Discussion
P
a
per
|
Discussio
n
P
a
per
|
Fig. 8.Maximal UV indices observed in the years 2010, 2050 and 2090. The color scale was
ACPD
12, 17001–17030, 2012Montreal Protocol benefits
T. Egorova et al.
Title Page
Abstract Introduction
Conclusions References
Tables Figures
◭ ◮
◭ ◮
Back Close
Full Screen / Esc
Printer-friendly Version Interactive Discussion
Discussion
P
a
per
|
Dis
cussion
P
a
per
|
Discussion
P
a
per
|
Discussio
n
P
a
per
|
Fig. 9.Changes of erythemal weighted UV irradiances for five latitudinal bands 90N–60N (blue),
ACPD
12, 17001–17030, 2012Montreal Protocol benefits
T. Egorova et al.
Title Page
Abstract Introduction
Conclusions References
Tables Figures
◭ ◮
◭ ◮
Back Close
Full Screen / Esc
Printer-friendly Version Interactive Discussion
Discussion
P
a
per
|
Dis
cussion
P
a
per
|
Discussion
P
a
per
|
Discussio
n
P
a
per
|
Fig. 10.Changes of erythemal weighted UV irradiances for five latitudinal bands 90N–60N
ACPD
12, 17001–17030, 2012Montreal Protocol benefits
T. Egorova et al.
Title Page
Abstract Introduction
Conclusions References
Tables Figures
◭ ◮
◭ ◮
Back Close
Full Screen / Esc
Printer-friendly Version Interactive Discussion
Discussion
P
a
per
|
Dis
cussion
P
a
per
|
Discussion
P
a
per
|
Discussio
n
P
a
per
|
Fig. 11.Cloud modification factor (CMF) changes relative to the 1970–1979 average. A