doi:10.5194/cp-11-227-2015
© Author(s) 2015. CC Attribution 3.0 License.
A method for analysis of vanillic acid in polar ice cores
M. M. Grieman1, J. Greaves2, and E. S. Saltzman1
1Department of Earth System Science, University of California, Irvine, USA 2Department of Chemistry, University of California, Irvine, USA
Correspondence to:M. M. Grieman ([email protected])
Received: 20 May 2014 – Published in Clim. Past Discuss.: 4 July 2014
Revised: 9 November 2014 – Accepted: 6 January 2015 – Published: 11 February 2015
Abstract. Biomass burning generates a wide range of or-ganic compounds that are transported via aerosols to the po-lar ice sheets. Vanillic acid is a product of conifer lignin com-bustion, which has previously been observed in laboratory and ambient biomass burning aerosols. In this study a method was developed for analysis of vanillic acid in melted polar ice core samples. Vanillic acid was chromatographically sep-arated using reversed-phase liquid chromatography (HPLC) and detected using electrospray ionization–triple quadrupole mass spectrometry (ESI-MS/MS). Using a 100 µL injection loop and analysis time of 4 min, we obtained a detection limit of 77 ppt (parts per trillion by mass) and an analytical pre-cision of ±10 %. Measurements of vanillic acid in Arctic
ice core samples from the Siberian Akademii Nauk core are shown as an example application of the method.
1 Introduction
Biomass burning is an important part of the global carbon cycle and has a major impact on global atmospheric chem-istry. Emissions include a wide range of compounds, such as carbon dioxide, carbon monoxide, methane, volatile organic compounds, and aerosols. Emissions of CO and CH4affect
the global abundance of hydroxyl radicals (OH) and influ-ence the oxidative capacity of the troposphere (Crutzen and Andreae, 1990). Fire also influences climate by changing the albedo of the land surface (Randerson et al., 2006).
Several types of proxy records have been used to recon-struct change in biomass burning over time, but there is little consensus on regional and global trends or on the relation-ship between biomass burning and global climate. Evidence for historical rates of burning has been obtained from char-coal accumulation in lake sediments and
dendrochronologi-cal evidence of fire scars on tree rings (Marlon et al., 2008; Whitlock and Larsen, 2001). Global burning histories have also been inferred from variations in the stable isotopic com-position of ice core methane (Ferretti et al., 2005; Sapart et al., 2012).
Past fire events have been detected in Greenland ice from enrichment of ammonium, formate, and oxalate, and the transport of these chemicals to Summit, Greenland, in biomass burning plumes has been documented (Legrand et al., 1992; Dibb et al., 1996; Jaffrezo et al., 1998; Savarino and Legrand, 1998). Acetate and formate also have biogenic sources, which may limit their utility as fire proxies at less re-mote, continental ice core sites. In a continental Siberian ice core, a fire history was reconstructed from charcoal particles and variations in potassium and nitrate (Eichler et al., 2011). Another ice core chemical used as a biomass burning tracer is levoglucosan, an aerosol-borne anhydrous sugar exclusively produced by burning of cellulose. Levoglucosan is generated from combustion of all types of cellulose-containing plant matter and is therefore not specific to a particular plant type or ecosystem (Simoneit et al., 1999). Levoglucosan has been detected in air over Summit, Greenland, and in both Green-land and Antarctic ice (Kehrwald et al., 2012; Gambaro et al., 2008; Zennaro et al., 2014). There has been some debate about the atmospheric reactivity of levoglucosan and its suit-ability as a quantitative tracer for aerosol source apportion-ment (Hoffmann et al., 2010; Hennigan et al., 2010; Slade and Knopf, 2013).
40 60 80 100 120 140 160 0
0.5 1 1.5 2 2.5 3
ESI/MS/MS Response (10
6)
m/z 65
91 108
123 152
Figure 1. ESI-MS/MS product scan of vanillic acid using 30 eV collision energy.
burning to ambient aerosols on a local or regional basis (Nolte et al., 2001). Such compounds should be incorpo-rated into polar ice cores and may contain information about climate-related variability in biomass burning and about the nature of the combusted material.
In this study we focus on vanillic acid, a product of com-bustion of conifer lignin. Kawamura et al. (2012) detected vanillic acid in a Kamchatka Peninsula ice core using pre-concentration, derivatization, and gas chromatography–mass spectrometry (GC-MS), similar to techniques used for the analysis of biomass burning aerosols (Nolte et al., 2001; Si-moneit et al., 2004; Fu et al., 2008). This method involves analysis of relatively large ice core samples (80–250 mL), with extensive sample handling that requires preconcentra-tion by rotary evaporapreconcentra-tion, solvent extracpreconcentra-tion, heated deriva-tization to form trimethylsilyl derivatives, and dissolution in hexane. Zangrando et al. (2013) reported detection of vanillic acid and other phenolic compounds in Arctic aerosol samples using high-performance liquid chromatography with electro-spray ionization and tandem mass spectrometric detection (HPLC-ESI-MS/MS), which avoids the need for chemical derivatization prior to analysis. Our laboratory previously re-ported the observation of vanillic acid in a Greenland ice core using a continuous flow melter and analysis by ESI-MS/MS (McConnell et al., 2007). That method is capable of high temporal resolution while relying on the selectivity of the ESI-MS/MS to ensure the specificity of the analysis.
Here we report on the development of an analytical method for the rapid analysis of discrete ice core samples em-ploying HPLC-ESI-MS/MS. The performance of the method is illustrated using synthetic aqueous solutions and natural samples from the Siberian Akademii Nauk ice core.
2 Instrumentation
This study was carried out using a ThermoFinnigan TSQ Quantum System, consisting of a Surveyor autosam-pler, a liquid chromatograph (HPLC), and an electro-spray ionization–triple quadrupole mass spectrometer (ESI-MS/MS). Instrument control and data acquisition used the
0 5 10 15 20 25 30 35 40
0 1 2 3 4 5 6 7
Collision Energy (eV)
Response (10
6)
167→91 m/z 167→123 m/z 167→108 m/z 167→152 m/z
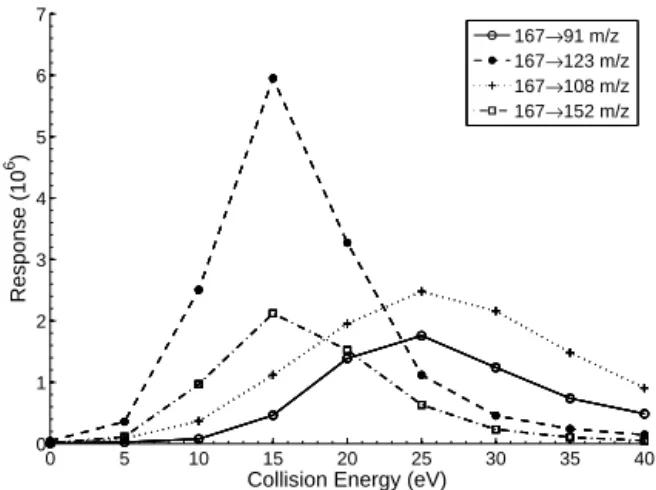
Figure 2.Instrument response to a 1 ppm vanillic acid solution at varying collision energies using the 167→91m/z, 167→123m/z, 167→108m/z, and 167→152m/zmass transitions.
Xcalibur data system (ThermoFinnigan Corp.). The electro-spray ion source was operated using the following condi-tions:−3 kV spray voltage, 38 psi sheath gas pressure, and
15 psi auxiliary gas pressure. For instrument tuning and sig-nal optimization, high-concentration vanillic acid solutions (1–10 ppm) were introduced directly into the ESI-MS/MS via syringe pump (NE-300, New Era). Vanillic acid was de-tected using the mass spectrometer in the negative ion mode, with an ion inlet cone temperature of 350◦C.
3 Method optimization and validation 3.1 Collision energy
MS/MS detection of vanillic acid was optimized using prod-uct scans with varying collision energies. Solutions contain-ing 1 ppm vanillic acid in a 75:25 % water : methanol
mix-ture were delivered directly to the electrospray source using the syringe pump. The vanillic acid [M−H]−(m/z167) was
used as the precursor mass, and the collision gas pressure was 1.5×10⁻⁴psi of Ar. Figure 1 shows a product scan at
a collision energy of 30 eV. The major product fragments un-der these conditions are C4H(O) (m/z65), C6H3O (m/z91),
C6H3(O)OH (m/z108), C6H3(OCH3)OH (m/z123), and
C6H3(O)(COO)OH (m/z152).
Figure 2 shows the fragmentation pattern as a function of collision energy over the range of 0–40 eV. Maxima were found at a collision energy of 15 eV for fragments atm/z152 (loss of CH3) andm/z123 (loss of CO2). Maxima were
ob-served at 25 eV for fragments atm/z 108 (loss of CH3 and
CO2) andm/z91 (loss of COOH and OCH3). The highest
response overall was obtained for them/z123 fragment at 15 eV. However, solvent noise at the 167→123 transition
0 200 400
600standard (1 ppb)
Response
0 0.5 1 1.5 2 2.5 3 3.5 4 0
200 400
600internal standard
Response
Time (minutes)
0 200 400
600ice core sample(570 ppt)
0 0.5 1 1.5 2 2.5 3 3.5 4 0
200 400
600internal standard
Time (minutes)
Figure 3. Vanillic acid chromatograms. Left: 1 ppb vanillic acid standard in Milli-Q water (12C, 167→108m/z) (upper) with 1 ppb internal standard (13C-labeled vanillic acid, 168→108m/z) (lower). Right: Akademii Nauk ice core sample containing 570 ppt vanillic acid (325 m depth, AD 286) (12C, 167→108m/z) (up-per) with 1 ppb internal standard (13C-labeled vanillic acid, 168→108m/z) (lower).
the 167→108 transition at a collision energy of 30 eV. These
conditions were used in this study.
3.2 Chromatography
The autosampler was programmed to inject 100 µL of sample onto a reversed-phase Kinetex 2.6 µm particle size XB-C18 100A analytical column (100 mm×2.2 mm, Phenomenex).
The mobile phase was an isocratic solution of 25 % methanol in water, flowing at 200 µL min−1. All of the column efflu-ent was directed to the electrospray ionization source. Vanil-lic acid is eluted from the column with a retention time of 2.5 min and a peak width at half height of 0.2 min. Chro-matograms of standard mixture of a 1 ppb vanillic acid stan-dard (167→108) and a 1 ppb 13C-labeled vanillic acid
iso-tope standard (168→108) are shown in Fig. 3 (left side).
3.3 Standardization and limit of detection
Standards were prepared using vanillic acid (4-hydroxy-3-methoxybenzoic acid, 97 % purity, Sigma-Aldrich). The in-ternal standard was13C-labeled vanillic acid (Carboxyl-13C, 99 % purity, Cambridge Isotope Laboratories). Stock solu-tions of 0.1 % vanillic acid and13C-labeled vanillic acid were prepared monthly in high-performance liquid chromatog-raphy (HPLC)-grade methanol (J. T. Baker). Intermediate 1 ppm standards were prepared daily in methanol. Working standards ranging from 0 to 2 ppb were prepared by dilution in ultrapure water (Millipore Milli-Q) directly in 2 mL Sur-veyor autosampler vials. The uncertainty in the accuracy of these standards is estimated to be±4 % based on the stated
purity of the reagent grade vanillic acid and the estimated uncertainty in our preparation of working standards. Sam-ples and standards were spiked with13C-labeled vanillic acid
(2 µL of 1 ppm internal standard in 2 mL) to generate a 1 ppb internal standard.
Calibration curves were constructed by analyzing vanil-lic acid standards ranging in concentration from 0 to 3 ppb. The calibration curves were based on the ratio of peak ar-eas of the vanillic acid and isotope-labeled vanillic acid signals at their respective mass transitions, 167→108 and
168→108. Using linear least-squares regression, the slope
of the calibration curve was 1.2±0.025 ppb−1and the
inter-cept was 0.035±0.047 (n=414). The detection limit is
ap-proximately 0.077 ppb, defined as 3 times the standard devi-ation of vanillic acid measurements in distilled water blanks spiked with the internal standard.
3.4 Matrix effects
Because polar ice core samples are complex mixtures of or-ganic and inoror-ganic compounds, it is important to quantify matrix effects that might suppress or enhance analyte re-sponse in an ice core sample compared to that in a pure wa-ter standard. This was done by comparing the response of the isotope-labeled internal standard in ice core samples to that in pure water. The response to the isotope-labeled stan-dard in ice core samples was identical to that in pure water standards. This clearly demonstrates the absence of signifi-cant matrix effects in the Akademii Nauk ice core samples analyzed in this study.
3.5 Selectivity
The identity of the vanillic acid peak was confirmed by an-alyzing a set of ice core samples using anion chromatogra-phy with ESI-MS/MS detection. These analyses were car-ried out on an IonPac AS18-Fast 2 µm analytical column with a 40 mM potassium hydroxide eluent at a flow rate of 200 µL min−1and an electrolytically regenerated
suppres-sor. Methanol was added to the eluent stream downstream of the suppressor in order to maintain a stable electrospray (70 µL min−1, J. T. Baker HPLC-MS grade). As in the HPLC method, the vanillic acid peak in ice core samples was eluted with the same retention time and peak shape as vanillic acid standards or isotope-labeled internal standards (11.9 min). The fragmentation pattern of the vanillic acid peak in ice core samples was identical to that in vanillic acid standards to within analytical precision (better than±10 %). The ratios of
the most abundant transitions (167→123, 167→108) were
within±4 %. A set of 47 samples analyzed by HPLC and
ion chromatography (IC) gave means of 0.206±0.135 and
0.177±0.127 ppb (±1σ), respectively, with anr2of 0.67.
4 Ice core sample analysis
0 0.2 0.4 0.6 0
0.1 0.2 0.3 0.4 0.5 0.6
original level (ppb)
replicate level (ppb)
slope = 0.935 ± 0.021
intercept = 0.008 ± 0.003
0 0.2 0.4 0.6
0 200 400 600 800 1000
vanillic acid (ppb)
relative deviation (%)
Figure 4.Measured vanillic acid level (ppb) compared to replicate vanillic acid level (ppb) (top). The line is the least-squares fit ac-counting for both the original and replicate measurements. Vanil-lic acid level (ppb) compared to the relative standard deviation (%) (bottom).
cap covering Komsomolets Island in the Eurasian Arctic (80◦
31′ N, 94◦
49′
E). The site was 800 m a.s.l.with a mean annual temperature of−15.7◦C. The ice core was drilled to
bedrock with a total depth of 723.91 m (Fritzsche et al., 2002, 2005; Weiler et al., 2005). The ice core samples analyzed for this study covered the time period AD 200–350. This is a provisional timescale (J. McConnell, Desert Research In-stitute, personal communication). Samples were melted us-ing a continuous melter, and collected in 8 mL HDPE vials using a peristaltic pump and fraction collector (McConnell et al., 2001).
The procedure used for analysis of ice core samples was as follows: 1 ppb of13C-labeled vanillic acid was added to each ice core sample and standard. Occasional blanks without in-ternal standard were also analyzed. A blank and/or standard was analyzed after every fifth ice core sample. Samples were typically analyzed in batches of 50–70 samples day−1 and typically calibration curves were based on all of the stan-dards and blanks analyzed on the same day. An example of a chromatogram from an Akademii Nauk ice core sample is shown in Fig. 3 (right side). The results of duplicate analysis of ice core samples are shown in Fig. 4. The relative stan-dard deviation of duplicates is about 30 % for levels above the detection limit and below 0.600 ppb (n=167).
The vanillic acid observed in 34 Akademii Nauk ice core samples, covering the time period of AD 200–350 is shown
Vanillic Acid (ppb)
Year
200 250 300 350
0 0.1 0.2 0.3 0.4 0.5 0.6 0.7 0.8
Figure 5.Vanillic acid concentrations in Akademii Nauk ice core samples plotted against ice age for the years AD 200–350.
in Fig. 5. Each sample represents approximately a 1 year average. Vanillic acid concentrations ranged from below the detection limit to 0.698 ppb, with an overall mean of 0.226±0.189 ppb (1σ) and a median of 0.156 ppb.
There are few reports of previous ice core measurements of vanillic acid, but the levels reported in the literature are generally similar to those measured here. Kawamura et al. (2012) reported vanillic acid levels ranging from be-low detection (0.005 ppb) to 0.125 ppb for samples from the Ushkovsky ice core on the Kamchatka Peninsula covering the time period 1690–1997. McConnell et al. (2007) reported vanillic acid levels from 0.001 to 0.350 ppb in ice core sam-ples from west-central Greenland ranging in age from AD 1788 to 2002.
5 Conclusions
This study demonstrates the feasibility of analyzing small ice core samples using HPLC-ESI-MS/MS with minimal sam-ple handling. The development of such rapid, low-volume, high-sensitivity analytical methods for analysis of organic compounds is needed in order to fully exploit the paleoen-vironmental information stored in the polar ice archive. For organic biomass burning tracers such as vanillic acid, the po-tential exists to observe variations in the intensity and loca-tion of high-latitude biomass burning over long timescales, with the caveat that such signals are influenced by atmo-spheric transport, chemical reactivity, and deposition.
resolution, which is needed in order to study variability in fire magnitude and frequency on decadal timescales. The po-tential exists to extend the HPLC-ESI-MS/MS technique to measure additional biomass burning products, as has been done for aerosols (Zangrando et al., 2013). This will be the focus of future work.
Acknowledgements. The ice core samples analyzed here were
provided by D. Fritzsche and colleagues at the Alfred Wegener In-stitute Helmholtz Centre for Polar and Marine Research and melted at the Desert Research Institute laboratory of Joseph McConnell. This research was funded by the National Science Foundation (ANT 0839122).
Edited by: C. Barbante
References
Crutzen, P. J. and Andreae, M. O.: Biomass Burning in the Tropics: Impact on Atmospheric Chemistry and Biogeochemical Cycles, Science, 250, 1669–1678, doi:10.1126/science.250.4988.1669, 1990.
Dibb, J. E., Talbot, R. W., Whitlow, S. I., Shipham, M. C., Winterle, J., McConnell, J., and Bales, R.: Biomass burning signatures in the atmosphere and snow at Summit, Greenland: An event on 5 August 1994, Atmos. Environ., 30, 553–561, doi:10.1016/1352-2310(95)00328-2, 1996.
Eichler, A., Tinner, W., Brütsch, S., Olivier, S., Papina, T., and Schwikowski, M.: An ice-core based history of Siberian for-est fires since AD 1250, Quaternary Sci. Rev., 30, 1027–1034, doi:10.1016/j.quascirev.2011.02.007, 2011.
Ferretti, D. F., Miller, J. B., White, J. W. C., Etheridge, D. M., Lassey, K. R., Lowe, D. C., Meure, C. M. M., Dreier, M. F., Trudinger, C. M., van Ommen, T. D., and Langen-felds, R. L.: Unexpected Changes to the Global Methane Budget over the Past 2000 Years, Science, 309, 1714–1717, doi:10.1126/science.1115193, 2005.
Fritzsche, D., Wilhelms, F., Savatyugin, L. M., Pinglot, J. F., Meyer, H., Hubberten, H.-W., and Miller, H.: A new deep ice core from Akademii Nauk ice cap, Severnaya Zemlya, Eurasian Arctic: first results, Ann. Glaciol., 35, 25–28, doi:10.3189/172756402781816645, 2002.
Fritzsche, D., Schutt, R., Meyer, H., Miller, H., Wilhelms, F., Opel, T., and Savatyugin, L. M.: A 275 year ice core record from Akademii Nauk ice cap, Severnaya Zemlya, Russian Arctic, Ann. Glaciol., 42, 361–366, doi:10.3189/172756405781812862, 2005.
Fu, P., Kawamura, K., and Barrie, L. A.: Photochemical and Other Sources of Organic Compounds in the Canadian High Arctic Aerosol Pollution during Winter-Spring, Environ. Sci. Technol., 43, 286–292, doi:10.1021/es803046q, 2008.
Gambaro, A., Zangrando, R., Gabrielli, P., Barbante, C., and Cescon, P.: Direct Determination of Levoglucosan at the Picogram per Milliliter Level in Antarctic Ice by High-Performance Liquid Chromatography/Electrospray Ionization Triple Quadrupole Mass Spectrometry, Anal. Chem., 80, 1649– 1655, doi:10.1021/ac701655x, 2008.
Hennigan, C. J., Sullivan, A. P., Collett, J. L., and Robinson, A. L.: Levoglucosan stability in biomass burning particles ex-posed to hydroxyl radicals, Geophys. Res. Lett., 37, L09806, doi:10.1029/2010GL043088, 2010.
Hoffmann, D., Tilgner, A., Iinuma, Y., and Herrmann, H.: At-mospheric stability of levoglucosan: a detailed laboratory and modeling study., Environ. Sci. Technol., 44, 694–699, doi:10.1021/es902476f, 2010.
Jaffrezo, J. L., Davidson, C. I., Kuhns, H. D., Bergin, M. H., Hillamo, R., Maenhaut, W., Kahl, J. W., and Harris, J. M.: Biomass burning signatures in the atmosphere of central Greenland, J. Geophys. Res.-Atmos., 103, 31067–31078, doi:10.1029/98JD02241, 1998.
Kawamura, K., Izawa, Y., Mochida, M., and Shiraiwa, T.: Ice core records of biomass burning tracers (levoglucosan and de-hydroabietic, vanillic and p-hydroxybenzoic acids) and total organic carbon for past 300 years in the Kamchatka Penin-sula, Northeast Asia, Geochim. Cosmochim. Ac., 99, 317–329, doi:10.1016/j.gca.2012.08.006, 2012.
Kehrwald, N., Zangrando, R., Gabrielli, P., Jaffrezo, J.-L., Boutron, C., Barbante, C., and Gambaro, A.: Levoglucosan as a specific marker of fire events in Greenland snow, Tellus B, 64, 18169, doi:10.3402/tellusb.v64i0.18196, 2012.
Legrand, M., De Angelis, M., Staffelbach, T., Neftel, A., and Stauffer, B.: Large perturbations of ammonium and organic acids content in the summit-Greenland Ice Core. Finger-print from forest fires?, Geophys. Res. Lett., 19, 473–475, doi:10.1029/91GL03121, 1992.
Marlon, J. R., Bartlein, P. J., Carcaillet, C., Gavin, D. G., Har-rison, S. P., Higuera, P. E., Joos, F., Power, M. J., and Pren-tice, I. C.: Climate and human influences on global biomass burning over the past two millennia, Nat. Geosci., 1, 697–702, doi:10.1038/ngeo313, 2008.
McConnell, J. R., Lamorey, G. W., Lambert, S. W., and Taylor, K. C.: Continuous Ice-Core Chemical Analyses Using Induc-tively Coupled Plasma Mass Spectrometry, Environ. Sci. Tech-nol., 36, 7–11, doi:10.1021/es011088z, 2001.
McConnell, J. R., Edwards, R., Kok, G. L., Flanner, M. G., Zender, C. S., Saltzman, E. S., Banta, J. R., Pasteris, D. R., Carter, M. M., and Kahl, J. D. W.: 20th-Century Industrial Black Carbon Emis-sions Altered Arctic Climate Forcing, Science, 317, 1381–1384, doi:10.1126/science.1144856, 2007.
Nolte, C. G., Schauer, J. J., Cass, G. R., and Simoneit, B. R. T.: Highly Polar Organic Compounds Present in Wood Smoke and in the Ambient Atmosphere, Environ. Sci. Technol., 35, 1912– 1919, doi:10.1021/es001420r, 2001.
Randerson, J. T., Liu, H., Flanner, M. G., Chambers, S. D., Jin, Y., Hess, P. G., Pfister, G., Mack, M. C., Treseder, K. K., Welp, L. R., Chapin, F. S., Harden, J. W., Goulden, M. L., Lyons, E., Neff, J. C., Schuur, E. A. G., and Zender, C. S.: The Impact of Bo-real Forest Fire on Climate Warming, Science, 314, 1130–1132, doi:10.1126/science.1132075, 2006.
Savarino, J. and Legrand, M.: High northern latitude forest fires and vegetation emissions over the last millennium inferred from the chemistry of a central Greenland ice core, J. Geophys. Res.-Atmos., 103, 8267–8279, doi:10.1029/97JD03748, 1998. Simoneit, B., Schauer, J., Nolte, C., Oros, D., Elias, V., Fraser, M.,
Rogge, W., and Cass, G.: Levoglucosan, a tracer for cellulose in biomass burning and atmospheric particles, Atmos. Environ., 33, 173–182, doi:10.1016/S1352-2310(98)00145-9, 1999.
Simoneit, B. R. T.: Biomass burning – a review of organic tracers for smoke from incomplete combustion, Appl. Geochem., 17, 129– 162, doi:10.1016/S0883-2927(01)00061-0, 2002.
Simoneit, B. R. T., Elias, V. O., Kobayashi, M., Kawamura, K., Rushdi, A. I., Medeiros, P. M., Rogge, W. F., and Didyk, B. M.: Sugars Dominant: Water-Soluble Organic Com-pounds in Soils and Characterization as Tracers in Atmo-spheric Particulate Matter, Environ. Sci. Technol., 38, 5939– 5949, doi:10.1021/es0403099, 2004.
Slade, J. H. and Knopf, D. A.: Heterogeneous OH oxidation of biomass burning organic aerosol surrogate compounds: assess-ment of volatilisation products and the role of OH concentration on the reactive uptake kinetics, Phys. Chem. Chem. Phys., 15, 5898–915, doi:10.1039/C3CP44695F, 2013.
Weiler, K., Fischer, H., Fritzsche, D., Ruth, U., Wilhelms, F., and Miller, H.: Glaciochemical reconnaissance of a new ice core from Severnaya Zemlya, J. Glaciol., 51, 64–74, doi:10.3189/172756505781829629, 2005.
Whitlock, C. and Larsen, C.: Charcoal as a Fire Proxy, Tracking Environmental Change Using Lake Sediments, edited by Smol, J., Birks, H., Last, W., Bradley, R., and Alverson, K., vol. 3 of Developments in Paleoenvironmental Research, 75–97, Springer, Netherlands, doi:10.1007/0-306-47668-1_5, 2001.
Zangrando, R., Barbaro, E., Zennaro, P., Rossi, S., Kehrwald, N. M., Gabrieli, J., Barbante, C., and Gambaro, A.: Molecular Markers of Biomass Burning in Arctic Aerosols, Environ. Sci. Technol., 47, 8565–8574, doi:10.1021/es400125r, 2013.