ISSN 0100-2945 http://dx.doi.org/10.1590/0100-29452016373
OPTIMUM PLOT SIZE AND NUMBER OF REPLICATIONS
IN PAPAYA FIELD EXPERIMENT
1EDILSON ROMAIS SCHMILDT2, OMAR SCHMILDT3, COSME DAMIÃO CRUZ4,
LAERCIO FRANCISCO CATTANEO5, GERALDO ANTÔNIO FERREGUETTI6
ABSTRACT- The aim of this study was to estimate the optimum plot size and number of replications in
papaya field experiments. Eleven variables were evaluated in four cultivars of papaya with planting in different
seasons between 2011 and 2013 in the north of the Espírito Santo state. Analysis were made from blank
test applied to 240 selected for planting season and cultivate plants in commercial fields. The determination of optimum plot size was performed by applying the methodologies of modified maximum curvature and maximum curvature of coefficient of variation. The determination of the number of repetitions was taken from the least significant difference in average 20% and 30%. The optimum plot size proved the same by
the two methods studied for most evaluations. The optimum size required differs among cultivars, between variables and between planting seasons, with the largest number of plants was required for the variables number of fruits per plant and yield per plant. We conclude that the optimal number of papaya plants planted
in the field is six plants per plot using three replications.
Index terms: Carica papaya L., experimental precision, experimental planning.
TAMANHO ÓTIMO DE PARCELAS E NÚMERO DE REPETIÇÕES
EM EXPERIMENTOS DE CAMPO COM MAMOEIRO
RESUMO- Objetivou-se neste estudo estimar o tamanho ótimo de parcelas e o número de repetições em mamoeiro cultivado a campo. Avaliaram-se onze variáveis em quatro cultivares de mamoeiro com plantio em diferentes estações do ano entre 2011 e 2013 no norte do Espírito Santo. As análises foram feitas a partir de ensaio em branco aplicado em 240 plantas selecionadas, por época de plantio e por cultivar, em lavouras comerciais. A determinação do tamanho ótimo de parcela foi feita aplicando-se as metodologias de máxima
curvatura modificado e máxima curvatura do coeficiente de variação. A determinação do número de repetições foi feita a partir da diferença mínima significativa da média de 20% e 30%. O tamanho ótimo da parcela
se mostrou o mesmo pelas duas metodologias estudadas para a maioria das avaliações. O tamanho ótimo requerido difere entre as cultivares, entre as variáveis e entre as épocas de plantio, sendo que o maior número de plantas foi requerido para as variáveis número de frutos por planta e produção por planta. Concluiu-se que o número ótimo de plantas em experimentos de mamoeiro plantados a campo é de seis plantas por parcela com uso de três repetições.
Termos para indexação: Carica papaya L., precisão experimental, planejamento experimental.
1(Trabalho 003-15). Recebido em: 05-01-2015. Aceito para publicação em: 30-07-2015.
2Eng. Agr., Dr., Professor, Deptº de Ciências Agrárias e Biológicas, Universidade Federal do Espírito Santo, CEUNES, São Mateus, ES. E-mail: [email protected]
3Eng. Agr., Dr., Pós Doutorando (PNPD/CAPES), Deptº de Ciências Agrárias e Biológicas, Universidade Federal do Espírito Santo, CEUNES, São Mateus, ES. E-mail: [email protected]
4Eng. Agr., Dr., Professor, Deptº de Biologia Geral, Universidade Federal de Viçosa, Campus Viçosa, Viçosa, MG. E-mail: cdcruz@ ufv.br
INTRODUCTION
Field experiments with papaya are common and should be established given the high demand of information in the different areas, emphasizing the studies regarding crop science, mechanization, breeding, irrigation and drainage, physiology, entomology, phytopathology, weed control, among other areas.
Regardless the experimental design, the randomization and existence of at least two replications are crucial, in order to estimate the error and, consequently, the analysis of variance can be performed (STEEL et al., 1997). The analysis of variance is a statistical tool that allows determining the experimental error, but local control and caution are ways to avoid that the variation not explained
to be minimally influenced by external factors or
by measuring errors. Thus, in order to minimize the experimental error, several strategies could be used, being part of good planning. The choice of the experimental design is one of these strategies and will depend, among others, on the studied crop, the
number of treatments, the environmental influences
on each treatment, and the number of experimental units (FEDERER, 1977).
There are several methods to determine the optimum plot size, where the most used is the
modified maximum curvature method, according
to Meier and Lessman (1971). Recently, Paranaíba et al. (2009) proposed the maximum curvature of
the coefficient of variation method, which has the
advantage of reducing the calculation necessary to determine the optimum plot size.
Research to determine the optimum plot size
in the field were performed for several crops, such
as abacaxi (LEONARDO et al., 2014), passion fruit (STORCK et al., 2014), canola (CARGNELUTTI
FILHO et al., 2015), sunflower (SOUZA et al., 2015),
among others.
In the literature, we only find the studies of
Lima et al. (2007) and Brito et al. (2012), with the aim of determining the optimum plot size with papaya plants. However, in both studies the evaluation concerned the performance of juvenile plants grown
in specific greenhouse conditions.
As there are no studies regarding plot
optimization for field experiments of papaya, each
researcher uses the size that better suits to its reality, determined by the availability of physical, technical,
and financial resources. Therefore, in the field studies involving papaya crop it is possible to find varied
plot sizes. There are reports studies using only one (PRATISSOLI at al., 2007) up to twenty plants per
plot (VIVAS et al., 2011).
Considering that the experimental error is closely related to the size of experimental plots (FEDERER, 1977) and that there is an optimum plot size for each character in each crop, it is concluded
that different sampling errors in field experiments
of papaya (COCHRAN, 1977) are assumed by researchers within each plot and previously to set the experiments. One of the consequences of this is that a good portion of the experimental variability
measured by the variation coefficients of some of
these trials could have been reduced if the plots had the minimum size and number.
The aim of the present study was to determine the optimum plot size assuming different number of replications for experiments with different papaya cultivars and planting times.
MATERIAL AND METHODS
The study was performed at the Santa Teresinha farm of the Caliman Agrícola S.A company, (parallel 19° 11’ 49” of latitude south and 40° 05’ 52” of longitude west) and approximate altitude of 30 meters, in the municipality of Linhares, Espírito Santo. The climate of the region is AWi type (humid tropical), with rain in the summer and dry winter (ROLIM et al., 1999).
The varieties of papaya THB and Golden, besides the hybrids F1 Tainung and Uenf/Caliman 01, were studied regarding the determination of plot size and number of replications.
The sowing of the seeds to produce the plants was performed in a nursery with polyolefin net
(shading net 50%). Trays containing 96 cartridges with capacity of 50 cm³ filled with Bioplant® substrate plus Basacot mini 3M® in the proportion of 10 kg m-³ of substrate were used, according to Paixão et al. (2012), in which two seeds by cartridge were sown. After being acclimatized the plants were
transplanted in the field, around 40 days after they
were sown, when its height was from 12 to 15 cm. Three plants per hole were planted in order to assure a greater number of hermaphrodite plants. For the cultivars THB and Golden the spacing was 3.6 x 1.5 m and for the hybrids Tainung 01 and Uenf/ Caliman 01, the spacing was 3.6 m between rows and 2.0 m between plants, in podzolic red yellow soil of sandy-clay texture. The sexing was done after three months from planting, being kept a hermaphrodite plant per hole
The first evaluations were performed when the first fruits in ripening stage two (2) appeared,
phytosanitary control and other cultural practices were performed according the recommendation for the crop (MARTELLETO et al; 2013; COSTA et al., 2013).
The assessed variables were: plant height (PH) – corresponding to the distance between soil surface, contiguous to plant neck, and the insertion point of the youngest leaf, expressed in centimeters; height
of the first fruit insertion (HFFI) – corresponding to
the distance between soil surface, contiguous to the
plant neck, and the insertion point of the first fruit,
in centimeters; trunk diameter (TD) – evaluated at 20 cm from the soil, using a caliper, expressed in centimeters; number of marketable fruits (NMF) – all the fruits of the plant meeting the commercial standard; fruit mass (FM) – expressed in grams, measured in a precision scale with three decimal
places; potential production per tree in the first year
(PP), obtained by the multiplication between NMF and FM; fruit length (FL) – measured with caliper and expressed in centimeters; diameter of the median region of the fruit (DF) – expressed in centimeters;
thickness of fruit flesh (TF) – measured with caliper
and expressed in centimeters; diameter of the fruit cavity (DFC) - measurement taken after a cross cutting of the fruit in the equatorial region, expressed in centimeters; total soluble solids (TSS), by direct reading in bench refractometer, and expressed in oBrix and internal firmness of the fruit (FIRM) –
determined using a penetrometer (Instrutherm, medol PTR-100) and expressed in Newton (N), measured in three equidistant points along the thickness of
the flesh from the cross cutting of the fruit in the
equatorial region, using a proble of 7.9 mm. For the variables related to fruit, MFR to FIRM, one fruit of each of the 240 plants of each cultivar was evaluated. These fruits were harvested in ripening stage two (2),
with up to 25% of the skin in the yellow color and
evaluated in the same day in the postharvest lab of the Caliman company.
The time of planting in the field, as well as the
planted area and the data collection time are shown in Table 1. In each area, 240 plants were evaluated, in a blank assay, with four rows of 60 plants located
in the center of the field. Altogether 1920 plants
were evaluated.
Determination of optimum plot size
For each of the twelve characters evaluated in the 240 plants of the black essay performed for each of the four cultivars of the different planting times, it was determined the optimum plot size using two
methods: Modified Maximum Curvature Method,
according to Meier and Lessman (1971), that we have
assigned by X0ML ; and the Maximum Curvature
of the Coefficient of Variation Method according to
Paranaíba et al. (2009) that we have assigned byX0P. For the determination of the X0ML, 240 plants of the blank assay were structured in basic experimental units (BEU), where each BEU was constituted of one plant. The evaluations of the 12
variables in the field were made in each BEU. Then, with the data available and the precise identification
of each plant, it was proceeded the calculations. For that, the BEU were grouped using the number of exact divider plants of the total number of plants of the blank assay, varying from one (1) up to 30 BEU,
forming 11 groupings. For each specific grouping
it was assesses all the possibilities of grouping composition by the evaluation of the plants within each of the four rows (DL) of 60 plants or plants between rows (EL). Thus, the grouping size (Xi) were, in BEU: X1 = 1 (1DL x 1EL); X2 = 2 (1DL x 2EL, 2DL x 1EL); X3 = 3 (3DL x 1EL); X4 = 4 (4DL x 1EL, 1DL x 4EL and 2DL x 2EL); X5 = 5 (5DL x 1EL); X6 = 6 (6DL x 1EL and 3DL x 2EL); X7 = 10 (10DL x 1EL and 5DL x 2EL); X8 = 12 (12DL x 1EL, 6DL x 2EL and 3DL x 4EL); X9 = 15 (15DL x 1EL); X10 = 20 (20DL x 1EL, 10DL x 2EL and 5DL x 4EL); X11 = 30 (30DL x 1EL and 15DL x 2EL).
For each of the Xi BEU it was calculated the variance among plots (V(xi)), the coeficiente of variation among plots(CV(xi)) and the variance by BEU among the plots of Xi BEU of size, given by VU(xi) = V(xi)/X2
i.
From the group of 11 information of the Xi and CV(Xi) the equation CV(Xi)=b0Xi-b
1 was
adjusted. Using the values of the constant (b0) and
of the regression coefficient, (b1) the plot size was calculated through the equation:
X0ML = b2 0b
2
1 (2b1 +1) b1 + 2
To calculate X0P, the 240 plants of the four rows of the blank assay were numbered from 1 to 240, according the their sequence in the adjacent rows. From these 240 plants it was determined the sample mean (m), sample variance (s2), and the estimation
of the spatial autocorrelation coefficient of first order
(r), using the number sequence of the plants:
Di = xi - x e r =
Σ
240 DiDi-1/Σ
240 D2i and where xi is the value observed in the plan i.
Therefore, the plot size X0P was determined by: (10/m) (
√
2(
1-r2)s2m)
[
]
i=2 i=2
3
^ ^ ^
^
1 2+2b^1
(Determination of plot size assuming different number of replications
In order to determine the necessary plot size assuming different number of replications of each variable for each cultivar for each planting
time, it was used the least significant difference
between means (Di) through the method proposed by Hatheway (1961). For that, the heterogeneity index (b) was determined, through the logarithm of the function, VU(Xi) =V1/Xb
i according to Smith (1938). The Di is given by Di =
√
2(
t
1 + t2)2b20 / rXbi
)
, where r is the number of replications, b0, Xi, and bwere previously defined, t1 is the tabulated value of
t for the significance tests (bilateral at 5%) and t2 is the tabulated value of t corresponding an error of 2(1-p), where p=0,80 the probability of obtaining
significant results. The tabulated values of the t
distribution were obtained with gl degrees of freedom of the residue, assuming a completely randomized design, that gl=I(r – 1), where I is the number of treatments admitted in the exact division I=240/(rXi), and r taken as 2, 3, 4, and 5 replications and the Xi the size of the BEU as previously set (1, 2, 3, 4, 5, 6, 10, 12, 15, 20, and 30). Thus, for each r replication the values of Di were obtained, that depending on the Xi the regression Di = AXi-Bwas estimated. From
the linearization of this equation and fixing Di as
20 or 30%, the values of Xi were obtained, which correspond to the number of plants per plot.
The data were analyzed using the computer resources of the interactive software Matlab (MATLAB, 2010), performing the calculations with thirteen decimal places.
RESULTS AND DISCUSSION
The results of the analysis from the 240 plants of each of the four papaya cultivars in different planting times are shown in Table 2.
Although the means (m) of the characters
plant height (PH), height of the first fruit insertion
(HFFI), fruit mass (FM), and fruit diameter (FD) were not evaluated by test of means, they were greater for the hybrids Tainung 01 e Uenf/Caliman 01, of the “Formosa” group, when compared to the varieties THB and Golden, of the “solo” group. These results are in agreement with the expected and that were observed by Silva (2013), evaluating the same cultivars, in a germplasm bank, in the autumn planting of 2011.
In the evaluation of the means of the number of marketable fruits (NMF) per plant of THB, it was found NMF = 78, in the summer of 2012, and NMF = 54, in the summer of 2013. Despite this difference
of 24 fruits per plant, which might represent 12 kg of fruit per plant, this result is according the reality of commercial planting, since the production of papaya is largely influenced by environmental factors (DAMASCENO JÚNIOR et al., 2008). It is interesting to show that the optimum size is of six plants by plot for NMF of the two planting times, through both methodologies used. This highlights that only the average is not enough to affect the differences in the optimum plot size, through the methodologies of Meier and Lessman (1971) and Paranaíba et al. (2009).
In the comparison of the optimum plot size
between the Modified Maximum Curvature Method
(X0ML) of Meier and Lessman (1971) and the
Maximum Curvature of the Coefficient of Variation
Method (X0P) of Paranaíba et al. (2009), it was observed that both methods showed similar results
in 92% of the 60 evaluations performed, and that
in the other evaluations where the results diverged, the method of Paranaíba et al. (2009) provided an estimate of the optimum plot size with differences of only one plant less. These results of the comparison of both methods disagree of those found by Paranaíba et al. (2009) working with rice. These authors found the greater plot size was observed for maximum
curvature of the coefficient of variation method.
Thus, the results found in the present study should not be extrapolated to other variables that may be evaluated or even to working plots with different sizes of the study, which was 240 plants.
The optimum plots size showed variation among the variables within the same cultivar, as well as for the same variable among cultivars and also for ‘THB’ between planting times. So, the optimum plot size varied from two plants by plot through the evaluation of FD and total soluble solids (TSS) in
the variety Golden, and flesh firmness (FIRM) in the
hybrid Tainung 01, to six plants by plot observed for NMF and production per plant (PP) in most varieties and planting times. Storck et al. (2014), evaluating thirteen variables in eight passion fruit genotypes, in the same planting time, have also found different plot size requirements among the variables and genotypes. They also observed the greater sampling size was required to number of fruits per plant and production per plant. Similar response was observed
by Lima et al. (2007), evaluating five variables in
the ‘Golden’ and ‘Tainung 01’ papaya grown in polyethylene bags, in greenhouse.
Besides the optimum plot size, it is important that the researcher situate himself around the number
of the means of 20% (Di = 20%), using only two
replications. The percentage rises to 83% using three replications and reaches 97% using five replications.
The variable production per tree (PP) requires the larger plot size, where this size is of size plants for the four varieties. For ‘THB’ and ‘Uenf/Caliman 01’ in the summer planting of 2012, the adoption of six plans by plot and precision Di = 20%, requires an experiment with more than 5 replications. Therefore, considering the researcher is interested in the evaluation of all variables evaluated in the present study, he can use the optimum size of six plants by plot, in three replications (18 plants by treatment in the experiment), assuming Di = 30%. In order to keep the maximum Di of 20%, the researcher could use 11 plants by plot and two replications (22 plants by treatment in the experiment), seven plants by plot
and five replications (35 plants by treatment in the
experiment) or other options as shown in Table 2. Similar results of organization among the number of plants by plot and the number of replications were also shown by Souza et al. (2015), which determined
the optimum plot size for sunflower.
Still regarding plot size, it is seen in Table 2 that the researcher might use a plot size smaller than the optimum. However, in this case he will have to choose a higher number of replications and sometime assume a greater percentage for Di. In the other hand, the researcher that is using more than six
plants by plot with three replications or more will be decreasing Di, despite spending more than needed in its experimentation.
The results of the present study are useful to
guide researchers in papaya field experiments, since
there is not a standard number of plants by plot and number of replications, as can be observed in the
following studies: five plants by plot (OLIVEIRA
et al., 2014), six plants by plot (REIS et al., 2015), eight plants by plot (DIAS et al., 2011), ten plants by plot (CARDOSO et al., 2014), twelve plants by
plot (FERREIRA et al., 2012), and fifteen plants by
plot (MESQUITA et al., 2007).
The optimum sampling size of six plants by plot should be understood as the number of plants to be evaluated, around eight months after planting. This does not mean the researcher should use only six plants by plot. This concern should take into
account the training particularities of papaya fields,
among which we could cite: The interest variables fall upon hermaphrodite plants and depending on segregation, not all plants in a plot are hermaphrodite; need to eliminate diseased plants manly those with viral diseases. Thus, the researcher, as far as possible, should establish each plot with number of plants greater than six. The additional number of plants relative to what was set in this study will depend,
among other factor, on the financial resources and
experimental area available.
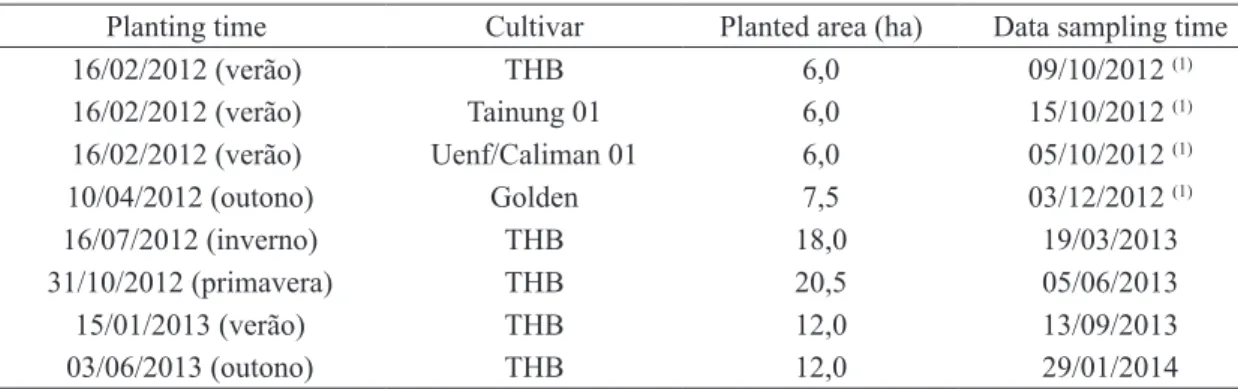
TABLE 1 – Planting time, planted are and, data sampling time of different papaya cultivars, in the Espírito Santo state, for determination of plot size and number of replications.
Planting time Cultivar Planted area (ha) Data sampling time
16/02/2012 (verão) THB 6,0 09/10/2012 (1)
16/02/2012 (verão) Tainung 01 6,0 15/10/2012 (1)
16/02/2012 (verão) Uenf/Caliman 01 6,0 05/10/2012 (1)
10/04/2012 (outono) Golden 7,5 03/12/2012 (1)
16/07/2012 (inverno) THB 18,0 19/03/2013
31/10/2012 (primavera) THB 20,5 05/06/2013
15/01/2013 (verão) THB 12,0 13/09/2013
03/06/2013 (outono) THB 12,0 29/01/2014
TABLE 2 - Mean (m), optimum plot size determined through the Modified Maximum Curvature Method
(X0ML) according to Meier and Lessman (1971) and through the Maximum Curvature of
the Coefficient of Variation Method (X0P) according to Paranaíba et al. (2009), the plot size
according to the number of replications for a least significant difference of the mean (D) of 20% and 30%, evaluated in variables of papaya in different cultivars and planting times.
Variables(1) m X
0ML X0P
D = 20% D = 30%
Replications Replications
2 3 4 5 2 3 4 5
THB – planting in the summer of 2012
PH 169.75 3 3 3 3 2 2 2 2 2 2
HFFI 78.05 4 4 6 5 4 4 4 3 3 3
TD 10.51 4 4 4 3 3 3 3 2 2 2
NMF 77.61 6 6 9 7 6 6 6 5 4 4
FM 545.67 4 4 6 5 4 4 4 3 3 3
PP 42.31 6 6 11 9 8 7 7 6 5 5
FL 14.52 3 3 3 2 2 2 2 2 2 1
FD 8.63 3 2 3 2 2 2 2 2 1 1
TF 2.61 4 4 4 3 3 3 3 2 2 2
DFC 4.71 4 4 4 4 3 3 3 3 2 2
TSS 11.23 3 3 3 3 2 2 2 2 2 2
FIRM 118.81 4 3 4 4 3 3 3 3 2 2
Tainung 01 – planting in the summer of 2012
PH 233.18 3 3 3 2 2 2 2 2 2 1
HFFI 118.29 3 3 4 3 3 3 3 2 2 2
TD 11.54 3 3 3 3 2 2 2 2 2 2
NMF 28.50 5 5 8 6 5 5 5 4 4 3
FM 1381.20 4 4 5 4 4 3 4 3 3 2
PP 39.32 6 6 9 7 6 6 6 5 4 4
FL 24.40 3 3 3 2 2 2 2 2 1 1
FD 10.77 3 3 3 2 2 2 2 2 2 1
TF 3.34 3 3 3 3 3 2 2 2 2 2
DFC 6.07 3 3 4 3 3 3 3 2 2 2
TSS 11.05 4 4 5 4 4 3 4 3 3 2
FIRM 125.59 2 2 2 2 1 1 1 1 1 1
Uenf/ Caliman 01 – planting in the summer of 2012
PH 216.90 3 3 3 2 2 2 2 2 2 1
HFFI 87.78 5 4 6 5 5 4 4 4 3 3
TD 12.07 4 3 4 3 3 3 3 2 2 2
NMF 38.30 6 6 10 8 7 6 7 6 5 4
FM 1116.30 4 4 5 4 3 3 3 3 2 2
PP 42.89 6 6 11 9 8 7 8 6 5 5
FL 21.52 3 3 3 2 2 2 2 2 2 1
FD 10.17 3 3 3 2 2 2 2 2 1 1
TF 2.71 3 3 4 3 3 3 3 2 2 2
DFC 5.69 3 3 4 3 3 2 3 2 2 2
TSS 13.12 3 3 3 3 2 2 2 2 2 2
FIRM 124.60 4 4 4 3 3 3 3 2 2 2
Golden – planting in the autumn of 2012
PH 206.26 3 3 3 2 2 2 2 2 1 1
HFFI 97.79 3 3 3 3 2 2 2 2 2 2
NMF 51.07 5 5 7 6 5 4 5 4 3 3
FM 524.47 4 4 5 4 4 3 4 3 3 2
PP 26.77 6 5 8 7 6 5 6 5 4 4
FL 13.24 3 3 3 2 2 2 2 2 1 1
FD 8.73 2 2 2 2 2 2 2 1 1 1
TF 2.70 3 3 3 3 2 2 2 2 2 2
DFC 5.35 3 3 4 3 3 2 3 2 2 2
TSS 12.32 2 2 2 2 2 2 2 1 1 1
FIRM 99.64 3 3 3 2 2 2 3 2 2 2
THB – planting in the winter of 2012
PH 165.28 3 3 3 3 2 2 2 2 2 2
HFFI 60.39 3 3 4 3 3 2 3 2 2 2
TD 11.27 3 3 3 3 2 2 2 2 2 2
NMF 74.58 5 5 6 5 5 4 4 4 3 3
THB – planting in the spring of 2012
PH 171.92 3 3 4 3 3 2 3 2 2 2
HFFI 86.01 4 4 5 4 4 3 4 3 3 2
TD 10.41 3 3 4 3 3 2 3 2 2 2
NMF 63.51 5 5 7 5 5 4 5 4 3 3
THB – planting in the summer of 2013
PH 181.05 3 3 4 3 3 2 3 2 2 2
HFFI 77.95 4 4 5 4 4 3 4 3 3 2
TD 10.50 3 3 4 3 3 3 3 2 2 2
NMF 54.07 6 6 9 7 6 5 6 5 4 4
THB – planting in the autumn of 2013
PH 155.25 3 3 4 3 3 2 3 2 2 2
HFFI 57.90 4 4 5 4 3 3 3 3 2 2
TD 10.01 4 3 4 3 3 3 3 2 2 2
NMF 67.52 6 5 9 7 6 5 6 5 4 4
(1) PH: plant height, in m; HFFI: height of first fruit insertion, in m; TD: trunk diameter, in cm; NMF: number of marketable fruits per
plant; FM: fruit mass, in g; PP: estimated production per tree in the first year; FL: fruit length, in cm; FD: fruit diameter, in cm; TF: thickness of the flesh, in cm; DFC: diameter of the internal fruit cavity, in cm; TSS: total soluble solids, in degree Brix; FIRM: flesh firmness, in Newtons.
CONCLUSION
The optimum size for field papaya experiments
if six plants by plot, using three replications.
Variables
(1)M
X
0
ML
X
0P
D = 20%
D = 30%
Repetições
Repetições
2
3
4
5
2
3
4
5
ACKNOWLEDGMENTS
The authors thank the Caliman Agrícola
S.A. by technical support in the field study and the
REFERENCES
BRITO, M.C.M.; FARIA, G.A.; MORAIS, A.R.; SOUZA, E.M.; DANTAS, J.L.L. Estimação do tamanho ótimo de parcela via regressão antitônica. Revista Brasileira de Biometria, São Paulo, v.30, n.3, p.353-366, 2012. Disponível em: <http:// jaguar.fcav.unesp.br/RME/fasciculos/v30/v30_n3/ A4_Marcio.pdf >.
CARDOSO, D.L.; LUZ, L.N.; MACÊDO, C.M.P.; GONÇALVES, L.S.A.; PEREIRA, M.G. Heterosis in papaya: inter and intragroup analysis. Revista Brasileira de Fruticultura, Jaboticabal, v.36, n.3, p.619-619, 2014. Disponível em: <http://www.scielo. br/pdf/rbf/v36n3/v36n3a12.pdf >.
CARGNELUTTI FILHO, A.; ALVES, B.M.; BURIN, C.; KLEINPAUL, J.A.; SILVEIRA, D.L. Tamanho de parcela e número de repetições em canola. Bragantia, Campinas, v.74, n.2, p.176-183, 2015. Disponível em: <http://www.scielo.br/pdf/ brag/v74n2/0006-8705-brag-167844990420.pdf >.
COCHRAN, W.G. Sampling techniques. 3rd ed.
New York: John Wiley & Sons, 1977. 448p.
COSTA, A.N.; COSTA, A.F.S.; FERREGUETTI, G.A. Cultivo do mamoeiro: manejo da fertilidade do solo e da nutrição do mamoeiro. Informe Agropecuário, Belo Horizonte, v.34, n.275, p.38-47, 2013.
DAMASCENO JUNIOR, P.C.; PEREIRA, T.N.S.; SILVA, F.F.; VIANA, A.P.; PEREIRA, M.G. Comportamento floral de híbridos de mamoeiro (Carica papaya L.) avaliados no verão e na primavera. Revista Ceres, Viçosa, MG, v.55, n.4, p.310-316, 2008. Disponível em: <http://www.ceres. ufv.br/ceres/revistas/V55N004P04908.pdf>.
DIAS, N.L.P.; OLIVEIRA, E.J.; DANTAS, J.L.L. Avaliação de genótipos de mamoeiro com uso de descritores agronômicos e estimação de parâmetros
genéticos. Pesquisa Agropecuária Brasileira,
Brasília, v.46, n.11, p.1471-1479, 2011. Disponível em: <http://www.scielo.br/pdf/pab/v46n11/ v46n11a08.pdf >.
.
FEDERER, W.T. Experimental design: theory and application. 3rd ed. New York: Oxford & IBH Publishing, 1977. 593p.
FERREIRA, J.P; SCHMILDT, O.; SCHMILDT, E.R.; PIANTAVINHA, W.C.; CATTANEO, L.F. Correlações entre características morfo-agronômicas de acessos de mamoeiro. Enciclopédia Biosfera, Goiânia, v.8, n.14, p.246-257, 2012. Disponível em: <http://www.conhecer.org.br/enciclop/2012a/ agrarias/correlacoes.pdf>.
HATHEWAY, W. H. Convenient plot size. Agronomy Journal, Madison, v.53, n.4, p.279-280, 1961. Disponível em: <http://www.worldcat.org/title/ convenient-plot-size/oclc/708673253>.
LEONARDO, F. de A.P.; PEREIRA, W.E.; SILVA, S. de M.; ARAÚJO, R. da C.; MENDONÇA, R.M.N. Tamanho ótimo da parcela experimental de abacaxizeiro ‘Vitória’. Revista Brasileira de Fruticultura, Jaboticabal, v.36, n.4, p.909-916, 2014. Disponível em: <http://www.scielo.br/pdf/rbf/ v36n4/a18v36n4.pdf >.
LIMA, J.F.; PEIXOTO, C.P.; LEDO, C.A.S.; FARIA, G.A. Tamanho ótimo de parcela para experimentos com plantas de mamoeiro em casa de vegetação. Ciência e Agrotecnologia, Lavras, v.31, n.5, p.1411-1415, 2007. Disponível em: <http://www.scielo.br/ pdf/cagro/v31n5/21.pdf >.
MARTELLETO, L.A.P.; SUDO-MARTELLETO, M.; MACHADO, A.F.L.; VASCONCELLOS,
M.A.S. Cultivo do mamoeiro: manejo fitotécnico.
Informe Agropecuário, Belo Horizonte, v.34, n.275, p.29-37, 2013.
MATLAB version 7.10.0 (R2010a). Massachusetts: The MathWorks, 2010.
MESQUITA, E.F.; CAVALCANTE, L.F.; GONDIM, S.C.; CAVALCANTE, I.H.L.; ARAÚJO, F.A.R.;
CAVALCANTE, M.Z. Produtividade e qualidade
de frutos do mamoeiro em função de tipos e doses de biofertilizantes. Semina: Ciências Agrárias, Londrina, v.28, n.4, p. 589-596, 2007. Disponível em: <http://www.uel.br/revistas/uel/index.php/ semagrarias/article/view/2890/2448>.
OLIVEIRA, E.J.; FRAIFE FILHO, G.A.; FREITAS, J.P.X.; DANTAS, J.L.L. Desempenho produtivo e interação genótipo x ambiente em híbridos e linhagens de mamoeiro. Bioscience Journal, Uberlândia, v. 30, n. 2, p. 402-410, 2014. Disponível em: <http://www. seer.ufu.br/index.php/biosciencejournal/article/ view/17988/13755>.
PAIXÃO, M.V.S.; SCHMILDT, E.R.; MATTIELLO, H.N.; FERREGUETTI, G.A.; ALEXANDRE, R.S. Frações orgânicas e mineral da produção de mudas de mamoeiro. Revista Brasileira de Fruticultura, Jaboticabal, v. 34, n.4, p.1105-1112, 2012. Disponível em: <http://www.scielo.br/pdf/rbf/v34n4/18.pdf >.
PARANAÍBA, P.F.; FERREIRA, D.F.; MORAIS, A.R. Tamanho ótimo de parcelas experimentais: Proposição de métodos de estimação. Revista Brasileira de Biometria, São Paulo, v.27, n.2, p.255-268, 2009. Disponível em: <http://jaguar.fcav.unesp. br/RME/fasciculos/v27/v27_n2/Patricia.pdf>. .
PRATISSOLI, D.; ALMEIDA, G.D.; JESUS JÚNIOR, W.C.; VICENTINI, V.B.; HOLTZ, A.M.; COCHETO, J.G. Fertilizante organomineral e argila silicatada como indutores de resistência à varíola do mamoeiro, Idesia, Chile, v.25, n.2, p.63-67, 2007. Disponível em: <http://www.scielo.cl/pdf/idesia/ v25n2/art08.pdf>.
REIS, R.C.; SOUZA VIANA, E.S.; JESUS, J.L.; DANTAS, J.L.L.; LUCENA, R.S. Caracterização físico-química de frutos de novos híbridos e linhagens de mamoeiro. Pesquisa Agropecuária Brasileira, Brasília, v.50, n.3, p.210-217, 2015. Disponível em: <http://www.scielo.br/pdf/pab/ v50n3/0100-204X-pab-50-03-00210.pdf>.
ROLIM, S.G.; COUTO, H.T.Z.; JESUS, R.M. Mortalidade e recrutamento de árvores na Floresta Atlântica de Linhares (ES). Scientia Forestalis, Piracicaba, n.55, p.49-69, 1999. Disponível em: <http://www.ipef.br/publicacoes/scientia/nr55/cap4. pdf >.
SILVA, C.A. Divergência genética entre acessos de mamoeiro e correlações entre suas características no Norte do Espírito Santo. 2013. 66f. Dissertação (Mestrado em Agricultura Tropical) - Universidade Federal do Espírito Santo, Vitória, 2013.
SMITH, H. F. An empirical law describing heterogeneity in the yields of agricultural crops. Journal of Agricultural Science, Cambridge, v.28, n.1, p.1-23, 1938. Disponível em: <http://journals. cambridge.org/action/displayAbstract?fromPage=o
nline&aid=4689276&fileId=S0021859600050516>.
SOUSA, R.P. de; SILVA, P.S.L.; ASSIS, J.P. de; SILVA, P.I.B.; SILVA, J.C.V. Optimum plot size for
experiments with the sunflower. Revista Ciência Agronômica, Fortaleza, v.46, n.1, p.170-175, 2015. Disponível em: <http://www.scielo.br/pdf/rca/ v46n1/0045-6888-rca-46-01-0170.pdf>.
STEEL, R.G.D.; TORRIE, J.H.; DICKEY, D.A. Principles and procedures of statistics: a biometrical approach. 3rd ed. New York: MacGraw-Hill Book Companies, 1997. 666p. STORCK, L.; LÚCIO, A.D.; KRAUSE, W.; ARAÚJO, D.V.; SILVA, C.A. Scaling the number of plants per plot and number of plots per genotype of yellow passion fruit plants. Acta Scientiarum.Agronomy, Maringá, v.36, n.1, p.73-78, 2014. Disponível em: <http:// periodicos.uem.br/ojs/index.php/ActaSciAgron/ article/view/17697/pdf_1>.